Unpublished working paper
←
→
Page content transcription
If your browser does not render page correctly, please read the page content below
Unpublished working paper

 Finance and Firm Volatility:
 Evidence from Small Business Lending in China
 Tao Chen, Yi Huang, Chen Lin, and Zixia Sheng*
 December 2019
Abstract
The online trading platform Alibaba provides financial technology (FinTech) credit for millions of
micro, small, and medium enterprises (MSMEs). Using a novel dataset of weekly sales and an
internal credit score threshold that governs the allocation of credit, we apply a fuzzy Regression
Discontinuity Design (RDD) to explore the causal effect of credit access on firm volatility. We find
that credit access significantly reduces firm sales volatility and that the effect is strongly
countercyclical. We also find that the negative effect on firm volatility is concentrated in firms
that are young, that are in regions with lower economic growth and poorer legal environment
and contract enforcement, and that are in more competitive industries. We further look at firm
exit probability and find that firms with access to FinTech credit are less likely to go bankrupt or
exit the business in the future. Overall, our findings contribute to a better understanding of the
role of FinTech credit in MSMEs.

Keywords: FinTech Credit; E-Commerce Microcredit; Firm Volatility; Regression Discontinuity
Design; Microfinance; Credit Scoring
JEL classification: G21; G32; G33

*
 Tao Chen is from Nanyang Business School, Nanyang Technological University: jtchen@ntu.edu.sg; Yi Huang is from
the Graduate Institute, Geneva: yi.huang@graduateinstitute.ch; Chen Lin is from the University of Hong Kong:
chenlin1@hku.hk; Zixia Sheng is from Ant Financial Services Group. We acknowledge the generous support of Ant
Financial Services Group in providing data and helpful discussions of institutional details. We are grateful to Yan Bai,
Long Chen, Hui Chen, Robin Chou, Darrell Duffie, Paolo Fulghieri, Lei Gao, Shan Ge, Bin Guo, Harald Hau, Zhiguo He,
Bengt Holmstrom, Yunzhi Hu, Sabrina Howell, Kose John, Sung Kwan Lee, Simone Lenzu, Geng Li, Ye Li, TC Lin, Xin Liu,
Michelle Lowry, Ron Masulis, Pedro Matos, Benoît Mojon, Paige Ouimet, Christopher Palmer, Shi Piao, Buhui Qiu,
David Reeb, Jay Ritter, Andrew Rose, Anthony Saunders, Jianfen Shen, Jingyi Shi, Hyun Shin, Elena Simintzi, Johan
Sulaeman, Tao Sun, Andreas Stathopoulos, David Thesmar, Emil Verner, Vikrant Vig, Pengfei Wang, Shangjin Wei, Wei
Xiong, Takeshi Yamada, David Yermack, Kathy Yuan, Bohui Zhang, Xiaoyan Zhang, Feng Zhu, Zhongyan Zhu, and
seminar and conference participants at MIT Sloan School of Management, NYU Stern School of Business, Kenan-
Flagler Business School, the University of North Carolina at Chapel Hill, University of Florida Warrington College of
Business, Fanhai School of International Finance, Fudan University, Wuhan University, Wuhan Tech University,
Australian National University, University of Sidney, University of New South Wales, HKUST, National University of
Singapore Business School, Hong Kong Institute for Monetary Research, Luohan Academy, Alibaba Group, Bank for
International Settlements, the Federal Reserve Board of Governors, 2018 NCCU Symposium on Finance, 2019 FRG
Workshop, 2019 NTU Finance Conference, 2019 Asian Finance Association Annual Meeting, 2019 FMA Asia-Pacific
Annual Meeting, and 2019 NBER Conference on the Chinese Economy for their insightful views and comments. We
thank Hongzhe Shan, Sibo Liu, and Li Zhang for providing excellent research assistance.
Disclaimer: The views expressed herein are those of the authors and do not necessarily reflect any of Ant Financial
or its management. The statements herein are not suited to deduce conclusions about Ant Financial. The analysis
was performed in accordance with Chinese laws and regulations on privacy.
1. Introduction
 Although a large volume of research shows that access to external financing spurs firm growth
(e.g., Beck, Demirgüç-Kunt, & Maksimovic, 2005; Black & Strahan, 2002; Demirgüç-Kunt &
Maksimovic, 1998; Rajan & Zingales, 1998), less is known about the impact of credit access on
firm volatility.1 This is surprising given that firm volatility could influence corporate financing and
investment (Arellano et al., 2019; Campbell et al., 2001; Campello et al., 2011) and thus impact
economic growth at the national or international level (e.g., Aghion et al., 2010; Ramey & Ramey,
1995; Schwert, 1989a, 1989b, 1990).
 Theories offer ambiguous evidence for the direction of credit access’s effect on firm volatility
(e.g., Aghion et al., 2010; Bacchetta & Caminal, 2000; Holmstrom & Tirole, 1997). On the one
hand, theoretical models imply that access to credit reduces volatility because it helps firms to
obtain the working capital necessary to finance their operations and investment opportunities
during short-run adverse shocks, including economic downturns or natural hazards, that would
otherwise trigger inefficient and risk-augmenting fluctuations in output and employment (e.g.,
Caballero & Krishnamurty, 2001; Larrain, 2006; Morgan, Rime, & Strahan, 2004; Wang, Wen, &
Xu, 2018). Related to this, Morgan, Rime and Strahan (2004) find that the increased mobility of
bank capital due to interstate banking deregulation dampens state-level fluctuations in economic
growth. Furthermore, access to finance helps firms alleviate the predation risks, the risks of losing
investment opportunities and market share to rivals caused by an inability to fully finance and
invest in these opportunities (Bolton and Scharfstein, 1990; Froot, Scharfstein, & Stein, 1993). As
a consequence, access to finance helps reduce the fluctuation of firms’ real outputs caused by
the predatory behaviors of their rivals. In essence, if the credit provision helps make the firms
more resilient to economic cycles, predation risks and natural hazards, it helps dampen the
output volatility of firms.
 On the other hand, theory also suggests that capital access could actually increase firm

1
 Using industry-level data, Larrain (2006) finds that countries with higher private credit to GDP ratios have lower
volatility in industrial output. In addition, Raddatz (2006) uses a similar cross-country, cross-industry approach,
finding that the volatility-reducing effect of banking development results partly from the role of the financial system
in providing liquidity.
 1
volatility by increasing the typical firm’s leverage or leading it to riskier investments, thereby
making it more vulnerable to adverse shocks (e.g., Acemoglu, 2005; Bartram, Brown, & Stulz,
2012; Carvalho, 2018; Levchenko et al., 2009). In a recent study, Carvalho (2018) find that fewer
financing constraints lead to higher equity volatility, especially among R&D-intensive firms.
Additionally, Beck et al. (2006) find no robust relationship between financial intermediation and
output volatility, while Acemoglu et al. (2003) find that financial concerns do not affect volatility
after controlling for institutions.
 We study the effect of FinTech credit on firm volatility in micro, small, and medium-sized
enterprises (MSMEs). Most of the extant literature of firm volatility focuses on much larger public
firms and looks at stock volatility, yet less has been done on MSMEs (e.g., Bartram et al., 2012;
Carvalho, 2018). MSMEs contribute significantly to world economic development2 but are also
faced with a huge finance gap. As the International Finance Corporation (IFC) estimated in 2017,
about 40% of MSMEs are financially constrained, with the total finance gap amounting to $5.2
trillion.3 Therefore, to study the effect of credit access on these firms is of significant value (Berger
et al., 1998, 2015; Black & Strahan, 2002; Petersen & Rajan, 2002). Moreover, by exploiting weekly
high-frequency real-time transaction data of the MSMEs in our sample, we can look at the real
effects of FinTech credit on real outcome measures of volatility.4 The availability of such high-
frequency data to measure the volatility of millions of MSMEs makes itself a contribution to the
firm volatility and risk literature.
 Using China as a laboratory to study the effect of FinTech credit lending is particularly
interesting given that China’s informal financing channels have been identified as the most
important part of the financial system in supporting the growth of the overall economy, now the
second largest in the world (e.g., Allen, Qian, & Gu, 2017; Allen, Qian, & Qian, 2005; Song & Xiong,

2
 According to the United Nations’ 2017 estimation, MSMEs account for more than 95% of the world’s companies
and create about 60% of jobs in private sectors. In China, MSMEs contribute 60% of GDP, 70% of the innovations and
80% of the employment.
3
 See “MSME Finance Gap: Assessment of the Shortfalls and Opportunities in Financing Micro, Small and Medium
Enterprises in Emerging Markets”, International Finance Corporation, 2017.
4
 High-frequency real-time data is crucial for our research to more accurately measure volatility
 2
2018). China is also the largest e-commerce market in the world by value of sales, with an
estimated value of US$ 1.1 trillion in 20185. Built on the significant development in the internet
and mobile network coverage, FinTech has played a fundamentally important role in facilitating
credit allocation to MSMEs by compiling and analyzing their e-commerce transactional data and
other digital footprints (Barberis & Arner, 2016). In this paper, we use credit data from Ant
Financial, the largest FinTech company in the world serving MSMEs, 6 and Taobao, the largest
online retail platform in the world to explore how finance accessibility affects the output volatility
of MSMEs.
 Compared to traditional banking, FinTech lending has apparent advantages in information
acquisition, loan processing, and decision making, by replacing soft information completely with
hard information and substituting numerical data and automated decisions for decisions made
by human individuals (e.g., Buchak et al., 2017; Liberti & Petersen, 2019). In our setting, Ant
Financial has access to a vast amount of data on their borrowers, including real time high-
frequency e-commerce transaction data and online financial and behavioral data. The use of
technology and big data makes information collection and loan decisions much less costly and
much more effective. Along this line, one might expect the role of FinTech to be more significant
for firms that are more opaque. Moreover, FinTech lenders are more efficient and effective in
loan monitoring and debt enforcement (e.g., Buchak et al., 2017; Fuster et al., 2018). FinTech
lenders can monitor the borrowers using real-time data based on multi-dimensional metrics, and
the enforcement strategies are based on highly algorithmized models. 7 These unique
characteristics enable us to conduct further channel tests by exploring firm-level heterogeneity
in information asymmetry and region-level difference in contract enforcement to better
understand the role of FinTech credit in overcoming information and debt enforcement problems.
 Our paper distinguishes from the previous literature in the following aspects. First, we focus
on the real effect of FinTech credit on MSMEs, which is largely understudied in the literature.

5
 See https://www.thedrum.com/news/2018/08/20/china-e-commerce-market-forecast-reach-18tn-2022.
6
 See “The Fintech100 – Announcing the World’s Leading FinTech Innovators for 2017”, KPMG, November 15, 2017.
7
 We will discuss more about these institutional details in Section 2.1.
 3
Second, we look at the effect of small business lending on real outcome volatility. The real
outcome volatility is particularly important as it pertains to firms’ operations (e.g., Comin &
Mulani, 2006; John, Litov, & Yeung, 2008; Larrain, 2006; Morgan, Rime, & Strahan, 2004; Raddtz,
2006), and is free from misvaluation by the equity market.8 Specifically, we look at sales growth
volatility from high-frequency transaction data. Third, the majority of MSMEs in our sample are
very small in scale, have opaque income sources, very limited collateral, no financial statements,
or may not even be formally registered. They do not fit into the traditional lending model of banks
under stringent capital regulation and are also unable to raise capital from the public market.
Moreover, the interest rates from other small-loan platforms are much higher because they do
not have the e-commerce transactional data of these firms. In this regard, the FinTech credit from
Ant Financial used in our sample is arguably the single source of credit for these MSMEs.
Therefore, the sample in our study provides a clean setting to evaluate the effect of credit access
on firm volatility without the potential confounding concerns from equity market, bond market,
bank loan market, or other financial markets. Fourth, we further examine countercyclical patterns,
predation risk, information asymmetry, and partial substitute for institutional quality as
underlying channels, through which FinTech credit affects firm volatility. Finally, we also look at
the effect on firm’s exit probability.
 To successfully identify the causal effect of credit access on firm volatility is empirically
challenging because credit access is likely endogenous. The first source of endogeneity is reverse
causality: firms with more unstable output in general will be less likely to obtain credit from
lenders and have lower leverage (e.g., Frank & Goyal, 2009). Recently D’Acunto, Liu, Pflueger, &
Weber (2018) study price flexibility and find that firm volatility predicated by price adjustment
frequency is negatively associated with the use of bank credit in terms of financial leverage.
Furthermore, unobserved firm heterogeneity might be correlated with both credit access and
firm volatility, which might further bias the results. To tackle this challenge, we must ensure some
randomness in firms’ access to credit. To this end, we gather proprietary online banking data on

8
 As we analyze below, the FinTech credit is probably the single source of credit for the firms in our sample.
 4
credit scoring and credit allocation from Ant Financial of Alibaba, the largest FinTech firm in the
world serving MSMEs. Ant Financial has developed a proprietary credit scoring system to
automate the grant of credit lines based on a cutoff score. This unique feature allows us to use a
regression discontinuity design (RDD) to identify the causal effect of access to external finance on
firm volatility.
 Ant Financial Services Group, a provider of online banking and other financial services, is the
world’s largest FinTech company after spinning off from its parent company, Chinese Alibaba
Group, in 2013. By March 2018, Ant Financial had a valuation of $150 billion.9 It runs China’s first
and largest consumer credit scoring system, Zhima Credit and a separate comprehensive credit
scoring system for MSMEs, including millions of online merchants on the Alibaba Group’s e-
commerce platform such as Taobao. The credit score for MSMEs is similar to the FICO score used
by many large banks in the U.S. (e.g., Keys et al., 2010). The credit score is generated solely for
internal evaluations of credit risk. It is calculated from vast amounts of big data, especially
information on the multiple dimensions of a firm’s characteristics, reflecting a certain default
probability.10 The score is not disclosed to the firm. Our analysis is built on the RDD approach,
exploiting Ant Financial’s credit allocation process, which is driven primarily by this credit score.
The score is continuous, ranging from 380 to 680. Throughout our sample period, Ant Financial
adopted a fuzzy allocation decision rule and set a cutoff score (480) for credit allocation, which
was used in tandem with other criteria to reflect firms’ aggregate risk profile.11 The choice of this
480 cutoff was based on a Value-at-Risk (VaR) model, where a cumulative default probability was
adopted. As a consequence, whenever firms receive a score higher than 480, they automatically
have a significantly higher probability of obtaining access to the credit line than those scoring

9
 See “China's Ant Financial Raises $10 Billion at $150 Billion Valuation,” https://www.reuters.com/article/us-ant-
financial-fundraising/chinas-ant-financial-raises-10-billion-at-150-billion-valuation-sources-idUSKCN1IU0EZ.
10
 The top five dimensions distilled from countless online activities include sales related activities (gross merchandise
volume and conversion rate), previous loan payment history, sales authenticity/illegal sales, logistical service quality,
and customer ratings.
11
 In addition to credit scoring, Ant Financial also imposes a few additional criteria on credit eligibility, including firm
age, sales information, previous misconduct record, etc. For instance, if a firm has been in business for less than three
months, has had no sales in the past three months, or has been punished for misconduct (e.g., breaching intellectual
property rights), then it will not be granted a credit line.
 5
below. Put in another way, firms that score above 480 have greater access to credit from Ant
Financial, while those firms that fall below 480 do not have such access.
 This unique feature is well suited to the RDD method. We rely on “locally” exogenous variation
in credit access based on firms that either succeed or fail to gain access to the credit line by only
a small margin of credit scores. This is a powerful and appealing identification strategy because
for such close-call cases, having credit access is very close to an independent, random event, and
is therefore unlikely to be correlated with firm unobservable characteristics—assuming that the
firms do not have precise control over their credit scores (Lee & Lemieux, 2010). This no-precise-
manipulation condition is easily met for the following two reasons. First, as the credit score is not
revealed to merchants on Taobao, they know neither their credit score nor the specific credit
allocation rule. Second, Taobao operates separately from Ant Financial, and the platform would
be unable to influence credit allocation decisions. As a result, we can use the locally randomized
process to generate causal inferences for the effect of credit access on firm volatility.
 Another advantage of the Alibaba data is that the company collects weekly real-time data on
trillions of transactions for all firms operating in the Taobao Marketplace, the major retail
platform of Alibaba for micro- and small businesses. Furthermore, through its FinTech affiliate,
Ant Financial, Alibaba links online merchants’ transaction records to credit allocation information
and other financial activities using unique IDs. We merge the credit allocation data from Ant
Financial to the real-time transaction data along with other firm-level parameters. As credit scores
in the system are updated usually on a monthly basis, we conduct our empirical analysis at
monthly frequency as well. Consequently, a firm can be treated repeatedly by credit grants, which
are readily available for usage upon application, and each grant event represents an independent
and exogenous shock to the firm’s credit access. After merging, the largest valid sample consists
of 8,848,251 firm-month observations from more than 1.9 million unique active merchants on
Taobao Marketplace from November 2014 to June 2015. 12 In our main empirical analysis, we
focus on firms around the 480 score cutoff to investigate credit access’s effect on firm volatility.

12
 As Ant Financial updated the construction of its credit scores and the credit allocation rules after June 2015, the
credit scores in our sample are no longer used to grant credit lines.
 6
We also provide diagnostic tests to verify that firms located above or below the cutoff by small
bandwidths are truly in line with local randomization.
 In our baseline RDD tests, we concentrate on the range of [460, 500], i.e., ±20 from the cutoff
(a bandwidth of 20).13 We obtain the credit score information for each firm in each month and
classify the firms into a treated or control group based on the credit allocation information from
the end of the current month. We are interested in the firms’ sales volatility levels in the three
months following a credit allocation event (i.e., t+1, t+2, and t+3, respectively). Treated firms
therefore are defined as those that are granted a credit line by the end of the current month and
the credit access remains valid throughout the next three months. 14 Control firms are those
without credit access in the same month. We then focus on our measures of firm volatility at the
end of the next one, two, and three months to attribute differences in firm volatility to differences
in credit access. As the credit allocation is largely driven by random variation in credit scores
around the 480 cutoff, and given that credit scores predict firms’ access to credit, we implement
a fuzzy RDD analysis using Two-Stage Least Squares (TSLS) to study the causal effect of credit
access on firm volatility (Hahn et al., 2001; Lee & Lemieux, 2010).
 We first examine the causal effect of credit access on firm volatility, as captured by two
measures of monthly sales growth volatility that exploit weekly real-time transaction data: one
based on sales value and the other on sales quantity. We find that firms granted access to credit
lines have significantly lower firm volatility. More specifically, firms with credit access have a
decrease in sales value growth volatility of 0.0423, 0.0607, and 0.0547, respectively, at t+1, t+2,
and t+3 compared to firms without credit access. The economic magnitude is also large,
accounting for 11%, 16%, and 14% of the sample mean, respectively.
 We further conduct two placebo tests. First, we use alternative cutoffs (460 or 500) as the
respective cutoffs to assign credit. We conduct the same fuzzy RDD tests and find no significant
effect of credit access using these “falsified” cutoffs. Second, we look at a small subsample of
firms located in cities with no credit granted in the sample period. These cities are mostly located

13
 We try alternative bandwidths as well, 15 and 10, as detailed in Section 5.5.
14
 We try our analysis without this 3-month constraint, and our results are qualitatively similar.
 7
in remote regions inhabited by ethnic minority groups that are challenging for debt collection due
to their remoteness and cultural differences. This subsample provides another ideal setting for a
placebo test, as the reasons of no credit granted are orthogonal to firms’ sales volatility. As
expected, we find no significant effect of credit access using this subsample of firms. We also try
alternative bandwidths in RDD and the results further confirm our baseline findings.
 We then explore the potential channels through which FinTech lending affects firm volatility
along several theoretically motivated dimensions. We examine the first possible channel by
studying whether the effect of FinTech credit exhibits any countercyclical patterns in reducing
firm volatility. When monetary policies are tightened, firms are subject to more underinvestment
risks and short-run adverse liquidity shocks. Therefore, in these occasions, the effect of FinTech
credit accessibility is expected to be more profound in reducing inefficient and risk-augmenting
fluctuations in outputs. As expected, we indeed find a strong countercyclical effect of FinTech
credit. More precisely, we use the monthly growth rates of M2 money supply and Shanghai
Interbank Offered Rate (SHIBOR), and find that FinTech credit has significantly larger negative
effects on firm volatility when monetary conditions are tightened. The result is consistent with
Larrain (2006), who finds that reduction in aggregate volatility is accompanied by increased
countercyclical effect of financial development. Furthermore, the countercyclical effect is
strengthened by the additional cross-sectional evidence that the negative effect of FinTech credit
on volatility is more pronounced in cities and periods with lower GDP growth. Overall, the
countercyclical effect is consistent with the role of FinTech in overcoming credit constraints of
MSMEs.
 Second, we turn to the predation risk and industry competition channel. As pointed out by
Froot, Scharfstein, and Stein (1993), a firm’s exposure to predation risk largely depends on the
interdependence of its investment opportunities with product market competitors. The greater
the interdependence, the greater predation risk would be. Therefore, if credit access helps reduce
firm volatility, then the effect should be greater in more competitive industries where a firm
shares a larger proportion of its growth opportunities with competitors. Our subsample analysis

 8
based on product market competition confirms such an expectation.
 Next, we look at the legal environment and contract enforcement channel. In the areas with
poor legal protection and contract enforcement, banks and other credit providers are less willing
to lend to MSMEs as they face more challenges and higher costs in enforcing debt contracts
(Djankov et al., 2008; Haselmann et al., 2010). With the new technology in both monitoring and
debt enforcement, FinTech lending could remedy such poor legal environment and contract
enforcement. First, FinTech lending could monitor the borrowers using real-time and high
frequency data. Second, FinTech lender can adopt sanctions and direct enforcement, including
cutting off all the online services, withholding the online payments and using them for debt
repayment, and may even deduct balance from borrowers’ digital wallets. Also FinTech lenders
could “track” the borrowers’ locations through daily online consumption data, find their related
parties, and use other various ways to contact them. We find the negative effect of credit access
on firm volatility is driven by the lower legal environment and contract enforcement subsample,
which contributes to a better understanding of the role of FinTech in overcoming weaker
institutional environment and providing liquidity to MSMEs in those regions.
 Furthermore, we study the information asymmetry channel. Compared to traditional banking,
the use of technology and big data in FinTech lending makes lender’s information collection much
less costly and much more effective. In line with this advantage, one might expect the effect of
FinTech credit to be stronger in firms with higher level of information asymmetry. To test this
conjecture, we focus on firm age since young firms have a much shorter history for traditional
lenders to effectively evaluate their credit risk. As expected, we find that the effect of FinTech
credit in reducing volatility is more pronounced younger firms. Overall, our channel tests
including cyclicality, predation risk, legal environment, and firm age all strengthen our
understanding on how FinTech credit affects firm volatility.
 Moreover, to better understand the impact of FinTech credit on firm risk, we also look at firm
exit probability in the future. We find that FinTech credit access significantly reduces the
likelihood a firm’s bankruptcy or exit of the business. In addition, we conduct further robustness

 9
checks and find that our results are robust when additional firm-level and owner-level controls
and city-fixed effects are included and when we use alternative RDD functional forms and higher-
order polynomials.
 This paper contributes to the following strands of literature. First, it contributes to research
on the determinants of firm volatility (Acharya et al., 2011; Boubakri et al., 2013; John, Litov, &
Yeung, 2008; Hayes et al., 2012; Kini & Williams, 2012; Low, 2009). We contribute by studying the
effect of access to FinTech credit on firm real output volatility in MSMEs as the majority of the
literature focus on much larger public firms and stock volatility.15 Moreover, the availability of
high-frequency real-time weekly transaction data for millions of MSMEs helps us to more
accurately measure firm volatility. In addition, considering the growth of new credit lines, we
evaluate the role of FinTech credit rather than traditional formal financing channels. Since FinTech
lenders have advantage in information acquisition and processing, the gains in alleviating
information asymmetry is greater for MSMEs.
 Second, our paper is related to the literature on informal lending and microcredit (e.g.,
Banerjee et al., 1994; Madestam, 2014; Rai & Sjöström, 2004). We find that FinTech credit plays
a significant role in assisting MSMEs in reducing volatility, and that the effect is strongly
countercyclical. We also contribute to the emerging literature on FinTech (e.g., Agarwal, Qian,
Yeung, & Zou, 2019; Cheng & Qian, 2018; D’Acunto, Prabhala, & Rossi, 2018; D'Acunto, Rossi, &
Weber, 2019; Easley et al., 2018; Sockin & Xiong, 2018).
 Third, this study contributes to the literature on finance and the economic growth-volatility
nexus initiated by King and Levine (1993) (e.g., Aghion et al., 2005; Bekaert, Harvey, & Lundblad,
2005, 2006; Claessens & Laeven, 2003; He & Tian, 2018; Hsu et al., 2014; Laeven & Levine, 2009;
Levine, 1997, 2005; Rajan & Zingales, 1998), and particularly the literature on financing for small
businesses (e.g., Berger et al., 1998, 2015; Chen, Hanson, & Stein, 2017; Petersen & Rajan, 2002)
and entrepreneurs (e.g., Agarwal, Qian, Yeung, & Zou, 2018; Black & Strahan, 2002; Chen, Miao,

15
 Also, the literature has inconclusive findings. Morgan et al. (2004) found that access to bank capital due to
interstate banking deregulation decreases state-level fluctuations in economic growth. Carvalho (2018) found that
fewer financing constraints lead to higher equity volatility. In addition, Acemoglu et al. (2003) and Beck et al. (2006)
found no robust relationship between financial intermediation and output volatility.
 10
& Wang, 2010; Wang, Wang, & Yang, 2012). In related papers, Hau et al. (2019a, 2019b) study
the segmentation of credit market and the take-up decision of FinTech credit and entrepreneurial
growth in Chinese small businesses. We differ widely from Hau et al. (2019a, 2019b), as we are
looking at a different research question as well as relying on data at significantly higher frequency
and all of our results are based on RDD estimation by exploiting “locally” exogenous variations in
credit access. Whereas research on financial development and economic volatility (Larrain, 2006;
Raddatz; 2006) has tended to focus primarily on industry-level cross-sectional analysis, this study
contributes by looking at high-frequency firm-level volatility using RDD analysis, thereby
providing direct and causal evidence of the effect that access to finance has on firm volatility.
 The rest of the paper is organized as follows. Section 2 presents the institutional background
and describes the platform Ant Financial. Section 3 describes the data, variable construction, and
summary statistics. Section 4 presents our identification strategy and empirical design. Section 5
shows the analysis of the effect of credit access on firm volatility, and Section 6 explores the
underlying channels through which FinTech credit affects firm volatility. Section 7 presents
additional robustness tests and Section 8 concludes.

2. Institutional Background and the Platform
 As the world's largest online retailer and one of the world’s largest internet companies, 16
Alibaba enables third-party sellers in China to take their own businesses to the web. Alibaba
estimated its China retail marketplaces Taobao and Tmall.com have “contributed to the creation
of over 15 million job opportunities with more than 10 million active sellers as of 2015”.17 This
enables Alibaba to access the vast big data collected from 300 million registered shoppers and 20
million vendors using Alibaba.
2.1. FinTech Microcredit

16
 As of October 2014, Alibaba surpassed Walmart as the world's largest retailer. See “Alibaba is Now the Biggest
Retailer in the World,” The Telegraph, October 28, 2014.
17
 See “Alibaba Affiliate Ant Financial Raises $4.5 Billion in Largest Private Tech Funding Round”, Wall Street Journal,
April 25, 2016; “Alibaba Job Boom: Jack Ma Chats with Trump about How to Create 1 Million US Jobs over 5 Years”,
CNBC, 9 Jan, 2017.
 11
Microcredit refers to the extension of very small loans (microloans) without collateral to
impoverished borrowers who are typically excluded by the formal financial sector (Morduch,
1999). With the development of financial technology, new forms of microfinancing have emerged
and developed rapidly, such as e-commerce lending, peer-to-peer (P2P) lending, crowdfunding,
and etc.
 One clear feature of FinTech e-commerce credit that distinguishes it from traditional banking
and P2P financing or crowdfunding is information acquisition. E-commerce credit lenders have
access to a vast amount of data on their clients, i.e., e-commerce transaction data and online
financial and behavioral data, which include anonymized records of credit card payments, online
shopping payments, fund transfers, wealth management, utility payments, house rental
information, relocation records, and social relationships. This information helps mitigate the key
challenges in traditional banking—adverse selection and moral hazard problems due to
information asymmetries (Stiglitz & Weiss, 1981). The use of technology and big data make
lender’s information collection much less costly and much more effective, compared to
traditional forms of lending.
 Another important feature of the FinTech e-commerce credit different from traditional
lending is information processing and decision making, as it depends on substituting numerical
data and automated decisions based on hard information for decisions made by individuals (e.g.,
Buchak et al., 2017; Liberti & Petersen, 2019). By replacing soft information by hard information,
the advantages are apparent in that the loan processing is faster, less expensive, and more
effective due to automation (e.g., Fuster et al., 2018; Liberti & Petersen, 2019).
 Moreover, FinTech lending is more efficient and effective in both post-loan monitoring and
debt enforcement. Traditional bank monitoring relies on public disclosure, information
acquisition of firms’ financial activities and covenants design, and FinTech lending can utilize real-
time data based on multi-dimensional metrics of the borrowers.18 Lenders can more accurately

18
 For instance, Ant Financial relies on real-time data for post-lending monitoring. It generates a post-lending score
based on metrics of Taobao merchants, such as the conversion rate of orders, to assess whether the borrower is
likely to have credit deterioration in the following 3-6 months. Depending on the degree of the deterioration, alarms
at different levels will be issued and different actions will be triggered automatically according to the pre-defined
 12
compare submitted financials to databases and thus prevent fraud and default (e.g., Buchak et
al., 2017; Fuster et al., 2018). In terms of credit contract enforcement, the traditional banking
model relies more on court enforcement. The enforcement procedures/strategies of FinTech
firms, however, are based on real-time models and they are highly algorithmized.19 In the very
first place, it is not as easy for borrowers of FinTech credit to default and disappear compared to
borrowers of traditional bank credit, because FinTech companies can “track” their locations
(based on daily consumption records), identify their related parties, and use other various ways
to contact them. This is something that is difficult for traditional banks to do. There are also
implicit threats to FinTech borrowers if they fail to repay the debt because the FinTech lender
could adopt sanctions and direct enforcement. For example, it could cut off all the services on
the platform, use the payments for goods for debt repayment directly, withhold the payments to
the related merchants or activities of the borrowers, and may even deduct balance from their
digital wallets.20
2.2. Ant Financial of Alibaba
 As for the 20 million participating vendor businesses operating on the Alibaba platform, nearly
90% are small microenterprises with difficulty accessing finance to fuel their growth. Ant
Financial’s MYbank, and its predecessor “Alibaba Micro Loan,” has for years leveraged a Big Data
model to loan offers. MYbank has built its own small business credit scoring system using big data

algorithms. Specifically, for a lower alarm level, the borrowers may be put into watch list; for a medium level, Ant
Financial may ask the borrowers to provide more information to support and enhance its credibility, such as bank
statements and information on other lending from banks; for a high alarm level and severe cases, the credit
withdrawn will be frozen immediately and Ant Financial will send members of the contract enforcement team to
follow up, and may even seek for legal help. To initiate any of these actions above, it only takes several hours to 2
days from the triggering of an alarm, which is much faster than traditional banks. In addition, all the undrawn credit
line will become forfeited automatically.
19
 For example, Ant Financial will classify its overdue debt portfolios into several categories, M1, M2, M3, containing
the contracts where borrowers have overdue debt for more than 30 days, 60 days and half year respectively. There
will be different enforcement methods applied to each category. That is, Ant’s algorithm will optimize the solution
given the category and the amount due on a daily basis. Moreover, the algorithm will update the strategies when
triggered by different responses from the borrowers.
20
 In the case of Ant Financial, borrowers who default will also risk being not able to use the China’s largest e-
commerce platform Taobao and the China’s largest mobile and online payment platform Alipay, receiving lower score
in Zhima Credit, the China’s first and largest consumer credit scoring system, and having reputation tarnished in social
network in addition to court enforcement.
 13
to understand client behaviors and characteristics and offer responsive financial services,
overturning traditional banking models and leveraging the group’s cloud computing services to
keep response time to customers short and operational costs low. Based on this credit scoring
system, Ant Financial developed a “3-1-0” model of online lending—that is, a service standard
characterized by a 3-minute application process, 1-second loan granting, and zero manual
intervention.21
 As of August 2016, Ant Financial had provided a total of over RMB 700 billion (about $102
billion)22 in loans to over four million small and micro-sized enterprises and entrepreneurs over
the previous five years,23 helping tackle capital shortages and allowing the businesses survive and
grow. The average loan is about 20,000 RMB (about $3,000), and the average rate of non-
performing loans is below 3%. Without these loans, small and micro-sized businesses would be
left out in the cold and thus credit-starved by China’s banking system, which oftentimes favors
bigger firms and state-owned enterprises.
 Built on the vast scale of big data gleaned from Alibaba’s various platforms, Ant Financial has
developed an automated credit allocation system. The system is characterized by a proprietary
credit scoring model that exploits multiple dimensions of firm characteristics to reflect default
probability from its trillions of online activities, including sales related activities, previous loan
payment history, sales authenticity/illegal sales, logistical service quality, and customer ratings.
The credit scoring is continuous, with scores ranging from 380 to 680, and is updated monthly.
The fuzzy rule that Ant Financial adopts in allocating credit, under which firms with scores higher
than 480 are more likely to get credit, allows us to use fuzzy RDD to study the causal effect of
credit access.

3. Data, Sample, and Variable Construction
 In this section, we describe the data, variable construction, and summary statistics for our

21
 See Ant Financial’s website: https://www.antfin.com/.
22
 We use the exchange rate on 22 Aug, 2018 for conversion: 1RMB/USD=0.15.
23
 This is about five times of the total volume provided by the Grameen Bank in 39 years.
 14
analysis.
3.1. Sample Construction
 Our major data come from two sources. The proprietary credit line-level data come from Ant
Financial, the financial platform of Alibaba. The information includes discretionary credit scores,
access to credit lines, actual usage of credit, etc. The real-time transaction records, along with
basic firm-level information about the merchants (e.g., industry, location, firm age, and
information about the firm owner), come from Taobao Marketplace, Alibaba’s e-commerce
platform. The two parts are merged at the firm level using unique merchant IDs.
 Our sample collection began by examining all vendors on Alibaba from November, 2014 to
June, 2015, after which Ant Financial updated its credit score model and credit allocation rules.
Requiring information in measures of firm volatility and other major variables, our full sample
included 8,848,251 firm-month observations, associated with 1,898,180 unique firms. We
narrowed the sample by focusing on active merchants with a bandwidth of 20 from the credit
score cutoff of 480 (i.e., [460, 500] sample) and group them into treated and control groups based
on Ant Financial’s credit allocation decisions. Treated firms are defined as those that were granted
a credit line by the end of the current month and whose credit access remained valid throughout
the following three months. Control firms are defined as those without credit access in the same
month. As for this [460, 500] sample, we have 561,313 firm-month observations, associated with
274,690 unique firms.
3.2. Measuring Firm Volatility
 We capture our main dependent variable of firm volatility using two measures of monthly
sales growth volatility (SalesGrVol) drawn from weekly real-time transaction data: one based on
sales value (Sales value growth vol), the other on sales quantity (Sales quantity growth vol).
Specifically, Sales value growth vol is the monthly standard deviation of the weekly growth rate
for the total transaction amount in RMB, calculated for the next one, two, and three months for
each firm in the sample, and Sales quantity growth vol is the monthly standard deviation of
weekly growth rate of the total transaction quantity calculated for the next one, two, and three
months for each firm in the sample. The summary statistics of our major variables are presented
 15
in Table 1. As shown in Panel A of Table 1, Sales value growth vol (Sales value growth vol) has an
average value of 0.44 (0.40) with large variations, as indicated by a standard deviation of 0.25
(0.26) in the full sample.
 [Table 1 about here]
3.3. Independent Variables
 The independent variables in our analysis can be categorized into three groups. The first group
relates to a firm’s credit status. The key independent variable is Credit access (D), which is based
on actual credit access. This is equal to 1 if a firm in the current month is granted a credit line
from the end of month t to the end of month t+3. We denote Credit access as D in abbreviation.
As shown in Panel B of Table 1, Credit access has a mean value of 0.716, indicating that 71.6% of
the firm-month observations had credit access in the [460, 500] sample. Credit score (Credit score)
is defined as the score generated by Ant Financial’s credit-scoring model by exploiting big data for
firm i in month t. In the [460, 500] sample, we find that Credit score has a mean value of 486.257
with a median of 479.073. We further define an indicator variable based on the credit score, T
[Credit score≥480], which is equal to 1 if Credit score is greater than 480, and 0 otherwise. We
also capture the amount of the credit line granted for the firm by Credit amount. As shown in
Table 1, the average credit amount is 20,536 RMB (about 3,000 USD) for the [460, 500] sample.

 The second group of independent variables include a battery of control variables to measure
firm-level characteristics. Specifically, Sales value is the total transaction amount in RMB
completed by a firm i in month t. Firm age refers to the firm’s age, as measured by the total
number of months the firm was present on the Taobao Marketplace in the interim since the firm’s
date of registration on the site. Owner gender is an indicator variable that equals 1 if the firm
owner is male and 0 if female. Owner married is an indicator variable that equals 1 if the firm
owner is married and 0 otherwise. Owner income is the firm owner’s estimated monthly income
earned from other sources. Owner property is an indicator variable that equals 1 if the firm owner
owns real estate assets and 0 otherwise. We also include several variables to measure the owner’s
education. Owner Associate, Owner undergraduate, and Owner postgraduate are indicators that
equal 1 if the highest degree the owner obtains is an Associate’s, Bachelor’s, or Master’s degree,

 16
respectively, and 0 otherwise. As shown in Panel B of Table 1, an average firm in our sample had
a monthly sales value of 39,504 RMB (about 5,775 USD) and was 26 months old. The average firm
size was in line with the scale of credit lines, confirming that Ant Financial mainly serves MSMEs.
About 54.8% of firm owners were male and 63.6% were married.
 The last group of independent variables includes the firms’ regional-, industry-, and economy-
level characteristics, which are used to analyze the potential channels in Section 6. For example,
we use HHI at the industry level to measure market competition. NDisaster is an indicator variable
set to 1 if a firm is located in a city that experienced a severe natural disaster in the most recent
two months, and 0 otherwise. Appendix A provides a detailed description of our variable
definitions.

4. Methodologies and Empirical Design
 In this section, we introduce the identification strategy, describe the empirical design, and
conduct diagnostic tests.
4.1. RDD Specification
 Our main empirical design is based on RDD which is structured around the discontinuity of
Ant Financial’s credit allocation decisions. As discussed above, Ant Financial is more likely to grant
credit lines to firms when their credit scores are higher than 480, which creates a “locally”
exogenous variation in credit access generated by firms that succeed or fail to gain access to credit
by a small margin in the score distribution. In this regard, variation in credit access can be
regarded “as good as random” under the assumption that the credit score cannot be precisely
manipulated around the threshold (Imbens & Lemieux, 2008; Lee & Lemieux, 2010). This unique
feature allows us to make causal inferences about the effect of credit access on firm volatility with
RDD. We provide further diagnostic tests in Section 4.2.
 We present the probability of credit access against credit scores in Figure 1. As shown in Figure
1, a firm with a credit score above 480 has a significantly higher probability of receiving a line of
credit from Ant Financial. Specifically, the probability jumps by about 30% at the cutoff of 480,
which creates a clear discontinuity. However, the probability rates also indicate that passing the
 17
threshold does not perfectly determine credit allocation decisions. Therefore, we cannot simply
compare outcome variables on each side of the cutoff to estimate the treatment effect. Instead
of a sharp RDD, we implement an RDD strategy using the difference in the expected outcome
variables and the change in the likelihood of credit access around the cutoff to recover the
treatment effect (e.g., Imbens & Lemieux, 2008; Lee & Lemieux, 2010).
 [Figure 1 about here]
 Specifically, we use a Two-Stage Least Squares (TSLS) model under a standard instrumental
variable (IV) framework (Hahn et al., 2001) to estimate credit access’s treatment effect. In the first
step, we estimate the probability of credit access using the following model specification:

 , = + , + ∑ ∗ ∗
 =1 ( − ) + , ∑ =1 ( − ) + + + , (1)
where i denotes a shop, t denotes the month, sit denotes the credit score that shop i received at
the end of month t, and s* is the cutoff credit score (i.e., 480). D refers to Credit access, which is
a dummy variable that equals 1 if a firm has credit access from the end of the current month to
the end of the next month, and 0 otherwise. [ ≥ 480] is a dummy variable that
equals 1 if a firm’s credit score in the current month is greater than 480, and 0 otherwise. We

include polynomial functions of ( − ∗ ) up to an order of K. is the coefficient of the kth-

order standardized credit score ( − ∗ ) on the left side of the cutoff (when T=0), and +

is for the right side (when T=1). 24 We also included industry-fixed effects, , and time-fixed
effects, , to control for industry characteristics and contemporaneous confounding events.
 We use the estimates in equation (1) to predict the probability of credit access and denote it
 ̂ . Then in the second step, we regress our measures of firm volatility on
with ̂ following

equation (2), given below:
 ̂ + ∑ ∗ ∗
 , + = + =1 ( − ) + ∑ =1 ( − ) + + +

 , (2)
where the dependent variable is , captured by two measures of monthly sales growth

24
 The polynomials capture the underlying relationship between relevant firm characteristics and credit scores, and
help control for the influence of firms that are located away from the cutoff on the credit allocation decisions and
consequently firm volatility.
 18
volatility exploiting weekly real-time transaction data. Specifically, Sales value growth vol is the
monthly standard deviation of weekly growth rate for the total transaction amount in RMB,
calculated for the next one, two, and three months for each firm in the sample, and Sales quantity
growth vol is the monthly standard deviation of the weekly growth rate of the total transaction
quantity calculated for the next one, two, and three months for each firm in the sample. Other
variables are the same as defined in the first stage. Our major interest is the estimate of , the
 ̂ , which offers an estimate of the local average treatment effect of credit access
coefficient of
on our firm volatility measures.

 We face a tradeoff between precision and bias in choosing bandwidth and polynomial orders.
A larger bandwidth with higher order polynomials provides more precise estimations, as it uses
a larger pool of observations. However, it also introduces biases by using firm-month observations
farther away from the discontinuity. Meanwhile, a local linear regression with a narrow
bandwidth reduces the bias but might be limited in the number of observations used to obtain
precise results. In our main specification, we use a local linear regression (K=1) over a small range
of credit scores from 460 to 500 (i.e., a bandwidth of 20). We test for robustness using alternative
bandwidths in Section 5.5, higher order polynomials (K=2 and K=3), and alternative model
specifications in Section 7.2.
4.2. Diagnostic Tests for Setting Validity
 The RDD relies on “locally” exogenous variations in credit access generated by credit scores
above or below 480 by a small margin of points. A key identifying assumption of the RDD is that
agents (both firms and Ant Financial) cannot precisely manipulate the forcing variable (i.e., the
credit scores) near the cutoff (Lee & Lemieux, 2010). If this assumption is satisfied, then the
variation in access to credit lines is as good as that from a randomized experiment (e.g., Bradley
et al., 2017; Chemmanur & Tian, 2018; Imbens & Lemieux, 2008). As discussed above, Ant
Financial does not disclose the firms’ credit scores or the specific algorithms governing the credit
allocation decisions. Moreover, Ant Financial runs separately from Taobao Marketplace; as such,
Taobao cannot influence allocation decisions.
 Although it seems theoretically clear that the assumption is satisfied, we further perform two

 19
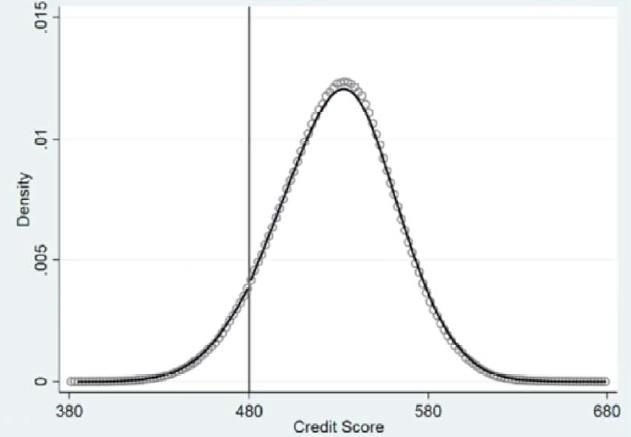
sets of diagnostic tests to provide empirical evidence. First, we study the density of firm
distribution around the cutoff 480. If there is systematic sorting of firms within close proximity of
the threshold, then this sorting would be observed by a discontinuity in the credit score
distribution at the 480 threshold. Specifically, we follow McCrary (2008) and provide a formal test
of discontinuity in the density. We draw a density of the sample distribution of credit scores in
equally-spaced credit score bins, as presented in Figure 2. The horizontal axis represents the firms’
credit scores over the full credit score range, from 380 to 680. The circles depict density estimates.
The solid line refers to the fitted density function of the forcing variable (the number of firms)
with a 95% confidence interval around the fitted line. The figure shows that the density appears
generally smooth and the estimated curve gives no indication of a discontinuity near the 480
threshold. The discontinuity estimate is 0.0059 with a standard error of 0.0045. Therefore, we
cannot reject the null hypothesis that the difference in density at the cutoff point is zero. Overall,
this suggests that our validating assumption—that there is no precise manipulation of credit
scores at the threshold—is not violated.
 [Figure 2 about here]
 Another important assumption of the RDD is that there should not be discontinuity in other
covariates correlated with firm volatility at the cutoff point. In other words, firms that have credit
access should not be systematically different ex ante from firms that do not have credit access.
We perform this diagnostic test by comparing the covariates of firms that fall in the narrowest
band of credit scores used in our analysis (i.e., [470, 490] around the threshold). Specifically, we
plot the pre-treatment measures of firm characteristics and firm volatility, as presented in Figure
3. Panel (1) focuses on Sales value one month prior to the treatment event and Panel (2) on Firm
age. In both figures, we do not find any jumps in firm characteristics before the exogenous change
in credit access. Panels (3) and (4) present the plot for our measures of firm volatility (Sales value
growth vol and Sales quantity growth vol) at t-1. We find no jumps in these two measures either.
 [Figure 3 about here]
 Overall, the diagnostic tests presented above suggest that there does not appear to be a
precise manipulation of credit scores within close proximity over the 480 threshold. Furthermore,
there is no discontinuity in other covariates at the cutoff point as well.

 20
5. Baseline RDD Results
 In this section, we present the baseline RDD results. We start with a graphical analysis to
visually check relationships around the cutoff and move to formal fuzzy RDD regressions for the
baseline results. We then provide two sets of placebo tests using alternative cutoff points and
examining cities where no credit was granted. We further conduct a robustness test by exploring
alternative bandwidths.
5.1. Graphical RDD Analysis
 We first present a set of discontinuity plots in Figure 4 as an intuitive way to illustrate the causal
effect of credit access on firm volatility. Given the fuzziness in the credit allocation decisions, this
approach is not precise; however, it does provide a preliminary approximation of credit access’s
treatment effect. We concentrate on the narrowest band used in our analysis (i.e., from 470 to
490). The left-hand figures (i.e., Panels (1), (3), and (5)) present plots for Sales value growth vol
and the right-hand plots (i.e., Panels (2), (4), and (6)) present plots for Sales quantity growth vol.
We study our measures of firm volatility at t+1, t+2, and t+3 subsequent to a credit allocation
decision at both sides of the cutoff. We divide the spectrum of credit scores into equally-spaced
bins (with a bin width of 1). For firms with a credit score lower than the cutoff, the average firm
volatility measures are denoted by blue dots, and the average value of firm volatility measures
for firms with a score above the threshold are denoted by red dots. The solid line represents the
fitted linear estimate with a 95% confidence interval around the fitted value.
 [Figure 4 about here]
 The figures show a strong discontinuity in both Sales value growth vol and Sales quantity
growth vol at the threshold in each of the three months after the credit allocation decision.
Specifically, within close proximity of the threshold, our measures of firm volatility drop
significantly once the credit scores move from the bin below 480 to the one above. This
observation points to a causal and negative effect of FinTech credit on firm volatility.

5.2. Fuzzy RDD Tests
 We now present our analysis using the fuzzy RDD. We follow the two-equation system in
Section 4.1 to perform the analysis. We focus on a bandwidth of 20 (i.e., the [460, 500] sample)
 21
You can also read