Uncovering serum placental related non coding RNAs as possible biomarkers of preeclampsia risk, onset and severity revealed MALAT 1, miR 363 and ...
←
→
Page content transcription
If your browser does not render page correctly, please read the page content below
www.nature.com/scientificreports
OPEN Uncovering serum
placental‑related non‑coding
RNAs as possible biomarkers
of preeclampsia risk, onset
and severity revealed MALAT‑1,
miR‑363 and miR‑17
Samy A. Abdelazim 1*, Olfat G. Shaker2, Yehya Aly Hussein Aly3 &
Mahmoud A. Senousy 1*
New predictors that could boost early detection of preeclampsia (PE) and prognosticate its severity
are urgently needed. We examined serum miR-17, miR-363, MALAT-1 and HOTAIR as potential
biomarkers of PE risk, onset and severity. This prospective study included 160 pregnant females; 82 PE
cases and 78 healthy pregnancies. Serum samples were collected between 20 to 40 weeks of gestation.
Early-onset PE was defined as developing clinical manifestations at ≤ 34 gestational weeks. Severe
PE was defined as systolic blood pressure ≥ 160 mmHg and/or diastolic blood pressure ≥ 110 mmHg
and proteinuria (≥ 2 g/24 h or ≥ 2+ dipstick). Selection of PE-related non-coding RNAs and functional
target gene analysis were conducted using bioinformatics analysis. Expression profiles were assessed
by RT-qPCR. Serum miR-363 and MALAT-1 were downregulated, meanwhile miR-17 was upregulated,
and HOTAIR was not significantly altered in PE compared with healthy pregnancies. miR-17 was
elevated while miR-363 and MALAT-1 were reduced in severe versus mild PE. miR-363 was lower in
early-onset versus late-onset PE. MALAT-1, miR-17 and miR-363 showed diagnostic potential and
discriminated severe PE, whereas miR-363 distinguished early-onset PE in the receiver-operating-
characteristic analysis. miR-363 and MALAT-1 were significantly associated with early and severe PE,
respectively in multivariate logistic analysis. In PE, miR-17 and MALAT-1 were significantly correlated
with gestational age (r = − 0.328 and r = 0.322, respectively) and albuminuria (r = 0.312, and r = − 0.35,
respectively). We constructed the MALAT-1, miR-363, and miR-17-related protein–protein interaction
networks linked to PE. Serum miR-17, miR-363 and MALAT-1 could have utility as new biomarkers of
PE diagnosis. miR-363 may be associated with early-onset PE and MALAT-1 downregulation correlates
with PE severity.
Preeclampsia (PE) is a multi-systemic pregnancy disorder that globally affects 2–10% of pregnancies, and cur-
rently is among the most common causes of maternal d eath1. PE mostly uncovers pre-existing endothelial
dysfunction, metabolic and vascular d iseases2, which necessitate long-term monitoring of women with prior
exposure to PE, preterm birth, or delivery of an infant small for gestational a ge3. Thus, new biomarkers of PE
risk, onset and severity are urgently needed.
The pathogenesis of PE includes inadequate trophoblastic invasion, developmental abnormalities of placental
vasculature and placental underperfusion, however the exact pathophysiological mechanism remains unknown4.
Thereby, recognizing the mechanistic insights underlying trophoblastic behavior and pathology in PE will clear
up new biomarkers for its diagnosis and prognosis as well as novel therapeutic targets.
1
Biochemistry Department, Faculty of Pharmacy, Cairo University, Cairo 11562, Egypt. 2Medical Biochemistry
and Molecular Biology Department, Faculty of Medicine, Cairo University, Cairo, Egypt. 3Pharmacist at Kasr
Al‑Ainy Hospital, Cairo University, Cairo, Egypt. *email: samy.mohamed@pharma.cu.edu.eg; mohmoud.ali@
pharma.cu.edu.eg
Scientific Reports | (2022) 12:1249 | https://doi.org/10.1038/s41598-022-05119-9 1
Vol.:(0123456789)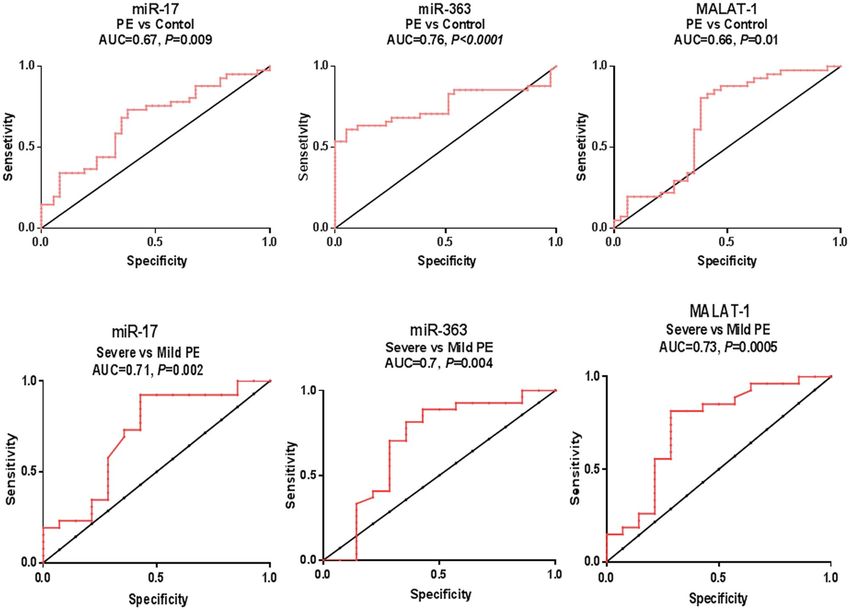
www.nature.com/scientificreports/
Non-coding RNAs (ncRNAs), including microRNAs (miRNAs; 18–22 nucleotides) and long ncRNAs (lncR-
NAs; > 200 nucleotides) are involved in several cellular paradigms in the placenta, including trophoblastic inva-
sion, cell proliferation and endothelial f unction5,6. lncRNAs also act as competing endogenous RNAs (ceRNAs)
for miRNAs, and this crosstalk was linked to PE p athology6. Deregulated miRNAs and lncRNAs are released
into the circulation from the defective placenta in PE and have come out as potential biomarkers for its early
screening and diagnosis and as novel targets for its prevention and treatment7–9.
Although several reports revealed the probable usefulness of measuring certain ncRNAs as circulating bio-
markers of P E7–9, a study by luque et al. concluded that measurement of maternal serum miRNA at the first-
trimester of pregnancy lacks any predictive value for early PE10. For this divergence, more investigations are
needed to shed light on the precise role of PE-related ncRNAs and their possible cross-interaction in predicting its
onset and severity. Accordingly, we have conducted a systematic bioinformatics approach to select PE-associated
lncRNAs and miRNAs, and then examined candidate lncRNAs-miRNAs predicted and reported interactions.
Herein, the lncRNAs metastasis associated lung adenocarcinoma transcript-1 (MALAT-1) and homeobox tran-
script antisense RNA (HOTAIR) as well as miR-17 and miR-363 were selected.
miR-17, a member of the miR-17-92 cluster, is a placental-specific miRNA which is largely located in various
subtypes of trophoblasts, regulating important trophoblastic cell events, including differentiation, angiogenesis
and apoptosis9. In particular, miR-17 regulates multiple steps during placental angiogenesis and its deregulation
causes placental developmental defects11. Another placental-related miRNA is miR-363, a member of miR-
106a-363 cluster, which is highly expressed during placental development in rapidly proliferating cytotrophoblasts
(CTB), the most metabolically active cells in the placenta. Members of miR-17-92 and miR-106a-363 clusters are
MYC-responsive targets, an important regulator of early placentation12, and were established to target several
genes that are involved in CTB proliferation, differentiation, angiogenesis and metabolic r eprogramming12.
The lncRNA MALAT-1 regulates trophoblast invasion during placental development; its knockdown impaired
trophoblast invasion and proliferation, suppressed the cell cycle progression and promoted apoptosis13. HOTAIR
lncRNA regulates proliferation, invasion and apoptosis of placental trophoblasts; its overexpression decreased
their invasive capacity and increased cell apoptosis14. However, the exact role of these ncRNAs, their crosstalk
and clinical relevance in PE are not fully elucidated.
Thereby, the present study investigated the circulating expression profiles of miR-17, miR-363, MALAT-1
and HOTAIR in sera of PE patients and normal pregnancies, and evaluated their potential value as biomarkers
of PE risk, onset and severity. We also explored the correlation between these ncRNAs and clinicopahological
data of PE patients. Target gene analysis was also conducted using online softwares and databases to function-
ally relate these ncRNAs to PE pathogenesis through constructing the target protein–protein interaction (PPI)
networks linked to PE.
Results
PE characteristics. Both PE patients and healthy pregnancies were comparable in terms of age, smoking
status, body mass index (BMI), parity, abortion, gravidity, fasting blood sugar, liver function tests, serum urea
and hematological parameters (P > 0.05). Patients with PE exhibited significantly higher systolic blood pressure
(SBP), diastolic blood pressure (DBP), mean arterial pressure (MAP), C-reactive protein (CRP) (P < 0.0001 for
each), serum creatinine and uric acid levels (P = 0.0003 for each). PE patients showed low amniotic fluid (oli-
gohydraminos), intrauterine growth restriction (IUGR), and abnormal Doppler (P < 0.0001 for each) more fre-
quently than the control group. Moreover, PE patients had lower gestational age (GA) (P = 0.045) and fetal birth
weight (FBW) (P < 0.0001), in addition to, more frequent caesarean delivery (P = 0.003) (Table 1).
Thirty-four percent of patients were diagnosed with mild PE while the rest had severe PE. Thirty-nine percent
of PE patients were early-onset cases while the others were late-onset cases.
Expression of studied ncRNAs in PE versus healthy pregnancies. The studied ncRNAs were
expressed in sera of PE cases and healthy pregnancies with varying levels (Fig. 1). Notably, serum miR-17 was
upregulated by a median 3.5-fold (P = 0.003), while serum miR-363 and MALAT-1 were downregulated by
median 4 and 2.1-fold, respectively (P = 0.001 and P = 0.005, respectively) in PE patients compared to controls.
On the other hand, serum HOTAIR expression levels was not changed between PE patients and healthy preg-
nancies (P = 0.25) (Fig. 1 and Table 2).
Expression of studied ncRNAs in PE patients regarding PE severity. Serum miR-17 levels were
elevated in severe PE compared to mild cases (P = 0.002). Conversely, serum miR-363 (P = 0.005) and MALAT-1
(P = 0.0004) levels were reduced in severe PE compared to mild disease. Again, no changes were observed in
serum HOTAIR levels between the two groups (P = 0.67) (Table 2).
Expression of studied ncRNAs in PE patients regarding PE onset. Only serum levels of miR-363
showed differential expression between early-onset and late-onset PE cases, with markedly lower levels in the
early-onset PE group (P = 0.001) (Table 2). To further examine the role of studied ncRNAs with the risk of
early- or late-onset PE, we conducted a stratification analysis comparing early- or late-onset PE vs early or late
controls (with matched gestational weeks at delivery, P > 0.05), respectively (Table 2). We recorded a marked
downregulation of serum miR-363 in early-onset PE compared with early controls (P < 0.0001), while levels of
other studied ncRNAs were not significantly different in the same comparison. On the other hand, we observed
serum miR-17 upregulation (P = 0.0003) as well as MALAT-1 downregulation (P < 0.0001) in the late-onset PE
group when compared with the late controls, while miR-363 and HOTAIR levels were comparable among the
two groups (P = 0.8 and 0.68, respectively).
Scientific Reports | (2022) 12:1249 | https://doi.org/10.1038/s41598-022-05119-9 2
Vol:.(1234567890)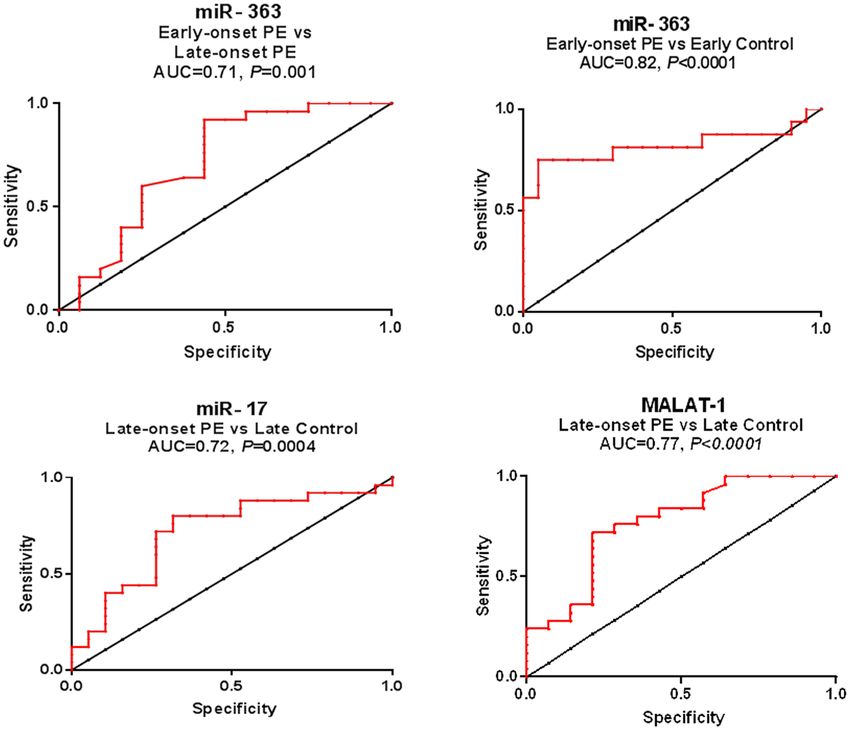
www.nature.com/scientificreports/

                                  Parameters                          Controls (n = 78)   Preeclampsia (n = 82)   P value
                                  Maternal age (years), range         31 ± 6.55 (18–41)   29.73 ± 6.83 (18–42)    0.23
                                  Body mass index (BMI) (kg/m2)       32.36 ± 4.7         31.2 ± 5.26             0.14
                                  Parity (n)                          1.64 ± 1.78         1.73 ± 1.62             0.73
                                  Abortion (n)                        0.82 ± 1.45         0.707 ± 1.44            0.62
                                  Gravidity (n)                       2.46 ± 2.47         2.44 ± 2.41             0.95
                                  GA (weeks)                          37.31 ± 1.53        36.65 ± 2.47            0.045*
                                  FBW (kg)                            3.28 ± 0.38         2.84 ± 0.49             < 0.0001*
                                  SBP (mmHg)                          116.8 ± 12.87       164.4 ± 17.47           < 0.0001*
                                  DBP (mmHg)                          72.31 ± 7.01        108.3 ± 10.98           < 0.0001*
                                  MAP (mmHg)                          94.55 ± 8.25        136.3 ± 12.85           < 0.0001*
                                  CRP (mg/L)                          6 (3–30)            27 (5–56.25)            < 0.0001*
                                  Hb (g/dL)                           10.74 ± 1.24        10.74 ± 1.19            0.99
                                  TLC * 1000 (cells/mm3)              8.12 ± 2.59         8.23 ± 3                0.8
                                  Platelet count * 1000 (cells/mm3)   304.26 ± 80.26      286.78 ± 95             0.21
                                  Fasting plasma glucose (mg/dL)      82.85 ± 13.75       81.24 ± 13.18           0.45
                                  AST (U/L)                           18.46 ± 8.95        21.59 ± 10.5            0.06
                                  ALT (U/L)                           18.36 ± 10.09       20.66 ± 9.06            0.14
                                  ALP (U/L)                           73.82 ± 2.11        74.85 ± 5.94            0.15
                                  Albumin (g/dL)                      3.19 ± 0.27         3.12 ± 0.38             0.17
                                  Total bilirubin (mg/dL)             0.6 ± 0.25          0.53 ± 0.26             0.097
                                  Prothrombin time (s)                12.66 ± 0.79        12.62 ± 0.69            0.75
                                  Urea (mg/dL)                        26.23 ± 10.14       25.25 ± 9.9             0.53
                                  Creatinine (mg/dL)                  0.68 ± 0.197        0.81 ± 0.246            0.0003*
                                  Uric acid (mg/dL)                   3.55 ± 0.41         3.89 ± 0.69             0.0003*
                                  Smoking, n (%)                                                                  0.1
                                  Yes                                 27 (34.6)           39 (47.5)
                                  No                                  51 (65.4)           43 (52.5)
                                  Amniotic fluid, n (%)                                                           < 0.0001*
                                  Normal                              72 (92.3)           36 (44)
                                  Low                                 6 (7.7)             46 (56)
                                  Doppler, n (%)                                                                  < 0.0001*
                                  Normal                              72 (92.3)           48 (58.5)
                                  Abnormal                            6 (7.7)             34 (41.5)
                                  IUGR, n (%)                                                                     < 0.0001*
                                  No                                  72 (92.3)           42 (51.2)
                                  Yes                                 6 (7.7)             40 (48.8)
                                  MOD, n (%)                                                                      0.003*
                                  VD                                  31 (40)             15 (18.3)
                                  CS                                  47 (60)             67 (81.7)
                                  Albuminuria, n (%)                                                              Nil
                                  4+                                  Nil                 18 (22)
                                  3+                                                      22 (27)
                                  2+                                                      24 (29)
                                  1+                                                      18 (22)

                                 Table 1.  Characteristics of PE patients and healthy pregnancies. Results are presented as mean ± SD, median
                                 (25%–75% percentiles) or number (percentage). ALP, alkaline phosphatase; ALT, alanine transaminase;
                                 AST, aspartate transaminase; BMI, body mass index; CRP, C-reactive protein; CS, caesarean section; DBP,
                                 diastolic blood pressure; FBW, fetal birth weight; GA, gestational age; Hb, hemoglobin; IUGR, intrauterine
                                 growth restriction; MAP, mean arterial pressure; MOD, mode of delivery; SBP, systolic blood pressure; TLC,
                                 total leukocyte count; VD, vaginal delivery. *Statistically significant, P < 0.05. Blood pressure was measured at
                                 admission for controls and PE patients. GA was measured at admission using ultrasound device. IUGR was
                                 defined as weight below the 10th percentile for the GA.

Scientific Reports |   (2022) 12:1249 |                     https://doi.org/10.1038/s41598-022-05119-9                                               3

                                                                                                                                             Vol.:(0123456789)
www.nature.com/scientificreports/
Figure 1. Serum expression profiles of miR-17, miR-363, MALAT-1 and HOTAIR in PE patients. The box
represents the 25–75% percentiles; the line inside the box represents the median and the upper and lower lines
representing the 10%-90% percentiles of relative gene expression levels ( 2−∆Ct) of studied parameters in PE
(n = 82) compared to healthy pregnancies (n = 78).
Correlation of studied ncRNAs with each other in PE patients. In the whole PE group, we recorded
many significant correlations between serum levels of the investigated ncRNAs where MALAT-1 was positively
correlated with both miR-17 (r = 0.401, P = 0.017) and HOTAIR (r = 0.453, P = 0.0004) expression levels. Also,
there was a positive correlation between miR-17 and miR-363 (r = 0.273, P = 0.015) (Table 3).
Correlation of studied ncRNAs with clinicopathological data of PE patients. In the whole PE
group, we noticed many significant correlations between serum levels of the investigated ncRNAs and clin-
icopathological data (Table 3). MiR-17 showed positive correlations with BMI (r = 0.43, P = 0.002), IUGR
(r = 0.3, P = 0.04), abnormal Doppler (r = 0.234, P = 0.046), low amniotic fluid (r = 0.245, P = 0.044), mode of
delivery (MOD) (r = 0.441, P = 0.004) and albuminuria (r = 0.312, P = 0.04), while inversely correlated with GA
(r = − 0.328, P = 0.036) and FBW (r = − 0.324, P = 0.039). miR-363 recorded negative correlations with BMI
(r = − 0.315, P = 0.045) and abnormal Doppler (r = − 0.26, P = 0.04) and a positive correlation with GA (r = 0.412,
P = 0.006). MALAT-1 was negatively correlated with maternal age (r = − 0.341, P = 0.029) and albuminuria
(r = − 0.35, P = 0.025), while showed a positive correlation with GA (r = 0.322, P = 0.04). HOTAIR was positively
correlated with albuminuria (r = 0.274, P = 0.039). This correlations link the deregulated levels of our studied
ncRNAs with PE pathology.
Performance of investigated serum ncRNAs in PE diagnosis, onset and severity. Serum miR-
17, miR-363, and MALAT-1 distinguished PE patients from the healthy controls in the ROC curve analysis with
AUC = 0.67, P = 0.009, sensitivity (SN) = 73% and specificity (SP) = 62% at a cut off > 1.6 (fold, 2 −∆∆Ct) for miR-
17; AUC = 0.76, P < 0.0001, SN = 61% and SP = 95% at a cut off < 0.17-fold for miR-363, and AUC = 0.66, P = 0.01,
SN = 80% and SP = 62% at a cut off < 0.62-fold for MALAT-1 (Fig. 2). By comparison, miR-363 was a potential
discriminator and seems to have better diagnostic accuracy than miR-17 and MALAT-1, but differences between
AUCs didn’t reach statistical significance (difference = 0.09, P = 0.079, difference = 0.1, P = 0.11, respectively).
Scientific Reports | (2022) 12:1249 | https://doi.org/10.1038/s41598-022-05119-9 4
Vol:.(1234567890)www.nature.com/scientificreports/
Parameter PE (n = 82) compared to healthy pregnancies (n = 78) P value
miR-17 3.5 (0.95–27.74) 0.003*
miR-363 0.25 (0.026–4.287) 0.001*
HOTAIR 0.98 (0.42–2.1) 0.25
MALAT-1 0.48 (0.15–0.91) 0.005*
Mild PE (n = 28) Severe PE (n = 54) P value
miR-17 0.94 (0.427–9.6) 3.4 (2.37–14.3) 0.002*
miR-363 1.53 (0.186–4.417) 0.027 (0.01–0.23) 0.005*
HOTAIR 1.53 (0.663–4) 1.715 (0.69–3.07) 0.67
MALAT-1 1.078 (0.436–2.38) 0.238 (0.064–0.64) 0.0004*
Early-onset PE (n = 32) Late-onset PE (n = 50) P value
miR-17 2.63 (0.55–7.4) 2.81 (1.93–12.3) 0.58
miR-363 0.018 (0.001–0.326) 0.158 (0.028–2.23) 0.001*
HOTAIR 1.27 (0.66–3.18) 1.97 (0.69–3.31) 0.33
MALAT-1 0.3 (0.112–0.5) 0.24 (0.064–0.71) 0.76
Early-onset PE (n = 32) compared to early controls (n = 40) P value
miR-17 1.97 (0.41–5.55) 0.2
miR-363 0.025 (0.003–0.44) < 0.0001*
HOTAIR 1.625 (0.84–4.08) 0.37
MALAT-1 0.46 (0.17–0.76) 0.37
Late-onset PE (n = 50) compared to late controls (n = 38) P value
miR-17 5.46 (3.97–25.28) 0.0003*
miR-363 0.68 (0.12–9.65) 0.8
HOTAIR 1.91 (0.67–3.2) 0.68
MALAT-1 0.22 (0.057–0.63) < 0.0001*
Table 2. Fold change of serum miR-17, miR-363, MALAT-1 and HOTAIR expression levels in PE patients
regarding risk, severity and onset. Data are presented as median (25%–75% percentiles) of the fold change
data. The Mann-Whitney U test was used for data analysis. *indicates statistical significance (P < 0.05). Fold
change was calculated using 2–∆∆Ct relative to the corresponding control group. Bold values indicates statistical
significance.
miR-17, miR-363 and MALAT-1 were potential discriminators of severe from mild PE cases with AUC = 0.71,
P = 0.002, SN = 92.31% and SP = 57.14% at a cut off > 1.47-fold for miR-17; AUC = 0.7, P = 0.004, SN = 70.37%
and SP = 71.43% at a cut off < 0.33-fold for miR-363, and AUC = 0.73, P = 0.0005, SN = 81.48% and SP = 71.43%
at a cut off < 0.66-fold for MALAT-1 (Fig. 2).
Only miR-363 was a potential discriminator of early-onset from late-onset PE cases (AUC = 0.71, P = 0.001)
with SN = 92% and SP = 56.25% at a cut off < 0.018-fold. Moreover, it was the only studied ncRNA that distin-
guished early-onset PE patients from early controls (AUC = 0.82, P < 0.0001) with SN = 75% and SP = 95% at a
cut off < 0.14-fold. On the other hand, miR-17 (AUC = 0.72, P = 0.0004) and MALAT-1 (AUC = 0.77, P < 0.0001)
were potential discriminators of late-onset PE patients from late controls with SN = 80% and SP = 68% at a cut
off > 3.1-fold for miR-17, and SN = 72% and SP = 79% at a cut off < 0.52-fold for MALAT-1 (Fig. 3). All cutoff
values were expressed as fold change (2−∆∆Ct) and determined as the value that maximized the sum of SN and SP.
Association of studied parameters with early PE and PE severity using logistic regression anal‑
ysis. The variables associated with early PE (early-onset PE vs early controls) (Table 4) and its severity (severe
vs mild PE) (Table 5) were identified using univariate and multivariate logistic regression analyses. miR-363
along with clinical parameters; SBP, DBP, MAP, CRP, creatinine, IUGR, abnormal Doppler and low amniotic
fluid come out to be associated with early PE (P < 0.05) in the univariate analysis. miR-363 together with SBP
come out as the final independent variables associated with early PE in the multivariate analysis with adjustment
by maternal age and GA as cofounders. Additionally, MALAT-1 along with clinical data; SBP, DBP, MAP, creati-
nine, uric acid, IUGR and abnormal Doppler were shown to associate with PE severity in the univariate analysis
for (P < 0.05). Then, MALAT-1 together with SBP and serum uric acid turned out as the final independent vari-
ables associated with the severity of PE in the multivariate analysis with adjustment by maternal age.
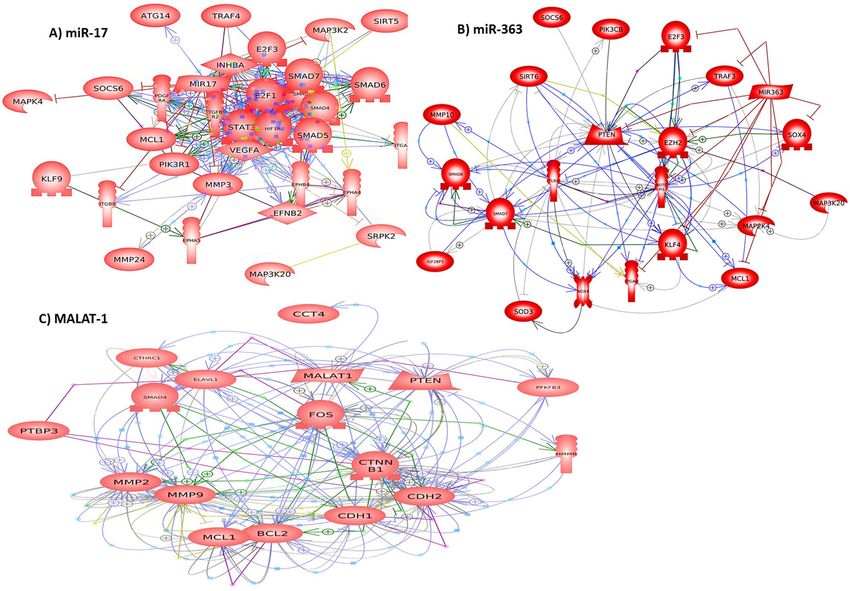
Results of functional analysis. We listed the selected target genes of miR-17, miR-363 and MALAT-1
most functionally linked to PE, their protein–protein interaction (PPI) P value, gene ontology (GO) biologi-
cal process and KEGG pathways of the PPI in Table 6. The PPI network construction for miR-17, miR-363 and
MALAT-1 is visualized in Fig. 4.
Scientific Reports | (2022) 12:1249 | https://doi.org/10.1038/s41598-022-05119-9 5
Vol.:(0123456789)www.nature.com/scientificreports/
Data miR-17 miR-363 HOTAIR MALAT-1
Maternal age
r − 0.25 − 0.034 − 0.232 − 0.341
P 0.115 0.832 0.144 0.029*
BMI
r 0.43 − 0.315 0.119 0.074
P 0.002* 0.045* 0.457 0.644
Abortion
r 0.058 0.113 0.063 − 0.182
P 0.719 0.482 0.693 0.256
GA
r − 0.328 0.412 − 0.066 0.322
P 0.036* 0.006* 0.682 0.04*
Smoking
r − 0.136 − 0.108 − 0.045 − 0.141
P 0.397 0.501 0.778 0.378
SBP
r 0.034 0.126 0.06 0.163
P 0.833 0.432 0.711 0.308
DBP
r 0.039 0.09 0.08 0.099
P 0.811 0.575 0.621 0.539
MAP
r 0.019 0.164 0.072 0.086
P 0.907 0.307 0.657 0.594
CRP
r − 0.134 0.078 0.028 − 0.155
P 0.403 0.629 0.864 0.332
Albuminuria
r 0.312 − 0.029 0.274 − 0.35
P 0.04* 0.856 0.039* 0.025*
Uric acid
r − 0.204 0.226 − 0.083 0.014
P 0.2 0.156 0.606 0.929
FBW
r − 0.324 0.128 0.15 − 0.018
P 0.039* 0.424 0.348 0.912
IUGR
r 0.3 0.18 − 0.134 0.049
P 0.04* 0.103 0.403 0.759
Abnormal Doppler
r 0.234 − 0.26 − 0.295 − 0.155
P 0.046* 0.04* 0.061 0.334
Low amniotic fluid
r 0.245 0.031 − 0.16 0.042
P 0.044* 0.847 0.318 0.797
MOD
r 0.441 0.151 0.079 0.23
P 0.004* 0.347 0.622 0.148
miR-17
r – 0.273 0.232 0.401
P 0.015* 0.145 0.017*
miR-363
r 0.273 – 0.121 − 0.112
P 0.015* 0.518 0.745
HOTAIR
r 0.232 0.121 – 0.453
Continued
Scientific Reports | (2022) 12:1249 | https://doi.org/10.1038/s41598-022-05119-9 6
Vol:.(1234567890)www.nature.com/scientificreports/
Data miR-17 miR-363 HOTAIR MALAT-1
p 0.145 0.518 0.0004*
MALAT-1
r 0.401 − 0.112 0.453 –
P 0.017* 0.745 0.0004*
Table 3. Correlation between studied ncRNAs with each other and with clinicopathological data in PE
patients. *P < 0.05: statistically significant. BMI, body mass index; CRP, C-reactive protein; DBP, diastolic blood
pressure; FBW, fetal birth weight; GA, gestational age; HOTAIR, homeobox transcript antisense RNA; IUGR,
intrauterine growth restriction; MALAT-1, metastasis associated lung adenocarcinoma transcript 1; MAP,
mean arterial pressure; MOD, mode of delivery; SBP, systolic blood pressure. Bold values indicate statistical
significance.
Figure 2. Diagnostic performance of serum miR-17, miR-363 and MALAT-1 and their association with
severity in women with PE. ROC curve analysis of studied parameters to discriminate PE group (n = 82) versus
healthy pregnancies (n = 78) and severe (n = 54) versus mild PE (n = 28).
Discussion
New molecular biomarkers that give mechanistic insights in PE and could boost its screening, early detection
and prognosis are urgently needed to reduce PE-associated maternal death. In this exploratory study, we have
conducted a systematic bioinformatics analysis and selected 4 PE-related ncRNAs for our biomarker study.
Results showed that serum miR-17, miR-363 and MALAT-1 expression profiles were surrogate biomarkers of PE
risk and severity. Furthermore, we are the first to show an association between serum miR-363 and early-onset
PE, and between serum MALAT-1 downregulation and PE progression.
In PE patients, we observed serum MALAT-1 downregulation with miR-17 upregulation, which verify their
cross-interaction in PE development and progression. To explain, miR-17, MALAT-1 and also HOTAIR com-
monly regulate vascular endothelial growth factor A (VEGFA)15,16, through which they could presumably cross-
talk to regulate angiogenesis. Taking into account that MALAT-1 and HOTAIR were shown to act as ceRNAs for
miR-1717,18, thus MALAT-1 underexpression could elevate miR-17 with concomitant downregulation of miR-17
target genes, including VEGFA resulting in impaired placental angiogenesis. On the other hand, both MALAT-1
Scientific Reports | (2022) 12:1249 | https://doi.org/10.1038/s41598-022-05119-9 7
Vol.:(0123456789)www.nature.com/scientificreports/
Figure 3. Diagnosis of either early- or late-onset PE using serum miR-363, miR-17 and MALAT-1. ROC curve
analysis of studied parameters to discriminate early-onset PE (n = 32) versus late-onset (n = 50), early-onset PE
(n = 32) vs early controls (n = 40), and late-onset PE (n = 50) vs late controls (n = 38).
Parameter Beta coefficient SE P value OR 95% CI
Univariate analysis
miR-363 − 1.63 0.65 0.012* 0.195 0.05–0.69
SBP 0.47 0.16 0.004* 1.6 1.16–2.19
DBP 0.71 0.35 0.044* 2.03 1.02–3.96
MAP 0.4 0.14 0.0035* 1.48 1.14–1.93
CRP 0.042 0.013 0.0008* 1.04 1.02–1.07
Creatinine 3.08 1.03 0.0028* 21.74 2.89–63.63
IUGR 2.44 0.677 0.0007* 7 2.06–19.83
Abnormal Doppler 2.14 0.68 0.0002* 9 2.74–26.98
Low amniotic fluid 2.73 0.68 > 0.0001* 63 13.7–239.4
Multivariate analysisa
miR-363 − 1.3 0.7 0.02* 0.21 0.04–0.7
SBP 0.495 0.2 0.005* 1.75 1.6–2.1
Constant − 9.57
Table 4. Association of biomarkers, maternal and fetal characteristics with early-onset PE compared with
early controls using logistic regression analysis. Univariate analysis was done using early-onset PE cases, n = 32
cases and early healthy pregnancies, n = 40 matched with gestational weeks at delivery (P > 0.05). Significant
variables were then entered into stepwise forward multivariate analysis (P < 0.05 for entering and P < 0.1 for
removal from the model). −2 log likelihood of the model, P < 0.0001. *Statistically significant, P < 0.05. CI,
confidence interval; CRP, C-reactive protein; DBP, diastolic blood pressure; FBW, fetal birth weight; IUGR:
intrauterine growth restriction; MAP, mean arterial pressure; OR, odds ratio; SBP, systolic blood pressure; SE,
standard error. Bold values indicate statistical significance. a Controlled by maternal age and gestational age as
covariates, OR (95% CI) = 0.85 (0.350–2.01) and 0.66 (0.28–1.71), respectively.
Scientific Reports | (2022) 12:1249 | https://doi.org/10.1038/s41598-022-05119-9 8
Vol:.(1234567890)www.nature.com/scientificreports/
Parameter Beta coefficient SE P value OR 95% CI
Univariate analysis
miR-17 0.045 0.04 0.27 1.05 0.96–1.13
miR-363 2.8 3.01 0.35 16.5 0.04–60.59
MALAT-1 − 2.69 1.16 0.02* 0.068 0.007–0.66
GA − 0.093 0.17 0.59 0.91 0.654–1.271
SBP 0.1 0.03 0.002* 1.11 1.039–1.18
DBP 0.29 0.093 0.002* 1.34 1.11–1.601
MAP 0.2 0.062 0.0015* 1.22 1.08–1.38
CRP 0.003 0.009 0.77 1.002 0.986–1.02
Creatinine 3.77 1.65 0.023* 43.42 1.69–110.7
Uric acid 2 0.866 0.021* 7.37 1.349–40.23
IUGR 2.48 0.87 0.0041* 12 2.198–65.51
Abnormal Doppler 2.94 1.11 0.008* 18.9 2.15–66.27
Low amniotic fluid 0.82 0.67 0.223 2.67 0.608–8.447
Multivariate analysisa
MALAT-1 − 2.49 1.13 0.027* 0.068 0.008–0.68
SBP 0.169 0.07 0.015* 1.12 1.04–1.16
Uric acid 2.02 1.039 0.049* 6.83 1.001–23.5
Constant – 33.17
Table 5. Association of biomarkers, maternal and fetal characteristics with severe PE compared with mild
PE using logistic regression analysis. Univariate analysis was done using mild PE, n = 28; severe PE, n = 54
cases. Significant variables were then entered into stepwise forward multivariate analysis (P < 0.05 for entering
and P < 0.1 for removal from the model). −2 log likelihood of the model, P < 0.0001. *Statistically significant,
P < 0.05. CI, confidence interval; CRP, C-reactive protein; DBP, diastolic blood pressure; GA, gestational age;
IUGR: intrauterine growth restriction; MAP, mean arterial pressure; SBP, systolic blood pressure; SE, standard
error. Bold values indicate statistical significance. a Controlled by maternal age as covariate, OR (95%CI) = 0.8
(0.33–1.9).
and HOTAIR are estrogen receptor α (ERα) and hypoxia inducible factor-1α (HIF1A) transcriptional targets19–21.
As HIF1A is a predicted target for miR-17 (Table 6) and ERα is a known target of miR-17-92 f amily12, one may
speculate that miR-17 upregulation could possibly affect HIF1A and ERα expression and hence the transcription
of MALAT-1 gene. However, this relation should be further investigated.
Although several target genes and biological pathways have been previously identified for our selected ncR-
NAs and were linked to PE pathogenesis, we have conducted target gene analysis and PPI network analysis to
further explain the role of miR-17, MALAT-1 and miR-363 in PE pathogenesis (Table 6 and Fig. 4). We found
several common targets and biological pathways for miR-17, miR-363 and MALAT-1 which are involved in
VEGF signaling pathway, HIF signaling, ephrin receptor signaling, transforming growth factor (TGF)-β/SMAD
signaling as well as epidermal growth factor receptor (EGFR), MAPK, PI3K/Akt, JAK/STAT and canonical Wnt
signaling pathways. Notably, these pathways are known to regulate many trophoblastic cell a ctivities4,5. Together,
these data clarify that these miRNAs could interplay in PE development and progression.
The observed elevation of serum miR-17-5p in PE coincides with previously reported in whole maternal
peripheral blood22 and placenta9,11,23 among PE patients. Indeed, circulating miRNAs in pregnant women mainly
originate from the placenta. Conversely, miR-17 was not altered in p lasma9, whole maternal blood or placenta
of PE patients24,25. Mechanistically, miR-17 targets a set of genes including, VEGFA, ephrin type-B receptor 4
(EPHB4), EPHA4, EPHA5, ephrin-B2 (EFNB2), and matrix metalloproteinases (Table 6, Fig. 4). These genes
are cardinal for vascular remodeling and CTB invasion during placentation11. In early placental development
low levels of miR-17 maintains trophoblastic differentiation by upregulating EFNB2 and EPHB4, but in PE
miR-17 overexpression suppresses these genes causing inhibition of trophoblastic invasion and defective placen-
tal vasculature11,23. Moreover, miR-17 promotes oxidative stress-induced apoptosis via targeting STAT3 which
interfere with PE development26.
We observed elevated serum miR-17 in severe PE as well as in late-onset PE patients vs late controls, but not
among early and late gestational stages of PE. Similarly, miR-17 was upregulated in severe PE placentas9 and
in whole maternal peripheral blood in severe P E22. Conversely, higher postpartum expression of miR-17-5p
was observed within late PE patients compared to those with early P E22. However, placental, plasma and whole
maternal blood miR-17 were not correlated with either PE severity or onset in other studies9,24,25. Our target gene
analysis could justify the link between miR-17 and PE severity on the basis that miR-17 is predicted to target
TGFBR2, SMAD6/SMAD7 and SMAD4/SMAD5 thus could modulate TGF-β signaling. Indeed, this pathway
was shown to be central to PE pathogenesis27.
The observed association of miR-17 with BMI is consistent with its adipogenesis-promoting a ctions28, con-
firming that obesity is a risk factor for PE, with many common mechanisms interplay to link obesity with a
E29. The negative correlation between miR-17 and GA is consistent with that miR-17 expression
higher risk of P
Scientific Reports | (2022) 12:1249 | https://doi.org/10.1038/s41598-022-05119-9 9
Vol.:(0123456789)www.nature.com/scientificreports/
Gene ontology for PPI network KEGG pathway analysis for PPI network
Non-coding RNA Target genes PPI P value Biological process Strength (FDR) Pathway Strength (FDR)
Regulation of vascular endothe-
1.72 (0.00026) TGF-beta signaling pathway 1.53 (7.06e−11)
lial cell proliferation
Developmental cell growth 1.05 (0.0099) VEGF signaling pathway 1.43 (6.33e−06)
Angiogenesis 1.2 (1.65e−12) HIF-1 signaling pathway 1.51 (1.23e−11)
Enzyme linked receptor protein
1.12 (6.78e−22) MAPK signaling pathway 1.24 (3.53e−14)
signaling pathway
Protein stabilization 0.88 (0.0078) JAK-STAT signaling pathway 1.2 (2.29e−07)
VEGFA, EPHB4, EFNB2,
EPHA4, EPHA5, TGFBR2, Protein phosphorylation 0.95 (3.24e−16) PI3K-Akt signaling pathway 1.24 (8.81e−17)
HIF1A, ITGA4, ITGB8, STAT3, Cellular response to oxidative Regulation of insulin receptor
E2F1, MAP3K2, MAPK4, 0.85 (0.0033) 1.08 (0.0356)
stress signaling pathway
SMAD1, SMAD4, SMAD5,
miR-17 1.00E-16 Extracellular matrix organization 0.73 (0.0095) SMAD protein complex assembly 1.96 (0.0017)
SMAD6, SMAD7, PIK3R1, PDG-
FRA, MCL-1, MMP24, MMP3, Regulation of protein kinase Growth hormone receptor sign-
SRPK2, KLF9, MAP3K20, 0.83 (6.30e−09) 1.57 (0.0065)
activity aling pathway
TRAF4, E2F3, SIRT5, SOCS6,
ATG14, INHBA Ephrin receptor signaling
Embryo development 0.8 (4.77e−09) 1.6 (7.36e−12)
pathway
Regulation of DNA-binding Epidermal growth factor receptor
0.67 (0.0071) 1.08 (0.0356)
transcription factor activity signaling pathway
Integrin-mediated signaling
Apoptosis 1.07 (0.00021) 1.39 (0.0159)
pathway
Platelet activation 0.9 (0.0217)
Tissue remodeling 1.13 (0.0013)
Tissue remodeling 1.18 (0.0054) Notch signaling pathway 1.78 (4.79e−08)
Regulation of DNA-binding Canonical Wnt signaling
0.98 (3.00e−05) 1.19 (0.0052)
transcription factor activity pathway
Regulation of developmental
0.98 (0.00037) TGF-beta signaling pathway 1.24 (0.0026)
growth
Cellular response to reactive
1.06 (0.0096) VEGF signaling pathway 1.21 (0.0142)
oxygen species
Regulation of angiogenesis 0.84 (0.0107) HIF-1 signaling pathway 1.16 (0.0037)
KLF4, ITGA6, PTEN, EZH2, Regulation of signal transduction 0.61 (4.69e−10) JAK-STAT signaling pathway 1.08 (0.0016)
NOX4, SOD3, SOX4, MAP2K4, Regulation of cellular response
MAP3K20, MCL1, E2F3, 0.79 (0.00036) PI3K-Akt signaling pathway 0.92 (0.00053)
miR-363 4.03E−11 to stress
SMAD6, SMAD7, TRAF3, TLR4,
IGF2BP3, TGFIF1, NOTCH1, Platelet activation 1.08 (0.0090) Activation of MAPK activity 1.2 (0.00019)
MMP10, PIK3CB, SIRT6, SOCS6 Apoptosis 1.03 (0.0072) Insulin signaling pathway 0.85 (0.0455)
Regulation of protein kinase
1.07 (0.00059) Estrogen signaling pathway 0.86 (0.0454)
signaling
Protein stabilization 0.94 (0.0176)
Regulation of protein phospho-
0.77 (3.55e−08)
rylation
Enzyme linked receptor protein
0.61 (0.0121)
signaling pathway
Tissue regeneration 1.25 (0.0201)
Platelet-derived growth factor
Extracellular matrix organization 1.02 (0.0057) 1.66 (0.0083)
receptor signaling pathway
SMAD protein signal transduc-
Embryo implantation 1.6 (0.0097) 1.43 (0.0170)
tion
Ephrin receptor signaling
Protein stabilization 1.58 (2.53e−09) 1.3 (0.0252)
pathway
Regulation of epidermal growth
PTEN, SMAD4, MMP2, MMP9, Apoptosis 1.24 (0.0042) 1.29 (0.0256)
factor receptor signaling pathway
E-cadherin, N-cadherin,
MALAT-1 β-catenin, Elavl1, CTHRC1, 5.09E−12 Cellular response to oxidative
1.15 (0.0023) PI3K-Akt signaling pathway 0.83 (0.0359)
CCT4, HMMR, MCL-1, Bcl-2, stress
PTBP3, PFKFB3, C-FOS Enzyme linked receptor protein
0.83 (0.0026) HIF-1 signaling pathway 1.2 (0.0310)
signaling pathway
Developmental growth 0.84 (0.0402) Estrogen signaling pathway 1.37 (0.00056)
Regulation of canonical Wnt
Intracellular signal transduction 0.69 (0.0090) 1.1 (0.0462)
signaling pathway
Cell migration 0.68 (0.0195) TGF-beta signaling pathway 1.25 (0.0277)
Embryo development 0.64 (0.0256) Response to growth factor 0.79 (0.0211)
Table 6. Bioinformatics analysis of the selected placental-related non-coding RNAs-related genes and
protein–protein interactions linked to PE. The PPI and functional enrichment analysis for the PPI were
conducted using SPRING software. Data relevant to KEGG pathways http://www.kegg.jp/kegg/kegg1.html.
PPI, protein–protein interactions. FDR, false discovery rate.
Scientific Reports | (2022) 12:1249 | https://doi.org/10.1038/s41598-022-05119-9 10
Vol:.(1234567890)www.nature.com/scientificreports/
Figure 4. Construction of non-coding RNA-related PPI networks linked to PE. (A) miR-17, (B) miR-363 and
(C) MALAT-1. Pathway Studio online software was used. Data relevant to KEGG software http://www.kegg.jp/
kegg/kegg1.html.
was altered in porcine placenta of different GAs, proposing that miR-17 declines as GA advances30. miR-17
downregulation was also reported in third trimester placentas compared with first trimester ones31. This cor-
relation is attributed to that miR-17 targets VEGFA which is responsible for increasing the growth of placental
vasculature as GA i ncreases32. Although previous reports were d iscrepant33,34, the negative correlation between
miR-17 and FBW intensifies that miR-17 can be used as a prognostic biomarker for maternal diseases affecting
birth weight35. Despite controversial reports24,25, our results might link dysregulated miR-17 and IUGR, a well-
known risk factor of PE especially the severe form.
The observed serum miR-363 downregulation mimics prior reports of placental miR-363 underexpression in
PE9,36,37. Conversely, plasma and serum miR-363 expression did not alter in PE throughout the 3 trimesters9,38.
miR-363 is an anti-apoptotic miRNA; its downregulation leads to excessive placental trophoblast apoptosis exhib-
ited in P E38. Furthermore, inhibition of trophoblast cell differentiation and invasion was associated with decline
of placental miR-363 expression39. To explain, we showed that miR-363 is predicted to target several genes,
among them integrin-A6 (ITGA6), a receptor for cell-extracellular matrix interaction important for trophobalst
migration and invasion; and Kruppel-like factor 4 (KLF4), a transcription factor which regulates angiogenesis.
The observed decline of serum miR-363 in severe and early-onset PE coincided with previously reported in PE
placenta9,36,37. However, plasma miR-363 was not correlated with PE s everity9 or o nset38 in other studies. miR-363
deregulation associates with PE severity by targeting placental sodium coupled neutral amino acid transporters
causing variation in amino acids transport and nutrient transfer, ultimately leading to PE p athology39. Moreover,
aberrantly expressed miR-363 together with EZH2 and nudix hydrolase 21 were shown to influence CTBs growth
and migration40. The observed miR-363 downregulation in both early-onset and severe PE supports the notion
that early-onset PE is often more severe than late-onset PE and largely originates from poor placentation in the
first trimester41. Both PE phenotypes exhibit intensified systemic inflammatory responses exposing vessels and
cells to overwhelming oxidative stress, with consequent a poptosis37.
The recorded negative correlation between miR-363 and BMI is consistent with its anti-adipogenic
properties42. The positive correlation between serum miR-363 and GA coincides with placental miR-363 upreg-
ulation in third versus first trimester31. However, serum miR-363 was not correlated with GA throughout the
three trimesters in P E37.
The observed downregulation of serum MALAT-1 in PE matches the previously reported data in placenta,
umbilical cords and mesenchymal stem cells (MSCs) derived from PE p atients13,15,43. Using a bioinformatics
Scientific Reports | (2022) 12:1249 | https://doi.org/10.1038/s41598-022-05119-9 11
Vol.:(0123456789)www.nature.com/scientificreports/
approach, we identified a MALAT-1-related PPI network linked to PE, including PTEN, SMAD4, MMP2, MMP9,
E-cadherin, N-cadherin, β-catenin, Elavl1, CTHRC1, CCT4, HMMR, MCL-1, BCl-2, PTBP3, PFKFB3 and
C-FOS. This PPI was enriched in extracellular matrix organization, cell migration, embryo development, cellular
response to oxidative stress and apoptosis and is involved in platelet-derived growth factor receptor signaling,
TGF-β/SMAD signaling, ephrin receptor signaling, EGFR signaling, HIF signaling and estrogen signaling as
well as PI3K/Akt and Wnt/β-catenin signaling pathways. To put this in context, placental MALAT-1 is important
for trophoblast invasion; its silencing in placental trophoblastic cells suppressed invasion, migration and motil-
ity through influencing CTHRC1 and CCT4 expression13,44,45. Interestingly, MALAT-1 is required for capillary
formation and angiogenesis46–48; its knockdown markedly reduced angiogenesis by regulating VEGF, TGF-β,
fibroblast growth factor-2 and tumour necrosis factor-α e xpressions19,46,48. Moreover, MALAT-1 modulates cell
proliferation by acting as a ceRNA via interactions with miRNAs during the recurrent abortion o ccurrence47.
We further showed a decline in serum MALAT-1 in severe PE as well as in late-onset PE patients vs late
controls, but not among early- and late-onset PE cases. Similarly, MALAT-1 underexpression was involved in
severe PE within umbilical cords and MSCs from PE patients through affecting MSCs proliferation, angiogenesis,
apoptosis, migration, invasion and immunosuppressive properties15. Conversely, MALAT-1 was not correlated
with the onset of PE in placenta, umbilical cord and MSCs from PE patients13,15.
Interestingly, we found negative associations of MALAT-1 with maternal age and albuminuria which were in
contrast with previous fi ndings13,49,50. In fact, PE is more common in women who become pregnant at advanced
51
maternal age . Therefore, the decline in MALAT-1 with advanced maternal age presumably contributes to PE.
Moreover, the inverse correlation between MALAT-1 and albuminuria could exacerbate PE pathology presum-
ably through a dysregulated β-catenin/MALAT-1 axis which promotes podocyte malfunction, albuminuria and
finally kidney fibrosis52. Although the correlation between MALAT-1 and GA was discrepant49,50, we found a
positive correlation.
We reported a lack of association between serum HOTAIR and PE risk. Conversely, HOTAIR was upregulated
in PE placenta, where it reduced cell proliferation and enhanced apoptosis by increasing caspase-314. HOTAIR
was also elevated in severe PE, and altered HOTAIR was implicated in PE d evelopment53. This matches with our
observed positive correlation between HOTAIR and albuminuria.
There are several limitations in our study. First, this was a case–control study in which the included patients
and controls were recruited only from one hospital. Second, a modest sample size was used; however, cases were
extremely filtered due to our rigorous inclusion and exclusion criteria. Third, no samples were collected before
the onset of PE, and the lack of longitudinal follow up may limit the certainty of prognosis of PE from mild
to severe. Finally, larger-scale predictive studies are warranted to replicate our results. Nevertheless, our data
provide new clinical tools that might be implicated in genomic analysis in individualized testing with the wide
availability and the technical ease of ncRNAs measurement. Future work would include establishing a normal
range of the expression levels rather than using fold change to facilitate clinical application.
Conclusion
Our study accentuates miR-17, miR-363 and MALAT-1 as potential new biomarkers for PE and its severity. miR-
363 was associated with early PE and MALAT-1 was associated with severe PE. By functional analysis, miR-17,
miR-363 and MALAT-1 could interplay in PE pathogenesis through common targets and signaling pathways.
Our data appraise the progresses in finding new biomarkers for diagnosing PE and evaluating severity and onset
of PE, and also highlights areas for future research.
Subjects and methods
Patients. This prospective study involved 160 Egyptian pregnant females who received routine obstetric
examination at the Department of Obstetrics and Gynecology, Kasr Al-Ainy hospital, Cairo University. The
study included eligible 82 pregnant females diagnosed with PE and 78 healthy normotensive age-matched preg-
nant women without proteinuria or any complications as the control group.
Full history taking, physical and clinical examination were done for all participants. The medical records of
each participant were revised and all relevant data were used in the study, including information on risk factors,
pregnancy history and perinatal outcome. PE was diagnosed as new-onset of hypertension (SBP ≥ 140 mmHg
and/or DBP ≥ 90 mmHg on at least 2 occasions 4 h apart after the 20th gestational week combined with new-onset
proteinuria according to the guidelines of the American College of Obstetricians and Gynecologists (ACOG
2013)54. Significant protein excretion was defined as ≥ 300 mg protein/24 h-urine sample or ≥ 1+ urine dipstick
testing of two random urine samples collected at least 4 h apart. Blood samples were collected after diagnosis
of PE for preeclamptic women, and from normal pregnant women at admission to the maternity ward at Kasr
Al-Ainy hospital between October 2017 and March 2018. Blood pressure (BP) was measured and PE was diag-
nosed before blood sampling. Patients with PE were subdivided based on severity of clinical symptoms to mild
and severe cases. Severe PE was defined as SBP ≥ 160 mmHg and/or DBP ≥ 110 mmHg on 2 different occasions,
accompanied with proteinuria (≥ 2 g/24 h or ≥ 2+ dipstick) and the presence of persistent headache, epigastric
right upper quadrant abdominal pain, vomiting, elevation of uric acid, increased serum creatinine and liver
enzymes, thrombocytopenia, red cell breakdown, visual impairment, swelling, shortness of breath due to pul-
monary edema and IUGR54. Mild PE was defined as SBP ≥ 140 to 159 or DBP ≥ 90 to 109 mmHg in 2 different
occasions, accompanied with proteinuria (≥ 300 mg to 1.99 g/24 h or ≥ 1+ dipstick)54. Early-onset PE was defined
as developing clinical manifestations of PE at ≤ 34 weeks of gestation whereas cases regarded as late-onset PE if
occurred > 34 gestational weeks10.
BP was measured at admission for controls and PE patients. We expressed gestational weeks as gestational
age (GA) to define the pregnancy weeks using ultrasound imaging for fetal measurements. GA was measured
Scientific Reports | (2022) 12:1249 | https://doi.org/10.1038/s41598-022-05119-9 12
Vol:.(1234567890)www.nature.com/scientificreports/
and recorded for every patient at admission and before blood sampling. IUGR was defined as weight below the
10th percentile for the GA as measured by an ultrasound device. BMI was defined as the body mass divided by
the square of the body height, and was expressed in units of kg/m2. BMI was determined using the mother’s body
weight at the time of inclusion. Blood samples were collected between 20 and 40 weeks of gestation.
Inclusion criteria were pregnant females from 20 to 40 gestational weeks and none of these subjects had any
invasive procedure. Women with pre-existing hypertension, hemostatic abnormalities, cancer, twin pregnancy,
intrauterine fetal death, gestational diabetes, and cardiovascular, autoimmune, renal and hepatic diseases were
excluded.
All participants signed an informed consent and all experiments were approved by the ethical committee of
the Faculty of Pharmacy, Cairo University, Cairo, Egypt (BC2074). All methods were carried out in accordance
with guidelines and regulations in Helsinki declaration.
Sample collection for RNA assay. About 5 mL maternal venous blood was drawn from each partici-
pant by vein puncture and collected in a plain tube. Blood was left to clot at room temperature for 30 min and
then centrifuged at 2000g for 15 min. Sediment- and hemolysis-free supernatants were quickly removed and
aliquoted. Aliquots were immediately frozen at – 80 °C until RNA extraction. For analysis, serum samples were
thawed once on ice and centrifuged at 3000g for 5 min to avoid the presence of any traces of red blood cells and
other cellular debris which could affect the miRNAs and lncRNAs profile.
RNA extraction. Total RNA was isolated from 200 µL serum using the miRNeasy Serum/Plasma kit (Qia-
gen, Germany) following the manufacturer’s instructions. Total RNA concentration and purity were analyzed
using Bioanalyzer Agilent RNA 6000 picoassay. RNA was used for detection of miRNAs and lncRNAs.
miRNAs assay using RT‑qPCR. Briefly, 0.1 μg of total RNA was reverse transcribed using the miScript
II RT kit (Qiagen) in a total 20 µL reaction volume according to the manufacturer’s instructions. The thermal
parameters were 60 min at 37 °C and 5 min at 95 °C. Quantitative real-time PCR was then performed in a total
20 µL reaction volume on Rotorgene Q system (Qiagen) using the miScript SYBR Green PCR kit (Qiagen) and
the provided miScript Universal Primer (reverse primer) and specific primers (forward primers) for hsa-miR-
17-5p, hsa-miR-363-3p as well as SNORD68 as the internal control according to the manufacturer’s instructions.
Briefly, real-time PCR was conducted in 20 µL reaction mixtures where 2.5 μL of appropriately diluted cDNA
template was mixed with 5.5 μL RNase free water, 10 μL miScript SYBR Green PCR Master Mix and 2 μL miS-
cript forward and reverse primers. The PCR thermal conditions were 15 min at 95 °C, 40 cycles of 15 s at 94 °C
followed by 30 s at 55 °C and 30 s at 70 °C.
lncRNAs assay using RT‑qPCR. Reverse transcription (RT) was conducted on 0.1 μg of total RNA in a
20 µL RT reaction with the high capacity cDNA Reverse Transcriptase kit (Applied Biosystems, USA) follow-
ing the manufacturer’s instructions. The thermal cycler conditions were as follows: 10 min at 25 °C, 110 min at
37 °C, and 5 s at 95 °C. Expression levels of HOTAIR and MALAT-1 were evaluated by qPCR using GAPDH
as the housekeeping gene. Customized primers and the Maxima SYBR Green PCR kit (ThermoFischer, USA)
were used to prepare the PCR master mixture following the manufacturer’s protocol. The primer sequences were
HOTAIR-forward 5′-GGTAGAAAAAGCAACCACGAAGC-3′, HOTAIR-reverse 5′-ACATAAACCTCTGTC
TGTGAGTGCC-3′, MALAT-1-forward 5′-AAAGCAAGGT-CTCCCCACAAG-3′, MALAT-1-reverse 5′-GGT
CTGTGCTAGATCAAAAGGCA-3′, GAPDH-forward 5′-GAAGGTCGGAGTCAACGGATT-3′, and GAPDH-
reverse 5′-CGCTCCTGGAAGATGGTGAT-3′. Primer specificity was checked using the NCBI Primer-BLAST
tool (https://www.ncbi.nlm.nih.gov/tools/primer-blast/). Real-time PCR was performed on Rotorgene Q system
(Qiagen) in 20 µL reaction mixtures with the following conditions: 95 °C for 10 min, followed by 40 cycles at
95 °C for 15 s and 60 °C for 60 s.
Expression analysis of miRNAs and lncRNAs relative to internal control were done using
2−ΔCt method, where ΔCt = Ctgene − Ctinternal control. Fold change was calculated with the formula 2−∆∆Ct, where
∆∆Ct = ΔCtpatient − ΔCtcontrol group.
Selection of lncRNAs and miRNAs using bioinformatics analysis. Selection of PE‑associated lncR‑
NAs. We used the lncRNA disease database (http://www.cuilab.cn/lncrnadisease) to screen for PE-associat-
ed lncRNAs. Seven candidate lncRNAs were revealed (H19, MALAT-1, HOTAIR, LOC391533, LOC284100,
CEACAMP8 and SPRY4-IT1) (Supplementary Table S1). Using PubMed search (http://www.ncbi.nlm.nih.gov/
pubmed/), MALAT-1 and HOTAIR were selected for this study based on their biological relevance to P E13,14.
Selection of PE‑associated miRNAs. PE-associated miRNAs were screened using the Human microRNA Dis-
ease Database (HMDD) v3.2 (https://www.cuilab.cn/hmdd). More than 95 different miRNAs were recorded in
relation with PE. Members of miR-17-92 family, namely miR-17, miR-18a and miR-20a and members of its par-
alog 106a-363 cluster, namely miR-106a, miR-18b, miR-20b and miR-363 were PE candidates (Supplementary
Table S2).
miRNA‑lncRNA interaction analysis. The starBase platform (http://starbase.sysu.edu.cn/) was used
to check the interaction between candidate miRNAs and the lncRNAs; MALAT-1 and HOTAIR. Some of the
results are shown in supplementary Table S3. The database reported interactions of HOTAIR with miR-17-5p,
miR-20a-5p, miR-20b-5p and miR-106a-5p as well as interactions of MALAT-1 with miR-17-5p, miR-20a-5p,
Scientific Reports | (2022) 12:1249 | https://doi.org/10.1038/s41598-022-05119-9 13
Vol.:(0123456789)www.nature.com/scientificreports/
miR-363-3p, miR-20b-5p and miR-106a-5p. To filter these data, we searched the PubMed for experimentally
validated lncRNA-miRNAs interactions. We found previously reported direct interactions between MALAT-1
and miR-17-5p17, MALAT-1 and miR-363-3p55, and HOTAIR and miR-17-5p18 based on a reporter assay. Thus,
MALAT-1, HOTAIR, miR-17-5p and miR-363-3p were selected for this study.
Target gene analysis and construction of protein–protein interaction networks. For miRNAs,
the online databases, TargetScan (http://www.targetscan.org/vert_72/) and miRDB (http://mirdb.org/), were
used to find the predicted target genes for the miR-17 and miR-363. For lncRNAs, the starBase platform (http://
starbase.sysu.edu.cn/) was used to screen the candidate lncRNA-RNA interactions. We filtered the output by
selecting protein-coding genes.
Target genes were then analyzed using CapitalBio Molecule Annotation System 3.0 software to determine
the biological roles of the lncRNA and miRNA-target protein-coding genes. Finally, the genes most related to PE
pathogenesis in terms of biological process, molecular function and KEGG pathways were selected. The cutoff
P value was 0.05.
We analyzed the relationships between the proteins (protein–protein interaction, PPI) encoded by the genes
related to the selected ncRNAs (miR-17, miR-363 and MALAT-1) using STRING online software. We also used
the STRING online software to conduct functional enrichments; GO and KEGG pathways to determine the
involvement of each PPI in different biological pathways related to PE. The Pathway Studio Online Software was
used to visualize the PPI network related to each selected placental-related ncRNA.
Statistical analysis. Values are presented as mean ± SD, median (25%–75% percentiles), or number (per-
centage) when appropriate. Shapiro Wilk and Klomogrov Simirnov normality tests were used to check data
normality. Data were compared using the parametric Student’s t test or the non-parametric Mann—Whitney
U test when appropriate. The examined miRNAs, lncRNAs and CRP data were not normally distributed and
their levels were compared by applying the Mann—Whitney U test. Fischer exact test was used to compare the
categorical data. Receiver-operating-characteristic (ROC) analysis was carried out to evaluate the diagnostic and
prognostic accuracy of molecular data. Area under the curve (AUC) < 0.6 was considered as non-significant,
AUC ≥ 0.6 and < 0.7 as significant discriminator, AUC ≥ 0.7 and < 0.9 as potential discriminator, and AUC ≥ 0.9 as
excellent discriminator. The associations between the biomarkers, early PE risk and PE severity were investigated
using univariate followed by stepwise forward multivariate logistic regression analyses. Correlations between
parameters were identified using Spearman correlation. Statistical significance was considered at P < 0.05. Statis-
tical analyses were carried out using SPSS software v15 for Microsoft Windows (SPSS, Chicago, IL) and Graph-
Pad Prism 7.0 (GraphPad Software, CA, USA).
Ethics approval. (a) All experiments were approved by the ethical committee of the Faculty of Pharmacy,
Cairo University, Cairo, Egypt (BC2074). (b) All methods were carried out in accordance with guidelines and
regulations in Helsinki declaration.
Data availability
The data that supports the findings of this study are available in the manuscript and in the supplementary mate-
rial of this article.
Received: 24 April 2021; Accepted: 16 December 2021
References
1. Mayrink, J., Costa, M. L. & Cecatti, J. G. Preeclampsia in 2018: Revisiting concepts, physiopathology and prediction. Sci. World J.
2018, 6268276 (2018).
2. Kaaja, R. J. & Greer, I. A. Manifestations of chronic disease during pregnancy. JAMA 294, 2751–2757 (2005).
3. Mosca, L. et al. Effectiveness-based guidelines for the prevention of cardiovascular disease in women-2011 update: A guideline
from the American Heart Association. Circulation 123, 1243–1262 (2011).
4. Young, B. C., Levine, R. J. & Karumanchi, S. A. Pathogenesis of preeclampsia. Annu. Rev. Pathol. 5, 173–192 (2010).
5. Bounds, K. R., Chiasson, V. L., Pan, L. J., Gupta, S. & Chatterjee, P. MicroRNAs: New players in the pathobiology of preeclampsia.
Front. Cardiovasc. Med. 4, 60 (2017).
6. McAninch, D., Roberts, C. T. & Bianco-Miotto, T. Mechanistic insight into long noncoding RNAs and the placenta. Int. J. Mol. Sci.
18, 1731 (2017).
7. Sandrim, V. C., Luizon, M. R., Palei, A. C., Tanus-Santos, J. E. & Cavallie, R. C. Circulating microRNA expression profiles in pre-
eclampsia: Evidence of increased miR-885-5p levels. BJOG. Int. J. Obstet. Gynaecol. 123, 2120–2128 (2016).
8. He, X. et al. LncRNAs expression in preeclampsia placenta reveals the potential role of lncRNAs contributing to preeclampsia
pathogenesis. PLoS ONE 8, 1–6 (2013).
9. Xu, P. et al. Variations of microRNAs in human placentas and plasma from preeclamptic pregnancy. Hypertension 63, 1276–1284
(2014).
10. Luque, A. et al. Usefulness of circulating microRNAs for the prediction of early preeclampsia at first-trimester of pregnancy. Sci.
Rep. 4, 1–8 (2014).
11. Wang, W. et al. Preeclampsia up-regulates angiogenesis-associated microRNA (i.e., miR-17, -20a, and -20b) that target ephrin-B2
and EPHB4 in human placenta. J. Clin. Endocrinol. Metab. 97, 1051–1059 (2012).
12. Kumar, P., Luo, Y., Tudela, C., Alexander, J. M. & Mendelson, C. R. The c-Myc-regulated microRNA-17∼92 (miR-17∼92) and
miR-106a∼363 clusters target hCYP19A1 and hGCM1 to inhibit human trophoblast differentiation. Mol. Cell Biol. 33, 1782–1796
(2013).
13. Chen, H. et al. Long non-coding RNA MALAT-1 is downregulated in preeclampsia and regulates proliferation, apoptosis, migra-
tion and invasion of JEG-3 trophoblast cells. Int. J. Clin. Exp. Pathol. 8, 12718–12727 (2015).
Scientific Reports | (2022) 12:1249 | https://doi.org/10.1038/s41598-022-05119-9 14
Vol:.(1234567890)You can also read