Thyroid Gland Alterations in Old-Aged Wistar Rats: A Comprehensive Stereological, Ultrastructural, Hormonal, and Gene Expression Study
←
→
Page content transcription
If your browser does not render page correctly, please read the page content below
Microscopy and Microanalysis (2021), 27, 437–449
        doi:10.1017/S1431927621000064

        Original Article

        Thyroid Gland Alterations in Old-Aged Wistar Rats: A Comprehensive
        Stereological, Ultrastructural, Hormonal, and Gene Expression Study
        Marko Miler1*, Vladimir Ajdžanović1, Jasmina Živanović1, Jelena Marković Filipović2, Branka Šošić-Jurjević1
        and Verica Milošević1
        1
          Department of Cytology, Institute for Biological Research “Siniša Stanković” – National Institute of the Republic of Serbia, University of Belgrade, Belgrade, Serbia
        and 2Faculty of Sciences, Department of Biology and Ecology, University of Novi Sad, Novi Sad, Serbia

        Abstract
        The aim of the present study was to determine and elaborate on all changes in old-aged (OA) versus young-aged (YA) rat thyroids by using
        stereological, ultrastructural, hormonal, and gene expression analyses. We used 4- and 24-month-old male Wistar rats in our evaluation,
        presenting all changes in comparison with YA rats. Results showed that the thyroid parenchyma was characterized by higher absolute
        volumes of the gland, colloid, epithelium, and interstitium by 135, 135, 140, and 142% ( p < 0.05) respectively, while the relative volumes
        of colloid and glands were unchanged. Ultrastructural analysis revealed less active glands, with smaller amounts of lysosomes, thyroglobulin
        (Tg) granules, and microvilli in the luminal colloid. Optical density values for thyroid peroxidase (TPO), Tg, and vascular-endothelial
        growth factor immunostaining remained unchanged; however, TPO and Tg exhibited visually stronger expression in small active follicles.
        Thyroxine (T4)-Tg, the relative intensity of fluorescence (RIF), serum T4, and the sodium-iodide symporter immunohistochemical and gene
        expressions decreased by 20, 40, 29, and 31% ( p < 0.05), respectively, in OA thyroids. Pituitary thyroid-stimulating hormone (TSH) RIF
        increased by 44% ( p < 0.05), but the TSH serum concentration remained unchanged. In conclusion, the obtained results indicate depression
        of the thyroid gland synthetic and secretory capacity with advanced age.
        Key words: NIS, T4-Tg, Tg, TPO, TSH
        (Received 16 October 2020; revised 15 January 2021; accepted 24 January 2021)

        Introduction                                                                                showed changes in the thyroid gland relative volume (Mariotti
                                                                                                    et al., 1995; Moreira et al., 2005); however, data on the respective
        Aging is characterized by a progressive loss of physiological integ-
                                                                                                    structural and functional alterations in old Wistar rats is lacking.
        rity at the whole-body level. It leads to a decline in endocrine func-
                                                                                                        Structural analysis on its own is not sufficient to profile the
        tion inducing somatopause, andropause, and menopause (Chahal
                                                                                                    degree of thyroid activity and should be expanded to include a
        & Drake, 2007; Ajdžanović et al., 2018). In humans, the thyroid
                                                                                                    wider morpho-functional characterization of thyroid tissue. We
        axis is characterized by normal thyroxine (T4) and normal or
                                                                                                    validated a battery of tests using thyroid-specific proteins—
        slightly elevated thyroid-stimulating hormone (TSH) levels
                                                                                                    thyroid peroxidase (TPO), thyroglobulin (Tg), T4 bound to Tg
        (Barbesino, 2019). In rats, however, the situation is different, show-
                                                                                                    (T4-Tg), and the sodium-iodide symporter (NIS)—which provide
        ing normal TSH and lower serum T4 concentrations with advanced
                                                                                                    valuable additional information on thyroid functioning only from
        age (Donda & Lemarchand-Beraud, 1989; Silvestri et al., 2008).
                                                                                                    a structural point of view. Namely, the thyroid gland imports
            Although the first-choice medical examination method for the
                                                                                                    iodide, an essential element in TH production, throughout the
        endocrine system is administering a hormone panel test, in scien-
                                                                                                    NIS on the basolateral membrane of the follicular epithelium.
        tific/research examination, valuable data can be obtained from a
                                                                                                    Extremely reactive iodide is kept under control by a strong
        structural evaluation of endocrine tissues. Structural parameters
                                                                                                    antioxidant defense system in the thyrocyte cytoplasm (Song
        of the thyroid parenchyma mostly correlate with the activity of
                                                                                                    et al., 2007). Later on, hormone production starts on the border
        the thyroid hormone generating system. Namely, a depleted
                                                                                                    between the follicular epithelial apical membrane and colloid,
        colloid and higher follicular epithelium suggest an active gland,
                                                                                                    where TPO localized in the apical membrane (Kotani & Ohtaki,
        more precisely, a higher demand for thyroid hormones (TH) and
                                                                                                    1987; Fayadat et al., 1998) oxidizes iodide to iodine and incorpo-
        vice versa. Reports on Miranda and Sprague–Dawley aging rats
                                                                                                    rates it in the tyrosine residues on Tg (Dunn & Dunn, 2001). TSH
                                                                                                    stimulation leads both to increased synthesis and secretion of TH.
           *Author for correspondence: Marko Miler, E-mail: marko.miler@ibiss.bg.ac.rs                  By an up-to-date screening of the Pubmed database using the
           Cite this article: Miler M, Ajdžanović V, Živanović J, Marković Filipović J, Šošić-
                                                                                                    keywords thyroid, aging, and rats, we listed only a few papers on
        Jurjević B, Milošević V (2021) Thyroid Gland Alterations in Old-Aged Wistar Rats: A
        Comprehensive Stereological, Ultrastructural, Hormonal, and Gene Expression Study.          structural characteristics, as compared with a huge number of
        Microsc Microanal 27, 437–449. doi:10.1017/S1431927621000064                                articles dealing with hormonal or molecular biology data (data
        © The Author(s), 2021. Published by Cambridge University Press on behalf of the Microscopy Society of America. This is an Open Access article, distributed under the terms of the
        Creative Commons Attribution licence (http://creativecommons.org/licenses/by/4.0/), which permits unrestricted re-use, distribution, and reproduction in any medium, provided the
        original work is properly cited.

Downloaded from https://www.cambridge.org/core. IP address: 46.4.80.155, on 30 Sep 2021 at 08:49:26, subject to the Cambridge Core terms of use, available at
https://www.cambridge.org/core/terms. https://doi.org/10.1017/S1431927621000064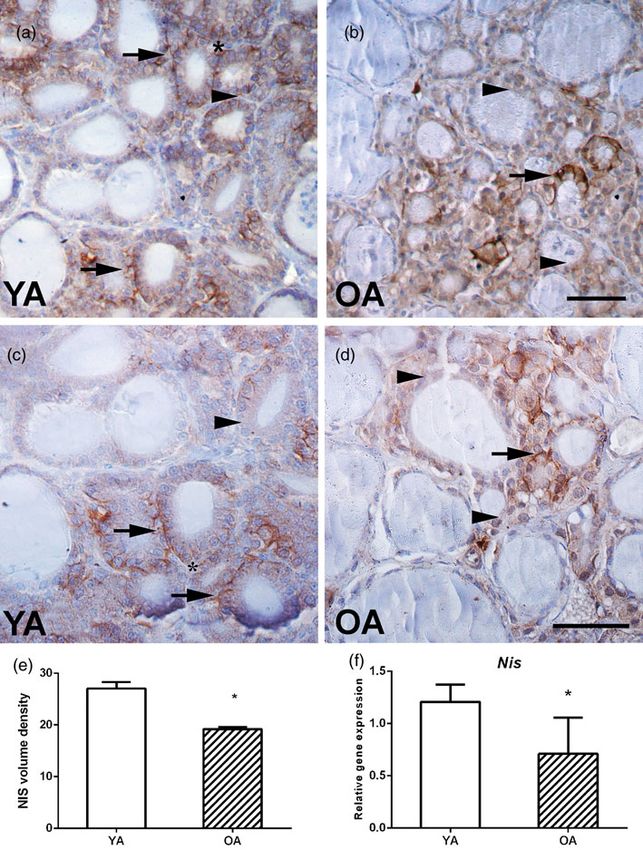
438                                                                                                                                                      Marko Miler et al.

       not shown). Histological analysis is often neglected due to the                           Stereological Analysis
       long period needed for obtaining results, but it represents a valu-
                                                                                                 Stereological measurements were performed on the H&E-stained
       able tool for identifying structural alterations. Keeping in mind
                                                                                                 thyroid sections, as previously reported by our group (Miler et al.,
       that experiments on aged animals are on the rise, the structural
                                                                                                 2014, 2017). In brief, the measurements were carried out using a
       aspect of the study may be a hot topic in current research.
                                                                                                 newCAST stereological software package (VIS—Visiopharm
           Therefore, we aimed to determine and elaborate all stereolog-
                                                                                                 Integrator System, version 3.2.7.0; Visiopharm; Denmark). Total
       ical and ultrastructural, as well as hormonal and gene expression
                                                                                                 thyroid volumes (mm3), as well as the total volume of thyroid tis-
       data, in the light of establishing a legitimate way to investigate
                                                                                                 sue phases (epithelium, interstitium, and colloid; mm3), were
       alterations in the old thyroid gland. Our results will help in
                                                                                                 determined using Cavalieri’s principle (Gundersen & Jensen,
       understanding the thyroid gland structural and functional alter-
                                                                                                 1987). Thyroid volume (Vpt) is then estimated as
       ations with advanced age and also provide a novel experimental
       model that could be adequately exploited and used in further
                                                                                                                                                    n
                                                                                                                           _
       experiments.                                                                                                        V pt = a(p) · BA ·             Pi,
                                                                                                                                                    i=1

       Material and Methods                                                                      where a( p) is the area associated with each sampling point
       Experimental Animals                                                                      (208,878.02 m2), BA is the block advance representing the mean
                                                                                                 distance between two consecutively studied sections (150 μm), n
       The male Wistar rats (4- and 24-month-old) used in the experi-                            is the number of sections studied for each thyroid, and ΣPi is
       ment were bred and housed in the Unit for Experimental                                    the sum of points hitting a given target (Dorph-Petersen et al.,
       Animals at the Institute for Biological Research "Siniša                                  2001). The same sections were used for the estimation of total
       Stanković” – National Institute of the Republic of Serbia                                 thyroid volumes as well as the volumes of thyroid tissue phases:
       (IBISS), Belgrade, Serbia. All animals were kept under constant                           follicular epithelium, interstitium, and colloid. The number of
       lighting (12 h light–12 h dark) and temperature (21 ± 2°C) condi-                         analyzed thyroids was five per group. Volume density estimation
       tions and had access to food and water ad libitum. All animal                             was used to determine the percentage of follicular epithelium,
       procedures were in compliance with the Directive 2010/63/EU                               interstitium, and colloid. Four to five transversal sections from
       on the protection of animals used for experimental and other                              the anterior, central, and posterior parts of the thyroid (n = 5)
       scientific purposes and were approved by the Ethical Committee                            were analyzed at an objective magnification of ×20. Relative vol-
       for the Use of Laboratory Animals of IBISS, University of                                 ume densities (VV) are calculated as the ratio of the number of
       Belgrade (No 2-12/12).                                                                    points hitting each tissue phase divided by the number of points
                                                                                                 hitting the reference space, that is, analyzed thyroid section: VV
       Sample Processing                                                                         (%) = Pp/Pt × 100 (Pp, counted points hitting the tissue phase,
                                                                                                 Pt, the total of points of the test system hitting the reference
       Animals were decapitated without anesthesia, in order to avoid                            space). Volume density was calculated for each tissue phase per
       any anesthesia effects on the biochemical and gene expression                             analyzed section. Then, the average value for all analyzed sections
       results. Every effort was made to minimize the suffering of the                           was calculated (for each phase separately), representing the rela-
       experimental animals. Blood was collected from the trunk, and                             tive volume density of the epithelium, interstitium, and colloid.
       a separated serum of all the animals was stored at the same                               An additional investigator from the field confirmed the findings
       time at −80°C. The animals’ pituitary and thyroid glands (one                             upon independent analysis.
       lobe, including part of the trachea) were excised, fixed in 4% para-
       formaldehyde solution for 24 h, dehydrated in increasing concen-
       trations of ethanol (30–100%) and enlightened in xylene. After                            Ultrastructural Analysis
       embedding in Histowax® (Histolab Product AB, Göteborg,                                    For the ultrastructural analysis, the thyroid lobe was removed
       Sweden), each tissue block was serially sectioned at a thickness                          from two animals per group and processed as previously
       of 3 μm for pituitaries and 5 μm for thyroids on a rotary micro-                          described (Živanović et al., 2019). The thyroid lobe was sliced
       tome (RM 2125RT Leica Microsystems, Wetzlar, Germany). The                                in 4% glutaraldehyde solution in 100 mM phosphate buffer, pH
       second thyroid lobe was snap frozen in liquid nitrogen and stored                         7.4, for 24 h. Postfixation was carried with 1% OsO4 for 1 h at
       at –80°C for further gene expression analysis. All samples from                           4 °C, and counterstaining with uranyl acetate. Samples were dehy-
       both YA and OA groups were processed simultaneously.                                      drated through a graded series of ethanol and embedded in
                                                                                                 Araldite resin. A Leica EM UC7 ultramicrotome (Leica,
                                                                                                 Germany) with a Diatome ultra 45° diamond knife (Diatome,
       Histological Analysis
                                                                                                 Switzerland) was used for cutting ultrathin sections of thyroid tis-
       Thyroid sections for the quantitative histological analyses were                          sue at a thickness of 70 nm. Grids with ultrathin sections were
       stained by routine hematoxylin and eosin (H&E) and Masson tri-                            stained with uranyl acetate and lead citrate and examined under
       chrome staining according to a previously published procedure                             a Morgagni 268 (FEI Company, Eindhoven, The Netherlands)
       (Miler et al., 2017; Ajdžanović et al., 2020). Regarding the light                        transmission electron microscope.
       microscopy analysis, all digital images of the thyroid sections
       were made on a LEITZ DM RB Photomicroscope (Leica
                                                                                                 Immunohistochemistry and Immunofluorescence
       Mikroskopie & Systems GmbH, Wetzlar, Germany), with a Leica
       DFC 320 CCD Camera (Leica Microsystems Ltd., Heerbrugg,                                   Representative thyroids sections were immunohistochemically
       Switzerland) and LeicaDFC Twain Software (Leica, Germany) for                             (IHC) stained, while representative pituitary and the remaining
       image acquisition and analysis.                                                           thyroid sections were immunofluorescently (IF) stained according

Downloaded from https://www.cambridge.org/core. IP address: 46.4.80.155, on 30 Sep 2021 at 08:49:26, subject to the Cambridge Core terms of use, available at https://www.cambridge.org/core/terms
. https://doi.org/10.1017/S1431927621000064
Microscopy and Microanalysis                                                                                                                                               439

        Table 1. List of Antibodies Used in Immunohistochemical (IHC) and Immunofluorescent (IF) Analysis.

                               Name                                           Cat. Number                   Origin                  Dilution                 Manufacturer

           Primary antibodies used
           IHC                 TPO                                            sc-376876                     Mouse                   1:400                    Santa Cruz, Italy
                               Tg                                             A0251                         Rabbit                  1:500                    Dako, Denmark
                               NIS                                            EUD4101                       Rabbit                  1:1,200                  Acris, Germany
                               VEGF                                           ab46154                       Rabbit                  1:100                    Abcam, UK
           IF                  TSH                                            AFP-1274789                   Rabbit                  1:1,000                  Bethesda, MD, USA
                               T4-Tg                                          12102                         Mouse                   1:300                    Bioscience, USA
           Secondary antibodies used
           IHC                 Anti-mouse, HRP labeled                        Ab6820                        Donkey                  1:100                    Abcam, UK
                               Anti-rabbit, HRP labeled                       P0399                         Swine                   1:100                    Dako, Denmark
           IF                  Anti-mouse, Alexa Fluor 488                    A-21202                       Donkey                  1:500                    Thermofisher, CA, USA

        to previously described procedures (Miler et al., 2014, 2017, 2020;                           The rabbit antisera, directed against human T4 bound to thyro-
        Šošić-Jurjević et al., 2015).                                                             globulin, were applied overnight at 4°C. Alexa Fluor 488 was
                                                                                                  applied as a secondary antibody. The sections were subsequently
        Immunohistochemical Analysis                                                              washed in PBS five times for 5 min. Afterward, the sections were
        After tissue deparaffinization, endogenous peroxidase activity was                        incubated with RNase A (10 μg/mL; Thermo Fisher Scientific
        blocked by incubation of sections with 0.3% hydrogen peroxide in                          Inc., Rockford, IL, USA) for 20 min at 37°C, and the nuclei were
        methanol for 15 min. Then, thyroid sections were exposed to                               counterstained with propidium iodide (diluted in 2× saline sodium
        heat-induced antigen retrieval to unmask target antigens. Slides                          citrate buffer, SSC, 1:300) for 1.5 min. Sections were washed three
        were placed in a container, covered with 100 mM sodium citrate                            times for 1 min in 2× SSC buffer and one time for 5 min in PBS
        buffer (pH 6.0), and heated at 750 W in a microwave oven for                              and coverslipped with Mowiol 4–88 (Sigma-AldrichCo., St. Louis,
        10 and 5 min, respectively. The reduction of nonspecific back-                            MO, USA). Images were obtained using a confocal laser scanning
        ground staining was achieved by incubation with normal porcine                            microscope Olympus FV10-ASW (Olympus FLUOVIEWFV1000;
        serum (Dakopatts, Glostrup, Denmark) diluted 1:10 for 45 min.                             Germany). Ar-ion (488 nm) and HeNe (543 nm) lasers were
            For a functional IHC analysis, the antisera directed against                          used for excitation of fluorescence.
        TPO, Tg, NIS, and vascular-endothelial growth factor (VEGF)
        were applied overnight at 4°C. For the negative control thyroid
                                                                                                  Quantitative Image Analysis
        sections, the primary antibody was substituted with phosphate-
        buffered saline (PBS).                                                                    Quantification of IHC Signal
            For the immunodetection of TPO, Tg, NIS, and VEGF pro-                                The stained percentage color area for the DAB immunopositive
        teins, secondary antibodies (HRP labeled) were applied for 1 h.                           follicles of TPO, Tg, and VEGF was evaluated using a Windows
        Visualization was performed using the Dako liquid diaminoben-                             based ImageJ (Image J, Version 1.49j) plugin named the IHC pro-
        zidine tetrahydrochloride substrate chromogen system (Dako                                filer according to previously described procedures (Ajdžanović
        North America, Inc. Carpinteria, CA, USA) at concentrations                               et al., 2016; Miler et al., 2017). For the analysis of DAB immuno-
        suggested by the manufacturer. All washes and dilutions were                              positive follicles, 10 randomly captured images (the Leica light
        done using 100 mM PBS pH 7.4. Hematoxylin was used as                                     microscopic tool has already been described; 2088 × 1550 pixels,
        counterstain and slides were mounted in a DPX medium                                      ×10 objective magnification) per thyroid tissue per animal were
        (Sigma-Aldrich, Barcelona, Spain).                                                        analyzed.

        Immunofluorescent Analysis                                                                Quantification of IF Signal
        For the IF analysis of pituitary and thyroid sections, the reduction                      The analysis of TSH RIF signal was performed as previously
        of nonspecific background staining was achieved by incubation                             reported by our group (Miler et al., 2020). An analysis of confocal
        with normal donkey serum (Abcam, Cambridge, MA, USA),                                     microscopy images was done using the quantify option in the LAS
        diluted 1:10 for 30 min. Primary anti-TSHβ antibody was applied                           AF Lite software (Leica Application Suite Advanced Fluorescence
        on pituitary sections overnight at room temperature (RT).                                 Lite/1.7.0 build 1240, Leica Microsystems CMS GmbH; Germany).
        Secondary antibody Alexa Fluor 488 was applied for 1 h at RT.                                The regions of interest were encircled with freeform drawing tools
        The list of used antibodies is shown in Table 1. The sections                             and included the intense spots of the TSHβ-immunopositive gran-
        were then washed in PBS with 0.1% Tween 20 five times for                                 ules within the cytoplasm of pituitary thyrotrophs. Two different
        5 min and coverslipped with Mowiol 4–88 (Sigma-Aldrich Co.,                               immunonegative spots outside of the TSHβ-immunopositive thyro-
        St. Louis, MO, USA). Images were obtained using a confocal                                trophs served as referent particles for the definition of background
        laser scanning microscope Leica TCS SP5 II Basic (Leica                                   fluorescence. The mean of the two measurements was calculated
        Microsystems CMS GmbH; Germany). An Ar-ion 488-nm laser                                   and then used for relative intensity of fluorescence (RIF) determina-
        was used for excitation of fluorescence.                                                  tion. To calculate the RIF, the determined average of mean value was

Downloaded from https://www.cambridge.org/core. IP address: 46.4.80.155, on 30 Sep 2021 at 08:49:26, subject to the Cambridge Core terms of use, available at https://www.cambridge.org/core/terms
. https://doi.org/10.1017/S1431927621000064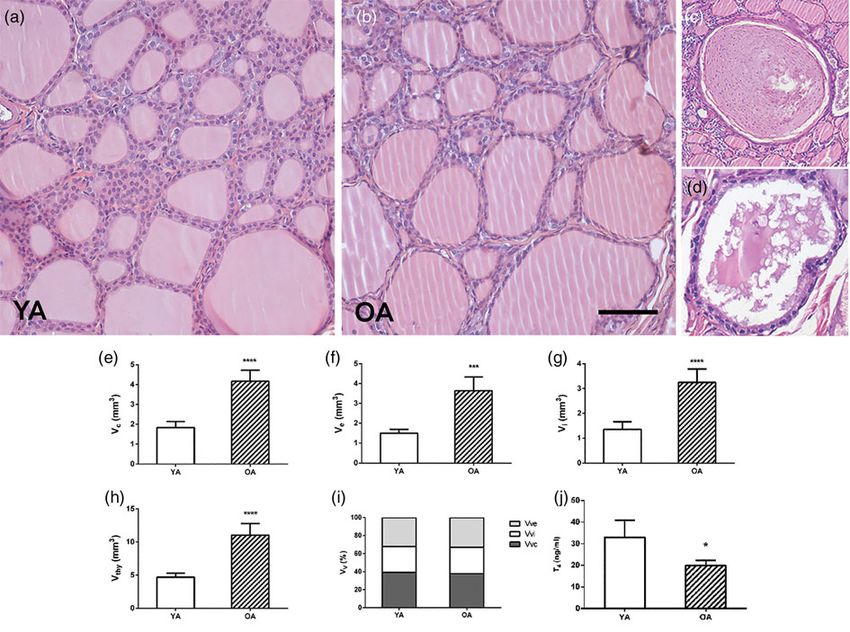
440                                                                                                                                                      Marko Miler et al.

       subtracted from the average of background fluorescence. The inten-                        Table 2. List of Primers Used in Real-Time PCR Analysis.
       sity of fluorescence was determined in 200 pituitary thyrotrophs per
                                                                                                   Gene                                    Primer Sequence
       animal, and in three animals per group in which the cell nuclei were
       apparent.                                                                                   Tpo                                     f: 5′ -TTGGATCTGGCATCACTGAACTT-3′
           The measurement of T4-Tg RIF was achieved using the ImageJ                                                                      r: 5′ -ATCTTGTTGACCATGCTTCTGTTG-3′
       software (Image J, Version 1.49j) according to our previous work                            Tg                                      f: 5′ -CCGGATATTGCAGAGACGAT-3′
       (Šošić-Jurjević et al., 2014; Miler et al., 2017). In brief, thyroid                                                                r: 5′ -GGCAGCTTGGGATATATGGA-3′
       T4-Tg IF-stained follicles were encircled with a freeform drawing
                                                                                                   Nis                                     f: 5′ -GGTGTCATCAGTGGGCCTCTA-3′
       tool, measuring the integrated density (ID) of 50 immunopositive                                                                    r: 5′ -CCCGTGTCCATTCCAGAACTG-3′
       follicles per thyroid tissue per animal. Three other immunonegative
       spots in proximity to the IF-stained follicles were also rounded for                        Sod1                                    f: 5′ -AAGCGGTGAACCAGTTGTG-3′
                                                                                                                                           r: 5′ -CCAGGTCTCCAACATGCC-3′
       the measurement of the mean fluorescence of background readings
       (MB). RIF was calculated using the formula: RIF = ID − (CA × MB),                           Sod2                                    f: 5′ -GGTGGAGAACCCAAAGGAGA-3′
                                                                                                                                           r: 5′ -AGCAGTGGAATAAGGCCTGT-3′
       where CA represents the area of selected follicles.
                                                                                                   Cat                                     f: 5′ -CCAGCGACCAGATGAAGCA-3′
                                                                                                                                           r: 5′ -TGGTCAGGACATCGGGTTTC-3′
       Quantification of NIS Relative Volume Density                                               Gpx                                     f: 5′ -TATAGAAGCCCTGCTGTCCA-3′
       The relative volume density of the NIS-immunopositive epithe-                                                                       r: 5′ -CAAGCCCAGATACCAGGAA-3′
       lium was quantified at 10× magnification with a 4 × 4 generated                             Gr                                      f: 5′ -ACGAGGAAGACGAAATGCGTGATG-3′
       grid. VV NIS-immunopositive epithelium was defined as the                                                                           r: 5′ -AGGATGAATGGCGA CGCTATTGTC-3′
       relative ratio of the sum of hits falling on the basolateral mem-
                                                                                                   Nrf2                                    f: 5′ -GAGCGGGAGAAATCACACAGAATG-3′
       brane and cytoplasm and the sum of hits falling on the epithe-                                                                      r: 5′ -CAGGAGCTGCATGCACTCATCG-3′
       lium, interstitium, and colloid, that is, the relative volume of the
                                                                                                   Gapdh                                   f: 5′ -GTGGACCTCATGGCCTACAT-3′
       thyroid glands. Values are multiplied by 100 and expressed as
                                                                                                                                           r: 5′ -GGATGGAATTGTGAGGGAGA-3′
       percentages (%).

                                                                                                 Table 3. Absolute Mass and Relative Weight of Thyroid in Young (YA) and old
       Hormonal Analysis                                                                         Animals (OA).

       The serum was separated from trunk blood after decapitation and                                                                                       Relative Thyroid
       left at room temperature for 2 h, after which it was stored at −70°C.                                       Body             Absolute Thyroid         Weight (mg x 100/
       The serum levels of TSH and total T4 were measured by enzyme-                               Groups          Mass (g)         Weight (mg)              b.m.)
       linked immunosorbent assay (ELISA) using a rat TSH kit (IBL
                                                                                                   YA              470 ± 39         11.3 ± 1.3               2.2 ± 0.2
       International GmbH, Hamburg, Germany) and a T4 kit provided
       by Cusabio Biotech Co. Ltd (Wuhan, Hubei, China). All samples                               OA              697 ± 45         20.2 ± 3.1               2.6 ± 0.6
       were assayed in duplicate together in one run with an intra-assay                         Results are expressed as means ± SD, n = 6.
       coefficient of variation of 8.8% (measuring range 10–320 ng/mL)
       for TSH and < 15% (measuring range 0.85–3.23 ng/mL) for T4.
                                                                                                 Statistical Analyses
                                                                                                 Statistical analyses of all the obtained results were performed
       RNA Isolation, cDNA Transcription, and Real-Time PCR                                      using GraphPad Prism v.6 for Windows (San Diego, CA, USA).
                                                                                                 The data for the experimental groups were first tested for normal-
       A total RNA from thyroids was isolated using TRIzol (Invitrogen,
                                                                                                 ity of distribution with the Kolmogorov–Smirnov test. After the
       Carlsbad, CA) and further purified using the RNeasy mini-kit
                                                                                                 confirmation of Gaussian distribution and the homogeneity of
       (QIAGEN, Hilden, Germany) following the manufacturer’s
                                                                                                 variance with Bartlett’s test, unpaired Student’s t-test was used
       instructions. cDNA was synthesized using the High Capacity
                                                                                                 to evaluate differences between the groups. A confidence level
       cDNA Reverse Transcription Kit (Applied Biosystems, Vilnius,
                                                                                                 of p < 0.05 was considered statistically significant. The data are
       Lithuania) with 500 ng of RNA. PCR amplifications of cDNAs
                                                                                                 presented as means ± SD.
       were performed in a real-time PCR machine ABI Prism 7000
       (Applied Biosystems, USA) with SYBRGreen PCR master mix
       (Applied Biosystems, USA). The program included the following                             Results
       conditions: 3 min at 95°C, followed by 40 cycles of 15 s at 95°C,
                                                                                                 Body Mass and Absolute and Relative Thyroid Weight
       30 s at 60°C, and 30 s at 72°C. The list of primers used is shown
       in Table 2. Melting curve analysis was used to confirm gene-specific                      Body mass and absolute thyroid weight expectedly increased in
       amplification. Nuclease-free water was used as negative control                           OA group by 47 and 78% ( p < 0.05; Table 3) respectively, in com-
       instead of the cDNA template. The expression level of each gene                           parison with YA, while the relative thyroid weight remained
       was calculated using the formula 2−(ΔΔCtexp−ΔΔCtcontrol ), where                          unchanged (Table 3).
       ΔCt is the difference between the cycle threshold value of the
       gene of interest and the cycle threshold value of Gapdh as a
                                                                                                 Histological and Stereological Results
       reference gene. All the data were calculated from duplicate reac-
       tions. RNA data are presented as average relative levels versus                           The thyroid parenchyma of both YA and OA groups were
       Gapdh ± SD.                                                                               characterized by variability in the size of follicles and the

Downloaded from https://www.cambridge.org/core. IP address: 46.4.80.155, on 30 Sep 2021 at 08:49:26, subject to the Cambridge Core terms of use, available at https://www.cambridge.org/core/terms
. https://doi.org/10.1017/S1431927621000064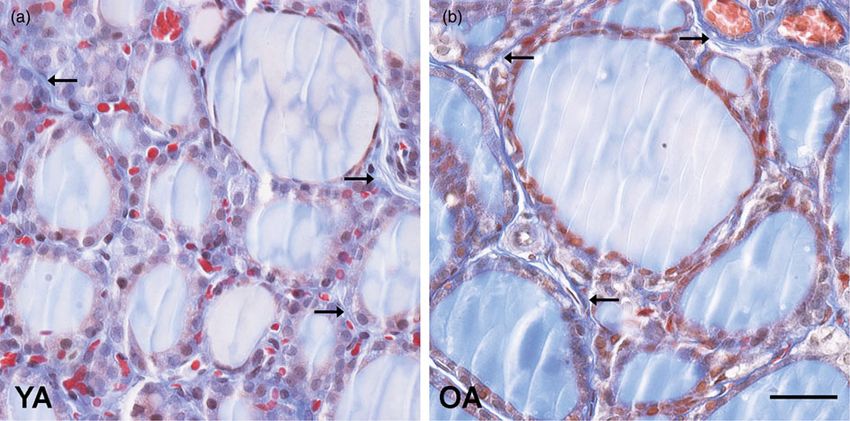
Microscopy and Microanalysis                                                                                                                                                441

        Fig. 1. Representative micrographs of hematoxylin and eosin-stained thyroid sections of (a) young- (YA) and (b) old-aged (OA) male Wistar rats. 20× magnification,
        bar = 50 μm. Representative micrographs of atrophic cysts: (c) follicular and (d) ultimobranchial. Absolute volume densities (V, mm3) of (e) epithelium, (f) intersti-
        tium, (g) colloid, and (h) thyroid gland. (i) Relative volume density (Vv; %) of thyroid phases. All the values are presented as mean ± SD (n = 5); statistics: Student’s
        t-test, *p < 0.05. ( j) Serum level of T4 (ng/mL). All the values are presented as mean ± SD (n = 6); statistics: Student’s t-test, *p < 0.05.

        Fig. 2. Representative micrographs of Masson trichromatic-stained thyroid sections of (a) young- (YA) and (b) old-aged (OA) male Wistar rats. Arrows show collagen
        fibers. 40× magnification, bar = 25 μm.

Downloaded from https://www.cambridge.org/core. IP address: 46.4.80.155, on 30 Sep 2021 at 08:49:26, subject to the Cambridge Core terms of use, available at https://www.cambridge.org/core/terms
. https://doi.org/10.1017/S1431927621000064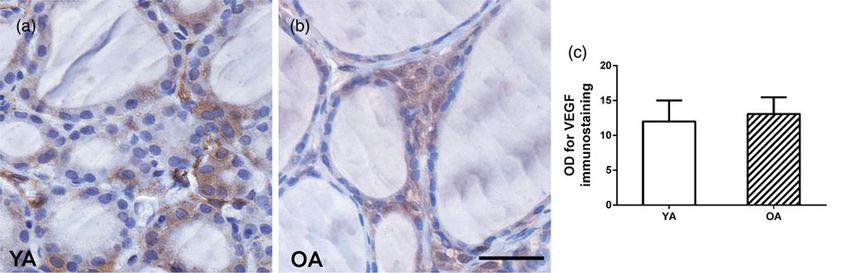
442                                                                                                                                                          Marko Miler et al.

       Fig. 3. Representative ultramicrographs of (a) young- (YA; 2800× magnification) and (b) old-aged (OA; 3500× magnification) male Wistar rats. Nu, nucleus; Ly, lyso-
       somes; rER, rough endoplasmic reticulum; C, colloid; CD, colloid droplets; Mv, microvilli; arrows, Tg granules.

      Fig. 4. Representative micrographs of TPO IHC expression in thyroids of (a) young- (YA) and (b) old-aged (OA) male Wistar rats. 40× magnification, bar = 25 μm.
      Small follicles of (c) YA and (d) OA thyroids. (e) TPO optical density (OD), each value represents mean ± SD, n = 4. (f) Relative mRNA level of Tpo, each value rep-
      resents
Downloaded     mean
            from      ± SD, n = 6; statistics: Student’s
                  https://www.cambridge.org/core.        t-test. 46.4.80.155, on 30 Sep 2021 at 08:49:26, subject to the Cambridge Core terms of use, available at https://www.cambridge.org/core/terms
                                                      IP address:
. https://doi.org/10.1017/S1431927621000064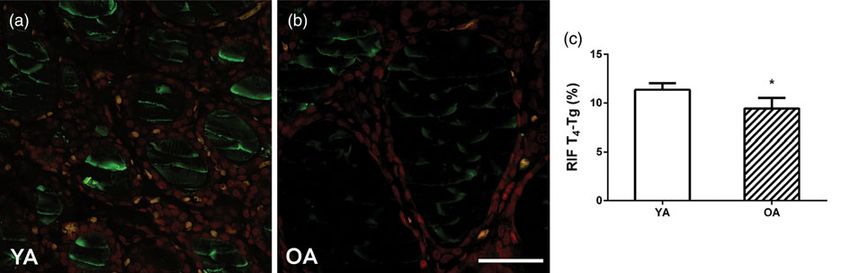
Microscopy and Microanalysis                                                                                                                                               443

        Fig. 5. Representative micrographs of Tg IHC expression in thyroids of (a) young- (YA) and (b) old-aged (OA) male Wistar rats. 40× magnification, bar = 25 μm. Small
        follicles of (c) YA and (d) OA thyroids. (e) Tg optical density (OD), each value represents mean ± SD, n = 4. (f) Relative mRNA level of Tg, each value represents mean
        ± SD, n = 6; statistics: Student’s t-test, *p < 0.05.

        amount of luminal colloid (Figs. 1a, 1b). Bigger follicles                                  Ultrastructural Analysis
        composed of a flattened follicular epithelium and a distended
                                                                                                    The thyrocytes of the thyroid gland of YA rats show a regular
        colloidal lumen were more numerous in comparison with
                                                                                                    structure with basal-apical orientation. The euchromatin nucleus
        smaller, more active ones (Figs. 1a, 1b). Collagen connective
        tissue in the interstitium of OA thyroids was represented like                              (Nu) positioned basally is surrounded by a developed, dilated rER
        in the YA group (Fig. 2). The presence of atrophic cysts, both                              network (Fig. 3a). A large number of polymorphic lysosomes (Ly)
        follicular (Fig. 1c) and keratinized (Fig. 1d), was noted in the                            is found in the cytoplasm, with colloidal droplets (CDs) of differ-
        OA thyroids.                                                                                ent diameters (Fig. 3a). The cuboidal epithelium indicates a very
            Stereological analysis demonstrated that the absolute volume                            dynamic and active gland, both in terms of thyroglobin synthesis
        of the thyroid gland, colloid, interstitium, and epithelium in the                          (arrows in Fig. 3a) and the process of its breakdown (colloidal
        OA group increased by 135, 135, 140, and 142% ( p < 0.05; Figs.                             drops surrounded by lysosomes; Fig. 3a). In the thyrocytes of
        1e–1h) respectively, in comparison with the values obtained for                             the thyroid gland of OA rats, the polarization of the cell from
        YA. However, the relative volume density of the colloid, intersti-                          the basal to the apical pole is preserved. The nucleus (Nu) is local-
        tium, and epithelium remained unchanged in comparison to the                                ized basally and dilated rER cisterns are observed around it
        young controls (Fig. 1i).                                                                   (Fig. 3b). The follicular epithelium is low-prismatic. At the apical

Downloaded from https://www.cambridge.org/core. IP address: 46.4.80.155, on 30 Sep 2021 at 08:49:26, subject to the Cambridge Core terms of use, available at https://www.cambridge.org/core/terms
. https://doi.org/10.1017/S1431927621000064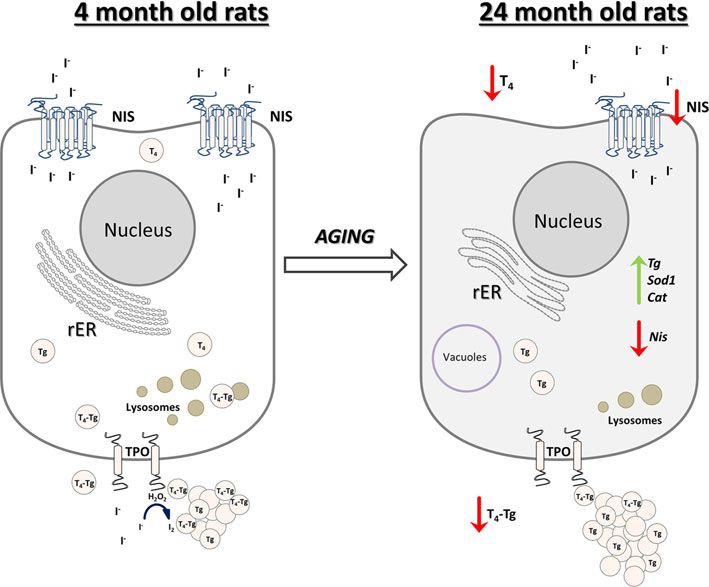
444 Marko Miler et al.
Fig. 6. Representative micrographs of T4-Tg IF signal in thyroids of (a) young- (YA) and (b) old-aged (OA) male Wistar rats. 40× magnification, bar = 25 μm. (c)
Relative intensity of fluorescence (RIF) of T4-Tg, each value represents mean ± SD, n = 4. Student’s t-test, *p < 0.05. Green signal represents T4-Tg, whereas red signal
represents nuclei.
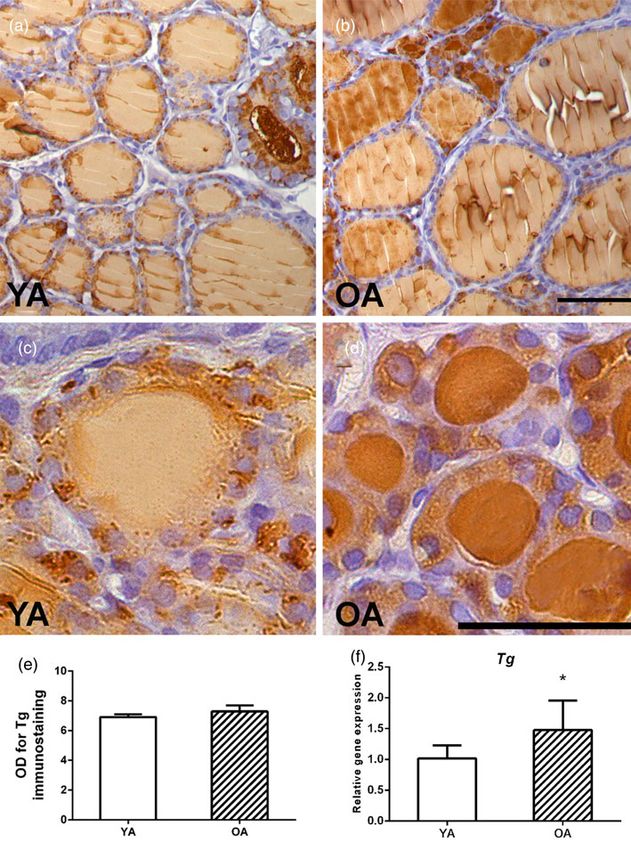
Fig. 7. Representative micrographs of NIS IHC expression in thyroids of (a, c) young- (YA) and (b, d) old-aged (OA) male Wistar rats. 20× and 40× magnification, bar =
50 and 25 μm, respectively. Arrows—NIS basolateral expression; arrowhead—NIS cytoplasmic expression; asterisk—regions of NIS expression. (e) Relative volume
density of NIS, each value represents mean ± SD, n = 4. (f) Relative mRNA level of Nis, each value represents mean ± SD, n = 6; statistics: Student’s t-test, *p < 0.05.
Downloaded from https://www.cambridge.org/core. IP address: 46.4.80.155, on 30 Sep 2021 at 08:49:26, subject to the Cambridge Core terms of use, available at https://www.cambridge.org/core/terms
. https://doi.org/10.1017/S1431927621000064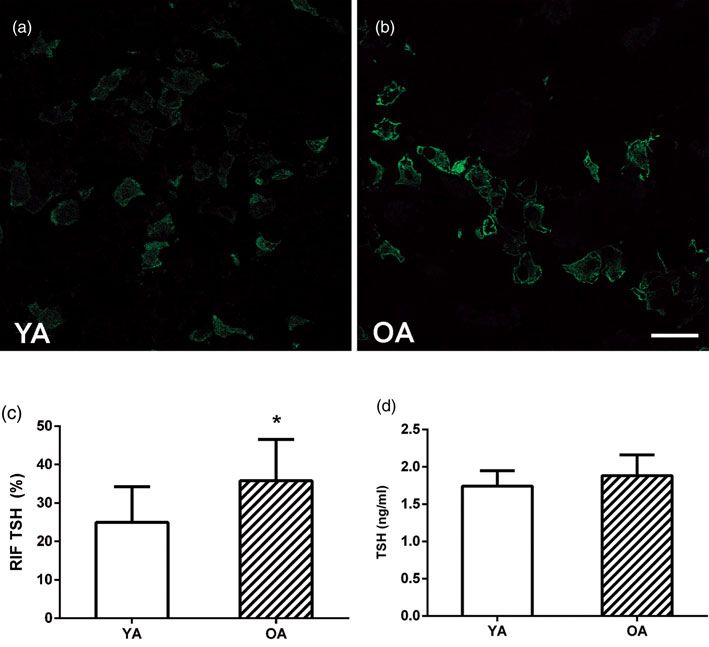
Microscopy and Microanalysis                                                                                                                                               445

        Fig. 8. Representative micrographs of VEGF IHC expression in thyroids of (a) young- (YA) and (b) old-aged (OA) male Wistar rats. (c) VEGF optical density (OD), each
        value represents mean ± SD, n = 4; statistics: Student’s t-test. 40× magnification, bar = 25 μm.

        Fig. 9. Representative micrographs of TSH IF signal in pituitaries of (a) young- (YA) and (b) old-aged (OA) male Wistar rats. 40× magnification, bar = 25 μm. (c)
        Relative intensity of fluorescence (RIF) of TSH. Green signal represents TSH granules. (d) Serum level of TSH (ng/mL). All the values are presented as mean ±
        SD (n = 6); statistics: Student’s t-test, *p < 0.05.

        membrane, much lesser microvilli (Mv) were immersed in the                                heterogeneity of TPO expression is noticed between follicles, and
        lumen of the colloid when compared with YA thyrocytes                                     also within one follicle, so some thyrocytes show a strong TPO sig-
        (Fig. 3b). Besides colloid droplets, cytoplasm contains lysosomes                         nal, while in others, there is no TPO signal (closer insight in Figs.
        (Ly) of different sizes, as well as small, dark vesicles near the api-                    4c, 4d). TPO localization is apical and cytoplasmic, while some
        cal pole, carrying newly synthesized thyroglobulin (arrow in                              small thyrocytes in the OA group have pronounced apical localiza-
        Fig. 3b), however, both less numerous than in the YA group.                               tion (Figs. 4c, 4d).
                                                                                                     An analysis of Tg expression showed an intensive granular sig-
                                                                                                  nal in the cytoplasm of the follicular epithelium and a weak Tg
        Morpho-Functional Characterization of the Thyroid                                         signal in most of the YA follicles (Figs. 5a, 5c). Small follicles
        In comparison with YA, in the OA thyroids, there is no difference                         are occasionally observed, characterized by an intense Tg signal
        in TPO expression (Figs. 4a, 4b, 4e). In both groups, the                                 in the luminal colloid of OA follicles (Fig. 5b). Darker, more

Downloaded from https://www.cambridge.org/core. IP address: 46.4.80.155, on 30 Sep 2021 at 08:49:26, subject to the Cambridge Core terms of use, available at https://www.cambridge.org/core/terms
. https://doi.org/10.1017/S1431927621000064
446                                                                                                                                                      Marko Miler et al.

       intensely colored small follicles in the parenchyma of the OA rat                         stereological, ultrastructural, hormonal, and gene expression anal-
       are more numerous, although a stronger granular cytoplasmic sig-                          yses. We identified changes that included an increment in the
       nal is present in the YA group (closer insight in Figs. 5c, 5d). The                      absolute thyroid volume, bigger inactive follicles, stronger TPO
       optical density of Tg immunostaining remained unchanged                                   and Tg expression in smaller active follicles, downregulation of
       between the two examined groups (Fig. 5e).                                                NIS IHC and gene expressions, upregulation of Tg, Cat, and
           The IF expression of T4 bound to Tg was characteristic of the                         Sod1, lower capacity to produce T4, a lower serum T4 level, and
       follicles in the central part of the thyroid gland of YA rats, with a                     an increase in pituitary TSH RIF, all in comparison with YA
       strong IF signal in the part of the colloid adjacent to the apical                        rats. Overall, the obtained results indicate depression of the
       membrane of the thyrocytes (Fig. 6a). In the OA, the central                              thyroid gland synthetic and secretory capacity with advanced age.
       region follicles of larger dimensions are characterized by a lacking                          After performing an unbiased stereological analysis, we con-
       or weak IF signal in the luminal colloid (Fig. 6b). Quantitative IF                       cluded that the OA thyroid glands were characterized by an incre-
       analysis showed 20% ( p < 0.05) decreased RIF in the OA group in                          ment in the total gland and individual phases’ absolute volume.
       comparison with the values of the YA group (Fig. 6c).                                     Follicles in the OA group were bigger in diameter and size, dilated,
           In the YA group, intensely stained follicles are scattered and                        with flattened epithelium, suggesting an inactive thyroid state,
       form regions of NIS expression within the tissue of the thyroid                           while the presence of smaller follicles was noticed to a lesser extent.
       gland (asterisk in Figs. 7a, 7c), which are more prevalent in                             Aging has been reported to cause a decrement in relative follicular
       this group than in OA animals (Figs. 7b, 7d). In both YA                                  epithelium and an increase in colloid volume in Miranda and
       and OA animals, a strong signal was observed only on the baso-                            Spague–Dawley rats (Mariotti et al., 1995; Moreira et al., 2005);
       lateral membrane of small-sized follicles (arrow in Fig. 7). In                           however, we report that the relative thyroid volume remained
       larger-sized follicles, the NIS signal is present only in the cyto-                       unchanged. Sometimes, an increase or decrease in the size, volume,
       plasm or is absent (arrowhead in Fig. 7). Quantitative analysis                           or mass of an organ suggests overstimulation or inhibition of the
       of the thyroid gland showed that the volume density of NIS                                thyroid gland (Šošić-Jurjević et al., 2014; Giuliani et al., 2017),
       positive follicles in the YA group was 29% higher ( p < 0.05)                             but this result was anticipated in our study because Wistar rats
       in comparison with the value obtained for the OA group                                    grow throughout their lives (Rao-Rupanagudi et al., 1992).
       (Fig. 7e).                                                                                    Further evaluation of the OA thyroid parenchyma showed the
           The intensity of VEGF signal varies between follicles (Fig. 8).                       presence of cystic atrophy, namely cysts that were lined by flat-
       The heterogeneity of the intensity of VEGF signal is observed                             tened or ciliated epithelium (follicular cysts) or filled with kerati-
       even among the thyrocytes of the same follicle (Fig. 8). IHC                              nized material (ultimobranchial cysts). The presence of cysts is a
       VEGF signal in the thyroid gland of OA rats is present only in                            characteristic sign of an inactive gland, and this is in accordance
       the follicular epithelium of smaller, more active follicles, whereas                      with the observation of Martin-Lacave et al. (1992); however,
       in the large, inactive ones it is partially absent (Fig. 8a).                             unlike in their results, connective tissue (collagen) did not
                                                                                                 increase in comparison with the YA group. In addition, our
                                                                                                 results show no inflammatory reaction or accumulation of lipid
       Pituitary TSH Cells Evaluation
                                                                                                 droplets in the thyroid parenchyma, which is in line with some
       The pituitary TSH IF signal was located in the cytoplasm of thy-                          already published data (Rao-Rupanagudi et al., 1992; Lee et al.,
       rotrophs of both experimental groups (Figs. 9a, 9b), whereas vac-                         2016).
       uoles were observed only in the OA group (Fig. 9b). Young male                                Results obtained by TEM revealed that OA thyroids have lower
       rats’ pituitary thyrotrophs (Fig. 9a) had lesser amounts of TSH                           secretory activity which is characterized by reduced lysosomes
       within their cytoplasm in comparison with the old ones                                    and Tg granules in the thyrocyte cytoplasm and lesser microvilli
       (Fig. 9b). The intensity of the TSH RIF signal was lower by                               in the thyroid lumen. Such an ultrastructural milieu is in line
       44% ( p < 0.05; Fig. 9c) in comparison with the OA value.                                 with the decrement of thyroid capacity to respond to TSH,
                                                                                                 since the lysosome number immediately increases in response
                                                                                                 to TSH (Uchiyama et al., 1986). Even the unchanged TSH level
       Hormonal Analysis
                                                                                                 in OA rats is in line with the results of Donda &
       Serum T4 concentration in the OA group was 40% lower ( p <                                Lemarchand-Beraud (1989), as the number of TSH receptors
       0.05; Fig. 1j) in comparison with the values obtained for YA.                             (TSHR) on the thyrocyte surface decrease with advanced age
       The TSH level remained unchanged (Fig. 9d).                                               (Armengol et al., 2001), leading to a depression of T4 secretion.
                                                                                                 Moreover, even though the TSH RIF signal shows TSH granule
                                                                                                 accumulation in the thyrotrophs, lower T4 was not a sufficient
       qPCR Analysis
                                                                                                 stimulus for a positive feedback loop response, suggesting central
       Our gene expression analysis showed that OA was characterized                             deregulation of this axis with advanced age.
       by higher mRNA levels of Tg, Sod1, and Cat by 45, 113, and                                    The functional characterization of thyroid specific proteins
       136% ( p < 0.05; Fig. 5f; Supplementary Figs. S1A, S1C), respec-                          (TPO, Tg, T4-Tg, and NIS) was used as a powerful tool in the
       tively, while the mRNA level of Nis decreased by 31% ( p < 0.05;                          morpho-functional evaluation of the thyroid gland. Herein, we
       Fig. 7f), all in comparison with the YA group. The gene expres-                           showed that the TPO IHC expression pattern remained
       sions of Tpo, Sod2, Gpx, Gr, and Nrf2 (Fig. 4f; Supplementary                             unchanged with advanced age. This was followed by an unaltered
       Figs. S1B, S1D, S1E, S1F) remained unchanged.                                             Tpo mRNA level in the OA group, despite the fact that Tpo gene
                                                                                                 expression was shown to decrease in old Dutch–Miranda male
                                                                                                 rats (Corrêa Da Costa et al., 2001). Interestingly, we observed
       Discussion
                                                                                                 intensive TPO apical localization in some small OA follicles; of
       The present study aimed to report and evaluate all alterations in                         note, only the apical localization of TPO is responsible for TH
       the thyroid glands of old-aged male Wistar rats, with a focus on                          synthesis (Kotani & Ohtaki, 1987; Fayadat et al., 1998). In

Downloaded from https://www.cambridge.org/core. IP address: 46.4.80.155, on 30 Sep 2021 at 08:49:26, subject to the Cambridge Core terms of use, available at https://www.cambridge.org/core/terms
. https://doi.org/10.1017/S1431927621000064
Microscopy and Microanalysis 447
Fig. 10. Schematic representation of thyroid gland structural and functional alterations during aging in male Wistar rats. Old-aged thyroids are characterized by
lower NIS expression thus lower iodide import. Dilated rER and a smaller number of lysosomes indicate decreased synthesis and secretion of T4, which leads to
lower T4 concentration in serum of old-aged rats. Cat, catalase; H2O2, hydrogen peroxide; I−, iodide; I2, iodine; NIS, sodium iodide symporter; rER, rough endoplas-
mic reticulum; T4, thyroxine; Tg, thyroglobulin; T4-Tg, T4 bound to Tg; TPO, thyroid peroxidase; Sod1, superoxide dismutase 1.
addition, TSH is a controller of TPO expression, while antibodies abundant NIS expression in YA rats provides higher iodide
to TPO arise spontaneously with age (Chen et al., 2010), leading import from circulation, thus more TH production and vice
to interference with TH production. versa. The downregulation of NIS expression is in line with
In line with TPO, we noticed stronger Tg expression, yet again, lower ability of the gland to respond to TSH.
in small OA follicles. Tg is localized in the thyroid colloid where it Since the uptake of highly reactive iodide is decreased; how-
serves as a depot for TH. Average Tg OD did not differ between ever, this result supports the preserved antioxidant defense in
the examined groups, but the stronger Tg IHC expression in small the OA thyroid. Nrf2 is activated in an environment with iodide
follicles was in accordance with the upregulation of Tg mRNA surplus to prevent damage to proteins and DNA which would be
transcription, suggesting Tg accumulation in the OA colloid. detrimental in OA thyroids (Wang et al., 2017). Conversely, we
Our findings differ from the results obtained in Dutch–Miranda reported upregulation of Cat and Sod1 gene transcription in OA
old rats, showing a decrement in Tg mRNA level by 50% thyroids, suggesting that this alteration is clearly a result of the
(Corrêa Da Costa et al., 2001). The obtained difference in Tpo aging process, especially since the Nrf2 mRNA level remained
and Tg mRNA levels is obviously a consequence of different rat unchanged in OA thyroids.
strains used in the evaluations. Lastly, we analyzed the expression of VEGF, an angiogenic fac-
Nevertheless, we noticed a decrement in the T4-Tg IF signal tor and a key player in the process of new blood vessel formation.
intensity in the OA group. The T4-Tg antibody is a marker of Our results revealed that the VEGF IHC signal manifested the
newly synthetized T4 in the thyroid luminal colloid (Faggiano same expression pattern in both experimental groups. Increasing
et al., 2004) and its decrease emphasizes lower T4 production. vascularity surrounding thyroid follicles may also promote cell pro-
Although Tg accumulates in some small follicles, it is not iodized, liferation due to the increase in blood flow and micronutrient
leading to T4 depletion, which was followed by lower T4 serum delivery. However, it can also be a sign of tumorigenesis, the inci-
concentrations in old animals. These results suggest the thyroid dence of which increases with advancing age (Konturek &
gland’s capacity to produce and accumulate Tg in small, active Barczynski, 2012; Rajabi et al., 2019). This can be interpreted as
follicles. However, there is a decrement in T4 production, which a positive result, bearing in mind we did not observe an increase
is not sufficient to cause a change in the circulating T4 level. in either TSH concentration or the microcirculation of small
In addition, we measured the NIS relative volume density, as follicles.
NIS transport iodide, an inevitable element of TH synthesis We want to point out both several advantages and the neces-
(Bizhanova & Kopp, 2009). We determined that the basolateral sity of this type of studies. Though structural parameters need
membrane of OA thyroids showed significantly lower expression time to change, it is absolutely justified to take into account
of NIS, which is in accordance with the lower Nis mRNA level this level of organization when investigating the effects of aging
(Faggiano et al., 2004). Physiologically speaking, the more on an endocrine gland. Namely, both acute and chronic
Downloaded from https://www.cambridge.org/core. IP address: 46.4.80.155, on 30 Sep 2021 at 08:49:26, subject to the Cambridge Core terms of use, available at https://www.cambridge.org/core/terms
. https://doi.org/10.1017/S1431927621000064448 Marko Miler et al.
administration of various treatments (drugs, supplements) has Donda A & Lemarchand-Beraud T (1989). Aging alters the activity of
been shown to lead to significant changes in thyroid structure, 5′ -deiodinase in the adenohypophysis, thyroid gland, and liver of the
which is reflected in parenchymal alterations (Giuliani et al., male rat. Endocrinology 124, 1305–1309.
Dorph-Petersen K-A, Nyengaard JR & Gundersen HJG (2001). Tissue
2014, 2017; Šošić-Jurjević et al., 2014; Miler et al., 2017). Thus,
shrinkage and unbiased stereological estimation of particle number and
it is of great importance to define and list all the changes in old
size. J Microsc 204, 232–246.
thyroids, thus far lacking in the literature, to set a clear ground Dunn JT & Dunn AD (2001). Update on intrathyroidal iodine metabolism.
for different experimental designs which would use OA thyroids Thyroid 11, 407–414.
in their studies. Endocrine signaling is very fast, however, alter- Faggiano A, Coulot J, Bellon N, Talbot M, Caillou B, Ricard M, Bidart J-M
ations caused by a treatment or just aging can be written into & Schlumberger M (2004). Age-dependent variation of follicular size and
the gland histoarchitecture, particularly on the ultrastructural expression of iodine transporters in human thyroid tissue. J Nucl Med 45,
level. This implies that the structural level is equally important 232–237.
as the functional (molecular) level, and furthermore that struc- Fayadat L, Niccoli-Sire P, Lanet J & Franc JL (1998). Human thyroperoxidase
tural data may be supported by functional (hormonal, gene, pro- Is largely retained and rapidly degraded in the endoplasmic reticulum. Its
N-glycans are required for folding and intracellular trafficking.
tein expression) results.
Endocrinology 139, 4277–4285.
In conclusion, we reported that the old-aged thyroid did not
Giuliani C, Bucci I, Di Santo S, Rossi C, Grassadonia A, Piantelli M,
preserve the capacity to produce thyroid hormones, since hor- Monaco F & Napolitano G (2014). The flavonoid quercetin inhibits
mone synthesis was observed to a much lesser extent than in thyroid-restricted genes expression and thyroid function. Food Chem
YA thyroids (Fig. 10). The gland’s synthetic capacity was charac- Toxicol 66, 23–29.
terized by lower T4 production due to the downregulation of Giuliani C, lezzi M, Ciolli L, Hysi A, Bucci I, Di Santo S, Rossi C, Zucchelli
iodide import and thyroid gland unresponsiveness to TSH. The M & Napolitano G (2017). Resveratrol has anti-thyroid effects both in vitro
latter also caused reduced T4 secretion, which was observed as a and in vivo. Food Chem Toxicol 107, 237–247.
lower T4 concentration in the serum of OA rats (Fig. 10). Gundersen HJ & Jensen EB (1987). The efficiency of systematic sampling in
stereology and its prediction. J Microsc 147, 229–263.
Supplementary material. To view supplementary material for this article, Konturek A & Barczynski M (2012. Vascular endothelial growth factor
please visit https://doi.org/10.1017/S1431927621000064. (VEGF) and epidermal growth factor (EGF) in papillary thyroid cancer.
In Thyroid and Parathyroid Diseases - New Insights Into Some Old and
Acknowledgments. This work was supported by the Ministry of Education, Some New Issues, Ward LS (Ed.), pp. 87–94. Rijeka, Croatia: InTech.
Science and Technological Development of the Republic of Serbia, Contract Kotani T & Ohtaki S (1987). Characterization of thyroid follicular cell apical
number 451-03-68/2020-14/200007. We are grateful to academician Prof. plasma membrane peroxidase using monoclonal antibody. Endocrinol Jpn
Dr. Vladimir Bumbaširević, Asst. Prof. Tamara Kravić Stevović, Tamara 34, 407–413.
Martinović, and Darko Ćirić, all from the Institute of Histology and Lee J, Yi S, Kang YE, Kim H-W, Joung KH, Sul HJ, Kim KS & Shong M
Embriology “Aleksandar Đ. Kostić”, School of Medicine, University of (2016). Morphological and functional changes in the thyroid follicles of
Belgrade, for their valuable help in the ultrastructural analysis. We are grateful the aged murine and humans. J Pathol Transl Med 50, 426–435.
to Mrs. Maja Vojvodić, an English language professional, for her help in proof- Mariotti S, Franceschi C, Cossarizza A & Pinchera N (1995). The aging thy-
reading the manuscript. roid. Endocr Rev 16, 686–715.
Martin-Lacave I, Conde E, Montero C & Galera-Davidson H (1992).
Quantitative changes in the frequency and distribution of the C-cell popu-
References lation in the rat thyroid gland with age. Cell Tissue Res 270, 73–77.
Ajdžanović V, Miler M, Živanović J, Filipović B, Šošić-Jurjević B, Miler M, Jarić I, Živanović J, Ajdžanović V, Tanić N, Milošević V &
Popovska-Perčinić F & Milošević V (2020). The adrenal cortex after estra- Šošić-Jurjević B (2017). Citrus flavanones mildly interfere with pituitary-
diol or daidzein application in a rat model of the andropause: Structural and thyroid axis in old-aged male rats. Acta Histochem 119, 292–301.
hormonal study. Ann Anat 230, 151487. Miler M, Šošić-Jurjević B, Nestorović N, Ristić N, Medigović I, Savin S,
Ajdžanović VZ, Jarić IM, Živanović JB, Filipović BR, Šošić-Jurjević BT, Milošević V, Šošič-Jurjević B, Nestorović N, Ristić N, Medigović I,
Ristić NM, Stanković SD & Milošević VL (2016). Histological parameters Savin S & Milošević V (2014). Morphological and functional changes in
of the adrenal cortex after testosterone application in a rat model of the pituitary-thyroid axis following prolonged exposure of female rats to cons-
andropause. Histol Histopathol 31, 1209–1220. tant light. J Morphol 275, 1161–1172.
Ajdžanović VZ, Trifunović S, Miljić D, Šošić-Jurjević B, Filipović B, Miler Miler M, Živanović J, Ajdžanović V, Milenkovic D, Jarić I, Šošić-Jurjević B
M, Ristić N, Manojlović-Stojanoski M & Milošević V (2018). & Milošević V (2020). Citrus flavanones upregulate thyrotroph Sirt1 and
Somatopause, weaknesses of the therapeutic approaches and the cautious differently affect thyroid Nrf2 expressions in old-aged Wistar rats. J Agric
optimism based on experimental ageing studies with soy isoflavones. Food Chem 68, 8242–8254.
EXCLI J 17, 279–301. Moreira DG, Marassi MP, Corrêa da Costa VM, Carvalho DP & Rosenthal
Armengol MP, Juan M, Lucas-Martín A, Fernández-Figueras MT, D (2005). Effects of ageing and pharmacological hypothyroidism on
Jaraquemada D, Gallart T & Pujol-Borrell R (2001). Thyroid autoimmune pituitary-thyroid axis of Dutch-Miranda and Wistar rats. Exp Gerontol
disease. Am J Pathol 159, 861–873. 40, 330–334.
Barbesino G (2019). Thyroid function changes in the elderly and their rela- Rajabi S, Dehghan MH, Dastmalchi R, Mashayekhi FJ, Salami S & Hedayati
tionship to cardiovascular health: A mini-review. Gerontology 65, 1–8. M (2019). The roles and role-players in thyroid cancer angiogenesis. Endocr
Bizhanova A & Kopp P (2009). The sodium-iodide symporter NIS and pen- J 66, 277–293.
drin in iodide homeostasis of the thyroid. Endocrinology 150, 1084–1090. Rao-Rupanagudi S, Heywood R & Gopinath C (1992). Age-related changes
Chahal H & Drake W (2007). The endocrine system and ageing. J Pathol 211, in thyroid structure and function in Sprague-Dawley rats. Vet Pathol 29,
173–180. 278–287.
Chen C-R, Hamidi S, Braley-Mullen H, Nagayama Y, Bresee C, Aliesky HA, Silvestri E, Lombardi A, de Lange P, Schiavo L, Lanni A, Goglia F, Visser TJ
Rapoport B & McLachlan SM (2010). Antibodies to thyroid peroxidase & Moreno M (2008). Age-related changes in renal and hepatic cellular
arise spontaneously with Age in NOD.H-2h4 mice and appear after thyro- mechanisms associated with variations in rat serum thyroid hormone levels.
globulin antibodies. Endocrinology 151, 4583–4593. Am J Physiol-Endoc M 294, E1160–E1168.
Corrêa Da Costa VM, Moreira DG & Rosenthal D (2001). Thyroid function Song Y, Driessens N, Costa M, De Deken X, Detours V, Corvilain B,
and aging: Gender-related differences. J Endocrinol 171, 193–198. Maenhaut C, Miot F, Van Sande J, Many M-C & Dumont JE (2007).
Downloaded from https://www.cambridge.org/core. IP address: 46.4.80.155, on 30 Sep 2021 at 08:49:26, subject to the Cambridge Core terms of use, available at https://www.cambridge.org/core/terms
. https://doi.org/10.1017/S1431927621000064Microscopy and Microanalysis 449
Roles of hydrogen peroxide in thyroid physiology and disease. J Clin Uchiyama Y, Murakami G & Igarashi M (1986). Changes in colloid droplets
Endocrinol Metab 92, 3764–3773. and dense bodies in rat thyroid follicular cells during 24 hours: Fine struc-
Šošić-Jurjević B, Filipović B, Renko K, Miler M, Trifunović S, Ajdžanovič tural and morphometric studies. Am J Anat 175, 15–22.
V, Köhrle J & Milošević V (2015). Testosterone and estradiol treatments Wang T, Liang X, Abeysekera IR, Iqbal U, Duan Q, Naha G, Lin L & Yao X
differently affect pituitary-thyroid axis and liver deiodinase 1 activity in (2017). Activation of the Nrf2-keap 1 pathway in short-term iodide excess
orchidectomized middle-aged rats. Exp Gerontol 72, 85–98. in thyroid in rats. Oxid Med Cell Longevity 2017, Article ID 4383652.
Šošić-Jurjević B, Filipović B, Wirth EK, Živanović J, Radulović N, Janković Živanović J, Jarić I, Ajdžanović V, Mojić M, Miler M, Šošić-Jurjević B,
S, Milošević V & Köhrle J (2014). Soy isoflavones interfere with thyroid Milošević V & Filipović B (2019). Daidzein upregulates anti-aging protein
hormone homeostasis in orchidectomized middle-aged rats. Toxicol Appl klotho and NaPi 2a cotransporter in a rat model of the andropause. Ann
Pharmacol 278, 124–134. Anat 221, 27–37.
Downloaded from https://www.cambridge.org/core. IP address: 46.4.80.155, on 30 Sep 2021 at 08:49:26, subject to the Cambridge Core terms of use, available at https://www.cambridge.org/core/terms
. https://doi.org/10.1017/S1431927621000064You can also read