Tsunami hazard assessment: Lenakel, Tanna, Vanuatu - Geoscience, Energy and Maritime Division of the Pacific Community - NET
←
→
Page content transcription
If your browser does not render page correctly, please read the page content below
Tsunami hazard assessment:
Lenakel, Tanna, Vanuatu

Geoscience, Energy and Maritime Division of the Pacific Community
Tsunami hazard assessment:
         Lenakel, Tanna, Vanuatu
Judith Giblin, Naomi Jackson, Herve Damlamian, Zulfikar Begg, Moritz Wandres,
        Poate Degei, Salesh Kumar, Tony Kanas, Rodhson Aru, Noel Naki

        Geoscience, Energy and Maritime Division of the Pacific Community

                                 Suva, Fiji, 2019
© Pacific Community (SPC) 2019
All rights for commercial/for profit reproduction or translation, in any form, reserved. SPC authorises the partial
reproduction or translation of this material for scientific, educational or research purposes, provided that SPC
and the source document are properly acknowledged. Permission to reproduce the document and/or translate
in whole, in any form, whether for commercial/for profit or non-profit purposes, must be requested in writing.
Original SPC artwork may not be altered or separately published without permission.

                                                 Original text: English
                                Pacific Community Cataloguing-in-publication data
                                           Technical report no. SPC00061

Giblin, Judith
Tsunami hazard assessment: Lenakel, Tanna, Vanuatu / Judith Giblin, Naomi Jackson, Herve Damlamian, Zulfikar
Begg, Moritz Wandres, Poate Degei, Salesh Kumar, Tony Kanas, Rodhson Aru and Noel Naki

   1. Tsunamis – Risk assessment – Vanuatu.
   2. Natural disasters – Risk assessment – Vanuatu.
   3. Sea level – Vanuatu.
   4. Climatic changes – Vanuatu.
   5. Coastal zone management – Vanuatu.
   6. Cyclones – Vanuatu.
   7. Ocean waves – Vanuatu.

I. Giblin, Judith II. Jackson, Naomi III. Damlamian, Herve IV. Begg, Zulfikar V. Wandres, Moritz
VI. Degei, Poate VII. Kumar, Salesh VIII. Kanas, Tony IX. Aru, Rodhson X. Naki, Noel XI. Title
XII. Pacific Community

551.4637099595 									AACR2

ISBN : 978 982 00 1217 2

                               Prepared for publication at SPC’s Suva Regional Office,
                                          Private Mail Bag, Suva, Fiji, 2019
                                             www.spc.int | spc@spc.int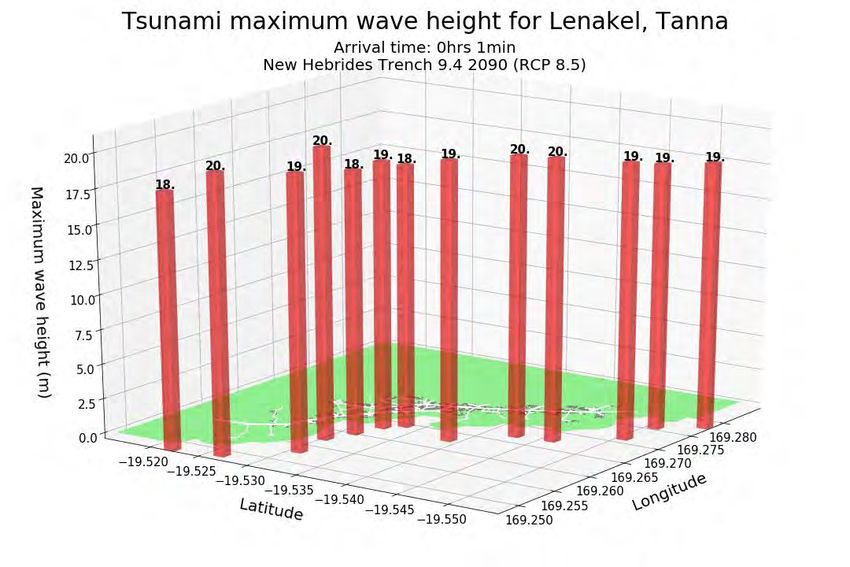
Tsunami hazard assessment, Lenakel, Tanna, Vanuatu

TABLE OF CONTENTS

GLOSSARY............................................................................................................................................... vi
ACKNOWLEDGMENTS ............................................................................................................................ vi
EXECUTIVE SUMMARY .......................................................................................................................... vii
1     INTRODUCTION ................................................................................................................................ 1
    1.1     Background ................................................................................................................................ 1
    1.2     Project objectives and outcomes .............................................................................................. 1
    1.3     Purpose of this report................................................................................................................ 1
2     VANUATU TSUNAMI THREAT PROFILE ............................................................................................. 2
3     TSUNAMI MODELLING SOFTWARE – GEOCLAW .............................................................................. 5
    3.1     GeoCLAW parameters – staying conservative .......................................................................... 5
    3.2     Model validation........................................................................................................................ 5
    3.3     Sensitivity analysis ..................................................................................................................... 6
4     METHODOLOGY ................................................................................................................................ 7
    4.1     MDRR scenarios ......................................................................................................................... 7
    4.2     Historical tsunami ...................................................................................................................... 9
    4.3     Sea-level rise inclusion scenarios .............................................................................................. 9
5     RESULTS .......................................................................................................................................... 10
6     DISCUSSION .................................................................................................................................... 19
    6.1     Possible evacuation routes from the maps ............................................................................. 20
    6.2     Probabilistic tsunami hazard assessment ................................................................................ 20
7     EVACUATION PLANNING ................................................................................................................ 21
8     CONCLUSION .................................................................................................................................. 22
9     REFERENCES.................................................................................................................................... 23

Pacific Community: Geoscience, Energy and Maritime Division                                                                                             iii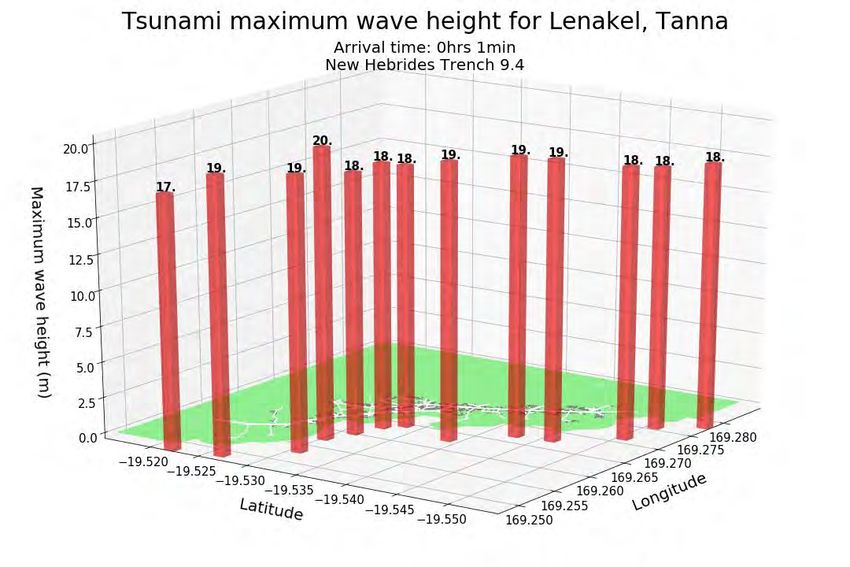
Tsunami hazard assessment, Lenakel, Tanna, Vanuatu

LIST OF FIGURES

Figure 1: The Pacific ring of fire (National Geographic, 2018) ........................................................................2
Figure 2: The tectonic plates situated near Vanuatu. The New Hebrides Trench is caused by the
subduction of the Australian plate below the Pacific plate (Makin 2018). ....................................................3
Figure 3: Maximum amplitude at a 2000-year return period for all model output points
(Thomas and Burbidge 2008) ..........................................................................................................................4
Figure 4: Earthquake and tide gauge locations, adapted from the USGS earthquake hazards website
(Kumar and Bosserelle 2017) ..........................................................................................................................5
Figure 5: Comparison of Lenakel tide gauge and the computed tsunami model sea height data .................6
Figure 6: Comparison of the sensitivity analysis carried out on 30 km, 20 km and 10 km resolution grids ..7
Figure 7: Map of the MDRR tsunamigenic earthquake scenario locations ....................................................8
Figure 8: Tide gauge records (purple) of relative sea-level and satellite record (green) since 1993.
Reconstructed sea-level data at Vanuatu (black) since 1950. Also, 1995–2100 multi-model mean
projections for very high (red solid line), and very low (blue solid line) emission scenarios, with 5–95%
uncertainty range in shaded red and blue regions. Range of projections for the four emission scenarios by
2100 are show by the bars on the right (Australian Bureau of Meteorology and CSIRO 2014). ....................9
Figure 9: Plot-3D of the historical tsunami 1875 inundation heights along the Lenakel coastline with the
depth (m) noted on top of the bars with the arrival time of one minute ....................................................11
Figure 10: Plot-3D of the historical tsunami 1875 (with 2090 sea-level rise) inundation heights along the
Lenakel coastline with the depth (m) noted on top of the bars with the arrival time of one minute .........11
Figure 11: Plot-3D of the Alaska Mw 9.4 tsunami inundation heights along the Lenakel coastline with the
depth (m) noted on top of the bars with the arrival time of 11 hours and 13 minutes ...............................12
Figure 12: Plot-3D of the Alaska Mw 9.4 (with 2090 sea-level rise) tsunami inundation heights along the
Lenakel coastline with the depth (m) noted on top of the bars with the arrival time of
12 hours and 54 minutes ..............................................................................................................................12
Figure 13: Plot-3D of the Aleutian Mw 9.4 tsunami inundation heights along the Lenakel coastline with
the depth (m) noted on top of the bars with the arrival time of 11 hours ..................................................13
Figure 14: Plot-3D of the Aleutian Mw 9.4 (with 2090 sea-level rise) tsunami inundation heights along the
Lenakel coastline with the depth (m) noted on top of the bars with the arrival time of 11 hours ..............13
Figure 15: Plot-3D of the New Hebrides Trench Mw 9.0 tsunami inundation heights along the Lenakel
coastline with the depth (m) noted on top of the bars with the arrival time of one minute.......................14
Figure 16: Plot-3D of the New Hebrides Trench Mw 9.0 (with 2090 sea-level rise) tsunami inundation
heights along the Lenakel coastline with the depth (m) noted on top of the bars with the arrival time of
one minute....................................................................................................................................................14
Figure 17: Plot-3D of the New Hebrides Trench Mw 9.4 tsunami inundation heights along the Lenakel
coastline with the depth (m) noted on top of the bars with the arrival time of one minute.......................15
Figure 18: Plot-3D of the New Hebrides Trench Mw 9.4 (with 2090 sea-level rise) tsunami inundation
heights along the Lenakel coastline with the depth (m) noted on top of the bars with the arrival time of
one minute....................................................................................................................................................15
Figure 19: Plot-3D of the Tonga Trench Mw 9.0 tsunami inundation heights along the Lenakel coastline
with the depth (m) noted on top of the bars with the arrival time of 3 hours 22 minutes .........................16
Figure 20: Plot-3D of the Tonga Trench Mw 9.0 (with 2090 sea-level rise) tsunami inundation heights
along the Lenakel coastline with the depth (m) noted on top of the bars with the arrival time of 3 hours
22 minutes ....................................................................................................................................................16
Figure 21: Tsunami inundation map of the historical tsunami in 1875 ........................................................18
Figure 22: Map of the three hazardous points with the highest inundation locations for a majority of the
tsunami scenarios (red stars). The buildings (yellow) and roads (pink lines) are overlaid on a satellite
imagery of Lenakel, Tanna. ...........................................................................................................................20
Figure 23: Hazard curve of the PTHA18 database with the maximum stage of the MDRR scenarios (red
crosses) overlaid on the curve (orange line). The historical scenario is labelled using a green star. ...........21
Figure 24: Draft Lenakel tsunami evacuation map .......................................................................................22

Pacific Community: Geoscience, Energy and Maritime Division                                                                                                   iv
Tsunami hazard assessment, Lenakel, Tanna, Vanuatu

LIST OF TABLES

Tables

Table 1: Tsunamigenic earthquake source scenarios simulated under the MDRR project and used for
this Lenakel tsunami modelling. ............................................................................................................. 8
Table 2: List of tsunamigenic earthquake scenarios that revealed the most inundation heights out of
the 32 scenarios tested that were recorded on the Lenakel coastline from the tsunami simulation.
Also provided is the range of inundation heights and arrival time recorded with its corresponding 3D
plot figure number. ............................................................................................................................... 10

Pacific Community: Geoscience, Energy and Maritime Division                                                                                         v
Tsunami hazard assessment, Lenakel, Tanna, Vanuatu
GLOSSARY
Amplitude: Height of the crest of the tsunami wave above mean sea level
Bathymetry: The measurement of the depth of the ocean floor from the water
surface
Hazard curves: Describes the relationship between the return period and the
maximum tsunami amplitude for a particular model output point.
The tsunami amplitude given on the y-axis is predicted to be
exceeded with the average return period given by the x-axis.
Return period: The average length of time expected between events exceeding
a given amplitude at a given offshore depth
Tsunami: Wave generated by a sudden disturbance of water. It is fast
moving with a small amplitude in deep water but slows down and
increases in height as it reached shallow water.
Tsunamigenic: Earthquake capable of producing a tsunami (commonly along
major subduction zone plate boundaries)
ACKNOWLEDGMENTS
This report was prepared under the the SPC Recovery Support for Tropical Cyclone Pam project
funded by the KfW Bank Group. The report was prepared with contributions from a large number of
people who assisted during field surveys and data processing.
The authors would like to express their appreciation and gratitude to the following organisations and
individuals:
the Vanuatu Land and Surveys Department,
the Lenakel Town Council,
GNS Science, MDRR data hosts,
Judith Giblin, Naomi Jackson, Herve Damlamian, Zulfikar Begg, Moritz Wandres, Poate Degei,
Salesh Kumar (Geoscience Energy and Maritime Division, Pacific Community), and
Tony Kanas, Rodhson Aru, Noel Naki (Department of Lands and Surveys, Vanuatu Government).
Pacific Community: Geoscience, Energy and Maritime Division vi
Tsunami hazard assessment, Lenakel, Tanna, Vanuatu

EXECUTIVE SUMMARY

Tropical Cyclone (TC) Pam made landfall in Vanuatu on 13 March 2015, causing severe
damage to parts of the country. A post-disaster needs assessment (Esler 2015) completed
less than a month after the cyclone highlighted the need for multi-hazard mapping of urban
areas and for an action plan to identify safe areas for future growth. The report also
emphasised the importance of having a sound scientific basis for predicting hazards and a
reliable forecasting system.

As part of a recovery and support package commissioned by the Kreditanstalt für
Wiederaufbau (KfW) Bank Group, a team from the Geoscience, Energy and Maritime
Division of the Pacific Community (SPC) undertook a baseline (topography and bathymetry)
survey of Lenakel on the island of Tanna in December 2016. The survey utilised unmanned
aerial vehicle (UAV) and global navigation satellite system (GNSS) technology, and a single-
beam echo-sounder to acquire topography data. The data were used primarily in the
preparation of various multi-hazard mapping products to inform improved resilience of
coastal communities.

Four key inundation hazards were assessed: tsunami, storm surge, tropical cyclones and
swells. This report focuses on outlining the tsunami inundation work that was carried out in
support of Lenakel’s tsunami evacuation planning.

In this study, the inundation from 16 tsunami scenarios from the World Bank Mainstreaming
Disaster Risk Reduction (MDDR) project were investigated. An indicative likelihood was
attributed to each scenario, based on the resulting maximum tsunami wave height offshore
Lenakel, using the Geoscience Australia new probabilistic tsunami hazard assessment (GA
2018).

As requested by the Government of Vanuatu, the designed worst case scenario, a
tsunamigenic earthquake of magnitude 9.4 generated along the New Hebrides Trench, was
used during a workshop in Lenakel to plan tsunami evacuation routes. The draft plan was
then used to support the first tsunami drill exercise in Lenakel (coordinated by the National
Disaster Management Office (NDMO) and Care International), which took place on 18
October 2018.

Pacific Community: Geoscience, Energy and Maritime Division                               vii
Tsunami hazard assessment, Lenakel, Tanna, Vanuatu
1 INTRODUCTION
1.1 Background
In December 2015, the Government of the Federal Republic of Germany, through the
Kreditanstalt für Wiederaufbau (KfW) Bank Group, signed an agreement with SPC for the
delivery of a project to support Pacific Islands affected by TC Pam.
The project, SPC Recovery Support for Tropical Cyclone Pam, is implemented through 42
packages that include advisory services, field activities and investments to support the
recovery from the cyclone in affected parts of Vanuatu, Tuvalu, Kiribati and Solomon
Islands. The project is structured in two phases. The first phase comprised technical capacity
support for damage assessments in the immediate aftermath of the cyclone, whilst the
second phase, significantly longer, involved implementation of a combination of multi-
sector activities targeted at specific recovery needs identified by each country.
1.2 Project objectives and outcomes
Vanuatu is highly vulnerable to natural hazards, both geophysical and hydro-meteorological.
The post-disaster need assessment (PDNA) (Esler 2015) report emphasises that a mid- to
long-term reconstruction effort needs to be undertaken in order to improve resilience in all
sectors.
The PDNA also highlights the need for multi-hazard mapping of urban areas and action plans
to identify safe areas for future growth, the importance of having a sound scientific basis for
predicting hazards, and a reliable forecasting system.
The Geoscience, Energy and Maritime Division of SPC proposed to assist the multi-hazard
mapping effort already under way in Port Vila and Luganville (World Bank MDRR project), by
undertaking a similar activity in an appropriate location, namely, Lenakel on Tanna
(population about 14,000 people). The study aims to identify the probable risk of coastal
inundation from tsunamigenic earthquakes and cyclones, and the co-occurrence of large
swells with possible high storm-tide level. The study also investigates the possible
exacerbation of the inundation risk inherent from sea-level rise. Community members were
engaged to provide information and data, and to participate in the development of
response plans.
Through this project, SPC aimed to deliver:
geospatial baseline data used in cross-sector activities, e.g. topography, bathymetry;
hazard maps to identify low hazard-prone land suitable for future growth;
tools and training for the dissemination of the information, both at the central and
provincial government level; and
support response plans for the municipality and adjacent communities.
1.3 Purpose of this report
This report describes the methodology and results of the tsunami hazard assessment
computed for Lenakel, Tanna Island, Vanautu. The tsunami modelling was computed using
a software package called GeoCLAW, based on earthquake deformation grids provided by
Pacific Community: Geoscience, Energy and Maritime Division 1Tsunami hazard assessment, Lenakel, Tanna, Vanuatu
the World Bank MDRR project. This report outlines the tsunami software used, the software
methodology, and the data processing of the bathymetry grids and earthquake deformation
grids.
2 VANUATU TSUNAMI THREAT PROFILE
The archipelago of Vanuatu consists of 83 volcanic islands (65 inhabited) covering a total
land area of 12,200 km2. The islands are home to a population of 253,000 people,
distributed among six provinces: Malampa, Penama, Sanma, Shefa, Tafea and Torba. The
households in in the rural areas of these provinces primarily engage in subsistence
livelihoods (Esler 2015).
Vanuatu’s exposure to both geophysical and hydro-meteorological hazards, and limited
financial and technical capacity for disaster preparedness and response makes it one of the
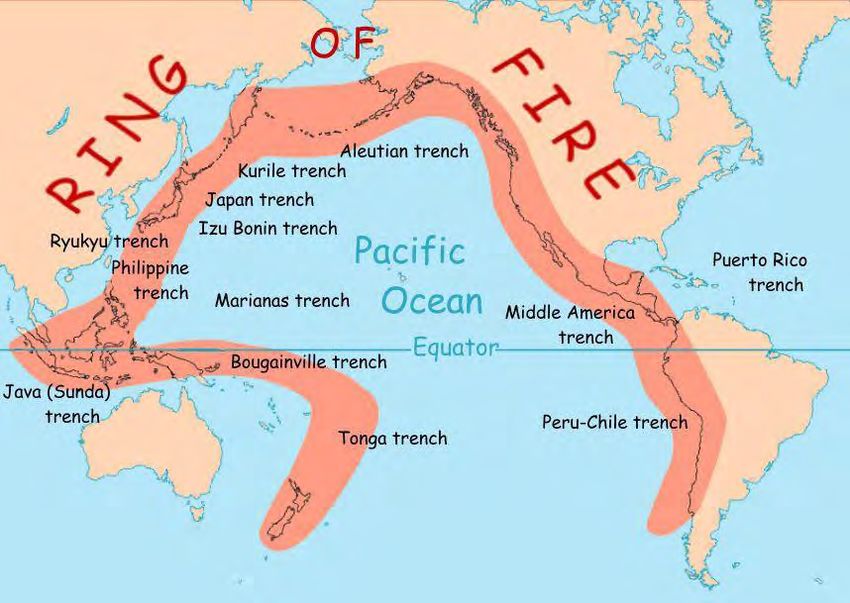
world’s most vulnerable countries. Vanuatu is located along the Pacific Ring of Fire and
tropical waters resulting in high exposure to volcanic eruptions, cyclones, earthquakes,
tsunamis, storm surges, coastal and river flooding, and landslides (Esler, 2015). The threat of
tsunami is faced by a complex mixture of threats from local, regional and distant sources
whose effects at any location in the southwest Pacific is highly dependent on variation in
seafloor shape between the source and the affected area (Thomas and Burbidge, 2008).
Figure 1: The Pacific ring of fire (National Geographic, 2018)
Vanuatu is situated along the Pacific “ring of fire”, which describes tectonic plate boundaries
with extremely active seismic zones capable of generating large earthquakes and, in some
cases, major tsunamis (Figure 1). In 1999, a magnitude 7.5 earthquake caused extensive
damage to Pentecost Island, In addition, a six-metre tsunami wave was generated that
completely devastated the village of Baie Martelli (PCRAFI 2011). These events resulted in
more than 10 deaths, over 100 injured and millions of dollars’ worth of damage. Of the 10
deaths, five were attributed to the tsunami.
Pacific Community: Geoscience, Energy and Maritime Division 2Tsunami hazard assessment, Lenakel, Tanna, Vanuatu
PCRAFI (2011) reported that Vanuatu has a 40% chance of experiencing a very strong to
severe level of ground-shaking within the next 50 years. This may damage moderate- to
well-engineered buildings and compromise structures that are built with less stringent
criteria.
Figure 2: The tectonic plates situated near Vanuatu. The New Hebrides Trench is caused by the subduction of
the Australian plate below the Pacific plate (Makin 2018).
According to Thomas and Burbidge (2008), Vanuatu has a 4.7 m maximum tsunami
amplitude with a one in 2000 year chance from the New Hebrides or Kermadec trench. The
closest subduction zone near Vanuatu is the New Hebrides Trench (Figure 2). It lies west of
Vanuatu and is a primary source of hazard for the region, as the maximum amplitudes for a
2000-year return period are significantly higher along the western shores, with values of
over 4 m on Espiritu Santo, Malakula, Efate, Erromango, Tanna and Aneityum. The eastern
shores have lower maximum amplitudes, with 1.9 m near Pentecost. At a 100-year return
period, maximum amplitudes of up to 0.6–0.7 m can be expected at some model outputs
along Vanuatu (Figure 3).
Pacific Community: Geoscience, Energy and Maritime Division 3Tsunami hazard assessment, Lenakel, Tanna, Vanuatu
Figure 3: Maximum amplitude at a 2000-year return period for all model output points (Thomas and
Burbidge 2008)
Pacific Community: Geoscience, Energy and Maritime Division 4Tsunami hazard assessment, Lenakel, Tanna, Vanuatu
3 TSUNAMI MODELLING SOFTWARE – GEOCLAW
To assess the tsunami hazard, the SPC team used the tsunami model Clawpack (version 5).
Clawpack (Conservation Laws Package) is a collection of finite volume methods for linear
and non-linear hyperbolic systems of conservations laws (Clawpack Development Team,
2018). It is an open source software (http://www.clawpack.org/) and is well maintained by
the development team.
The key feature of the model is the adaptive mesh refinement that is included in a
specialised version, GeoClaw, that is well tested for geophysical flow problems and focuses
on two-dimensional, depth-averaged, shallow-water equations for flow over varying
bathymetry (Clawpack Development Team 2018).
3.1 GeoCLAW parameters – staying conservative
While simulating the tsunamis using GeoClaw, a primary concern was ensuring that the
model was set up and run conservatively. This was done because of the lack of historical
data, which limited the ability to accurately validate and adjust the model to Lenakel. Model
parameters, such as friction coefficient, were set conservatively to allow for a safety margin.
3.2 Model validation
The tsunami model settings were validated against tide gauge observations of the 2017
magnitude 6.9 tsunamigenic earthquake that occurred 226 km southwest of Nadi, Fiji on 3
January 2017 at 21:52:30 (UTC) (Figure 4). The focal mechanism indicates a normal fault at a
depth of 15.5 km, following the direction of the ridges (35ᵒ strike), with the block on the
southeast earthquake side sliding down the fault plane (49ᵒ dip) and a −74ᵒ rake angle
(Kumar and Bosserelle 2017; USGS 2018).
Figure 4: Earthquake and tide gauge locations, adapted from the USGS earthquake hazards website (Kumar
and Bosserelle 2017)
Pacific Community: Geoscience, Energy and Maritime Division 5Tsunami hazard assessment, Lenakel, Tanna, Vanuatu Tide gauges located in Suva and Lautoka on Viti Levu, Fiji, recorded very small tsunami wave heights (
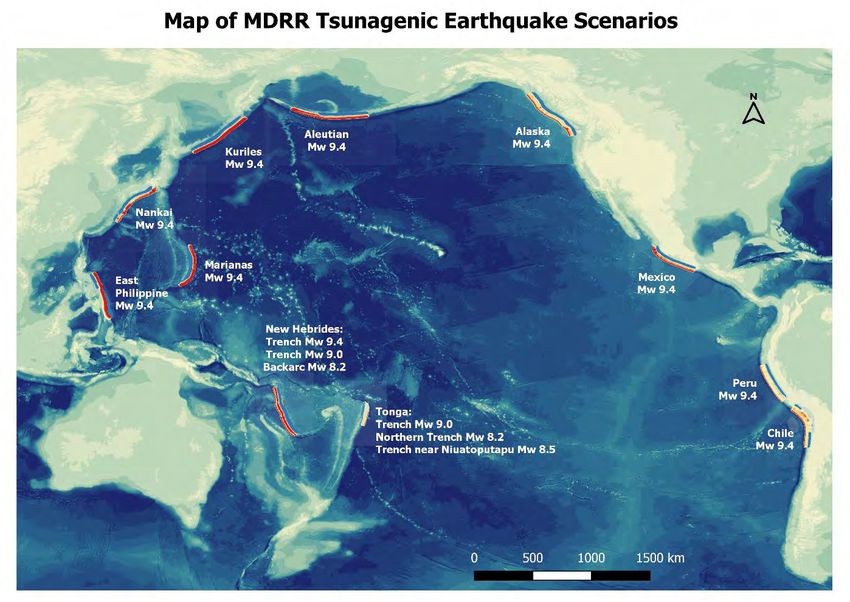
Tsunami hazard assessment, Lenakel, Tanna, Vanuatu

team therefore implemented a 10 km grid resolution to allow for the highest accuracy in the
simulation, despite increased computational costs.

  Figure 6: Comparison of the sensitivity analysis carried out on 30 km, 20 km and 10 km resolution grids

4 METHODOLOGY
The tsunami hazard assessment for Lenakel was based on a numerical model study, using
the tsunami model GeoClaw, a component of the Clawpack package
(http://www.clawpack.org/geoclaw.html). Information on how to run GeoClaw and set up
topography and earthquake deformation grids can be obtained from the website. The
topography grids used in this computation were collected using unmanned aerial vehicles
and bathymetry data were collected using multi-beam echo-sounders. A detailed account of
this process is available in Report.

The earthquake deformation grids were collected from the Mainstreaming Disaster and Risk
Reduction (MDRR) project implemented by the Vanuatu Meteorology and Geohazards
Department. The custodian for the grids was GNS Science, which provided the tsunamigenic
earthquake hazard deformation grids that were used to assemble hazard data for Port Vila
and Luganville under the MDRR project.

4.1 MDRR scenarios
An aspect of the MDRR project was the development of tsunami evacuation maps using
numerical modelling of 15 tsunamigenic earthquake scenarios that included local, regional
and distant events. The seismic events were intended to represent plausible worst case
scenarios. However, there is significant uncertainty about the mean return period of some
of the seismic scenarios modelled (Heron and Lukovic 2015).

Table 1 shows the earthquake source scenarios that were simulated under the MDRR
project with their corresponding magnitude. These scenarios were used to map tsunami

Pacific Community: Geoscience, Energy and Maritime Division                                                 7
Tsunami hazard assessment, Lenakel, Tanna, Vanuatu

evacuation maps for Port Vila and Luganville in Vanuatu. To ensure consistency, the SPC
team used the same earthquake deformation grids (provided by GNS Science) to simulate
tsunami inundation for Lenakel. Figure 7 illustrates the mapped locations of the scenarios.

  Table 1: Tsunamigenic earthquake source scenarios simulated under the MDRR project and used for this
                                      Lenakel tsunami modelling
No                               Source                                       Magnitude (Mw)
1    Alaska                                                                         9.4
2    Aleutian                                                                       9.4
3    Chile                                                                          9.4
4    East Philippine                                                                9.4
5    Kuril Islands                                                                  9.4
6    Marianas                                                                       9.4
7    Mexico                                                                         9.4
8    Nankai                                                                         9.4
9    Peru                                                                           9.4
10   New Hebrides Trench                                                            9.0
11   New Hebrides Trench                                                            9.4
12   New Hebrides Back-Arc                                                          8.2
13   Tonga Trench                                                                   9.0
14   Northern Tonga Trench                                                          8.2
15   Tonga Trench near Niuatoputapu                                                 8.5

                 Figure 7: Map of the MDRR tsunamigenic earthquake scenario locations

Pacific Community: Geoscience, Energy and Maritime Division                                              8
Tsunami hazard assessment, Lenakel, Tanna, Vanuatu
4.2 Historical tsunami
In addition, historical tsunamigenic earthquakes were investigated. Over the past 150 years,
two large tsunamis were triggered by major earthquakes on 28 March 1875 and 20
September 1920 (Ioualalen et al. 2017). Historical tsunami observations (mostly from
testimonials in missionary reports), earthquake scenarios and tsunami modelling were used
to derive the magnitudes of these historical tsunamigenic earthquakes.
In this study we chose the 28 March 1875 Mw 8.3 scenario. The earthquake deformation
grid was obtained from the Okada model and used in GeoClaw.
4.3 Sea-level rise inclusion scenarios
In addition to the 15 MDRR scenarios and an 1875 historical scenario, sea-level rise (SLR)
was considered in this assessment to ensure that flood risk of the potential evacuation
zones remains low in the decades to come. The SLR component was added to each of the 16
scenarios, resulting in a total of 32 scenarios.
The SLR projections for Vanuatu were retrieved from the Australian Bureau of Meteorology
and CSIRO (2014). Continuing the approach of being conservative, the worst case 2090 RCP
8.5 scenario was chosen. Under this scenario, the projected relative sea-level change near
Vanuatu is 42–89 cm (Figure 8). For this research, an SLR of 0.64 cm was selected.
Figure 8: Tide gauge records (purple) of relative sea-level and satellite record (green) since 1993.
Reconstructed sea-level data at Vanuatu (black) since 1950. Also, 1995–2100 multi-model mean projections
for very high (red solid line), and very low (blue solid line) emission scenarios, with 5–95% uncertainty range
in shaded red and blue regions. Range of projections for the four emission scenarios by 2100 are show by the
bars on the right (Australian Bureau of Meteorology and CSIRO 2014).
Pacific Community: Geoscience, Energy and Maritime Division 9Tsunami hazard assessment, Lenakel, Tanna, Vanuatu
5 RESULTS
The maximum simulated inundation for all 32 scenarios was calculated and inundation maps
were generated and provided to the Government of Vanuatu .
Table 2 lists 12 scenarios with the largest inundation, along with the corresponding
earthquake magnitudes. The table also lists the corresponding inundation maps for each
scenario (Figures 9–20).
Table 2: List of tsunamigenic earthquake scenarios that revealed the most inundation heights out of the 32
scenarios tested that were recorded on the Lenakel coastline from the tsunami simulation. Also provided is
the range of inundation heights and arrival time recorded with the corresponding 3D plot figure number.
Magnitude Inundation
No. Scenario Arrival time Figure No.
(Mw) heights (m)
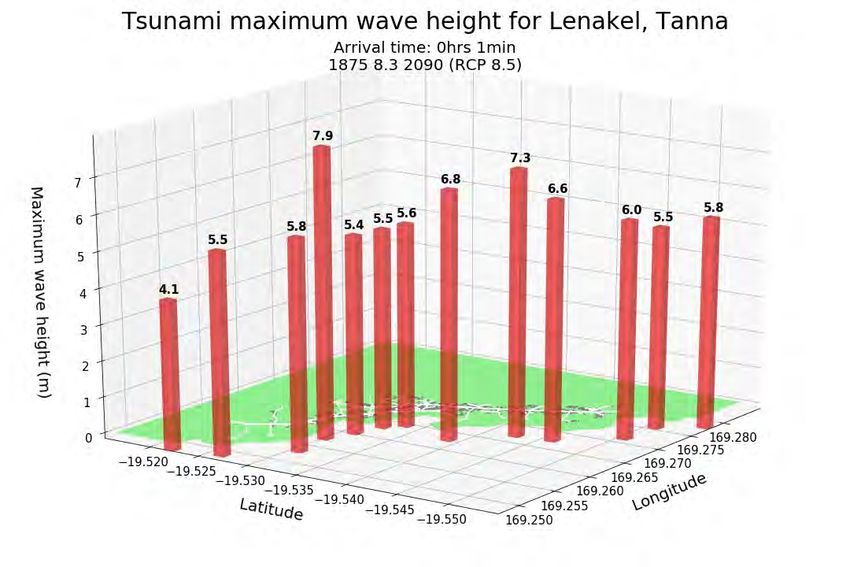
1 Historical Tsunami
8.3 3.6 – 7.2 1 min Figure 9
1875
2 Historical Tsunami
8.3 4.1 – 7.9 1 min Figure 10
1875 with SLR (2090)
3 Alaska 9.4 0.0 – 1.9 11 hrs 13 min Figure 11
4 Alaska with SLR (2090) 9.4 0.0 – 2.6 12 hrs 54 min Figure 12
5 Aleutian 9.4 0.0 – 2.5 11 hrs Figure 13
6 Aleutian with SLR
9.4 0.5 – 3.1 11 hrs Figure 14
(2090)
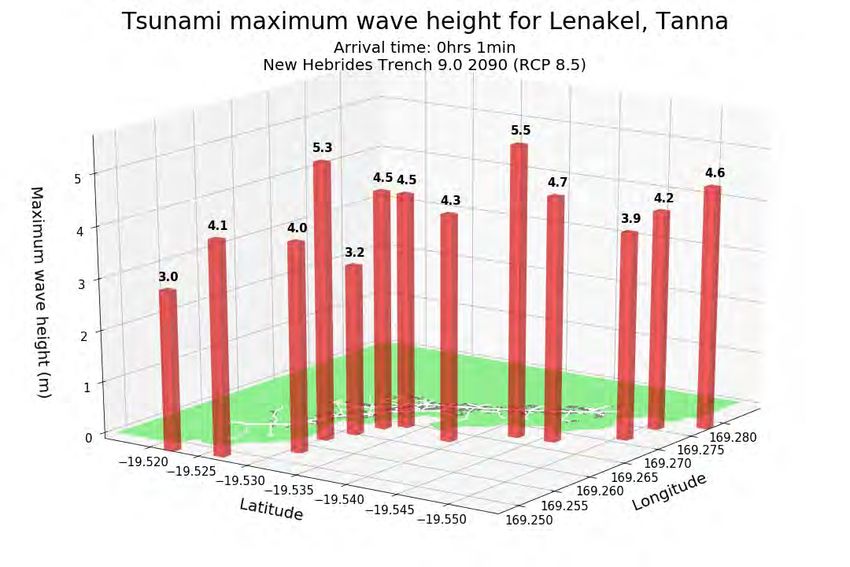
7 New Hebrides Trench 9.0 2.4 – 4.7 1 min Figure 15
8 New Hebrides Trench
9.0 3.0 – 5.5 1 min Figure 16
with SLR (2090)
9 New Hebrides Trench 9.4 17 - 20 1 min Figure 17
10 New Hebrides Trench
9.4 18 - 20 1 min Figure 18
with SLR (2090)
11 Tonga Trench 9.0 0.0 – 1.7 3 hrs 22 min Figure 19
12 Tonga Trench with SLR
9.0 0.0 – 2.4 3 hrs 22 min Figure 20
(2090)
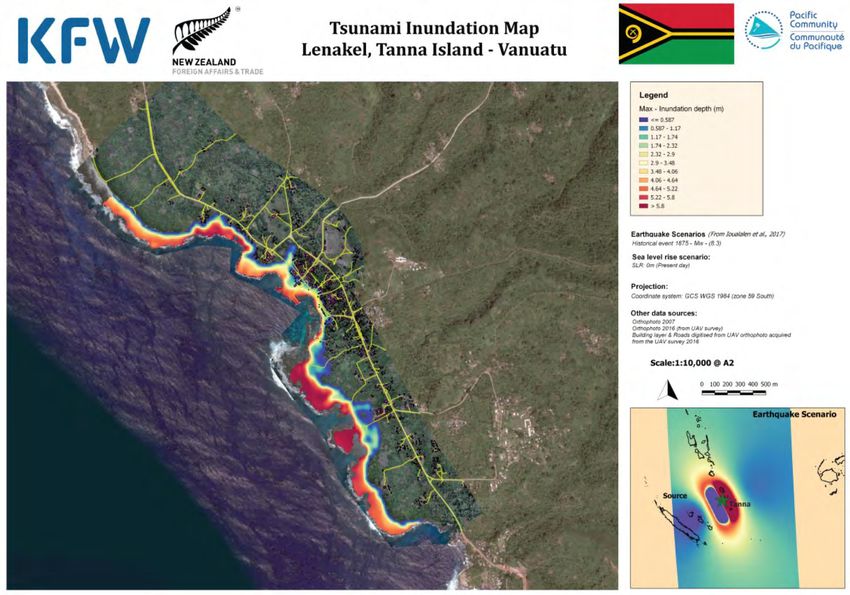
Figure 21 Tsunami inundation map of the historical tsunami in 1875, gives a template of one
the maps created for the Government of Vanuatu that was provided to them during our
workshops. It is also available at SPC upon request.
Pacific Community: Geoscience, Energy and Maritime Division 10Tsunami hazard assessment, Lenakel, Tanna, Vanuatu
Figure 9: Plot-3D of the historical tsunami 1875 inundation heights along the Lenakel coastline with the
depth (m) noted on top of the bars with the arrival time of one minute
Figure 10: Plot-3D of the historical tsunami 1875 (with 2090 sea-level rise) inundation heights along the
Lenakel coastline with the depth (m) noted on top of the bars with the arrival time of one minute
Pacific Community: Geoscience, Energy and Maritime Division 11Tsunami hazard assessment, Lenakel, Tanna, Vanuatu
Figure 11: Plot-3D of the Alaska Mw 9.4 tsunami inundation heights along the Lenakel coastline with the
depth (m) noted on top of the bars with the arrival time of 11 hours and 13 minutes
Figure 12 Plot-3D of the Alaska Mw 9.4 (with 2090 sea-level rise) tsunami inundation heights along the
Lenakel coastline with the depth (m) noted on top of the bars with the arrival time of 12 hours and 54
minutes
Pacific Community: Geoscience, Energy and Maritime Division 12Tsunami hazard assessment, Lenakel, Tanna, Vanuatu
Figure 13: Plot-3D of the Aleutian Mw 9.4 tsunami inundation heights along the Lenakel coastline with the
depth (m) noted on top of the bars with the arrival time of 11 hours
Figure 14: Plot-3D of the Aleutian Mw 9.4 (with 2090 sea-level rise) tsunami inundation heights along the
Lenakel coastline with the depth (m) noted on top of the bars with the arrival time of 11 hours
Pacific Community: Geoscience, Energy and Maritime Division 13Tsunami hazard assessment, Lenakel, Tanna, Vanuatu
Figure 15: Plot-3D of the New Hebrides Trench Mw 9.0 tsunami inundation heights along the Lenakel
coastline with the depth (m) noted on top of the bars with the arrival time of one minute
Figure 16: Plot-3D of the New Hebrides Trench Mw 9.0 (with 2090 sea-level rise) tsunami inundation heights
along the Lenakel coastline with the depth (m) noted on top of the bars with the arrival time of one minute
Pacific Community: Geoscience, Energy and Maritime Division 14Tsunami hazard assessment, Lenakel, Tanna, Vanuatu
Figure 17: Plot-3D of the New Hebrides Trench Mw 9.4 tsunami inundation heights along the Lenakel
coastline with the depth (m) noted on top of the bars with the arrival time of one minute
Figure 18: Plot-3D of the New Hebrides Trench Mw 9.4 (with 2090 sea-level rise) tsunami inundation heights
along the Lenakel coastline with the depth (m) noted on top of the bars with the arrival time of one minute
Pacific Community: Geoscience, Energy and Maritime Division 15Tsunami hazard assessment, Lenakel, Tanna, Vanuatu
Figure 19: Plot-3D of the Tonga Trench Mw 9.0 tsunami inundation heights along the Lenakel coastline with
the depth (m) noted on top of the bars with the arrival time of 3 hours 22 minutes
Figure 20: Plot-3D of the Tonga Trench Mw 9.0 (with 2090 sea-level rise) tsunami inundation heights along
the Lenakel coastline with the depth (m) noted on top of the bars with the arrival time of 3 hours 22 minutes
Pacific Community: Geoscience, Energy and Maritime Division 16vii 17
Tsunami hazard assessment, Lenakel, Tanna, Vanuatu

                                                 Figure 21 Tsunami inundation map of the historical tsunami in 1875

Pacific Community: Geoscience, Energy and Maritime Division                                                           18
6 DISCUSSION
Of the 32 scenarios, the 12 scenarios listed in Table 2 provided the largest simulated
inundation heights along the Lenakel coastline.
The largest inundation due to tsunamis generated from local earthquake zones occurred
from:
Historical 1875 Mw 8.3,
Historical 1875 Mw 8.3 with SLR (2090),
New Hebrides Trench Mw 9.0,
New Hebrides Trench Mw 9.0 with SLR (2090),
New Hebrides Trench Mw 9.4, and
New Hebrides Trench Mw 9.4 (SLR).
The regional earthquake scenarios and zones resulting in the tsunamis with the largest
inundation were:
Tonga Trench Mw 9.0, and
Tonga Trench Mw 9.0 with SLR (2090).
The distant earthquake zones were:
Alaska Mw 9.4,
Alaska Mw 9.4 with SLR (2090),
Aleutian Mw 9.4, and
Aleutian Mw 9.4 with SLR (2090).
The highest tsunami inundation resulted from the New Hebrides Trench Mw 9.4 earthquake
(both present and 2090 SLR scenarios). The 2090 SLR scenario had slightly higher inundation
heights of more than one metre in some locations along the coastline when compared to
the present sea level New Hebrides Trench Mw 9.4 scenario. However, the maximum
heights for both scenarios ranged around 18–20 m.
The highest inundation heights were observed at three locations. Figure 22 illustrates the
locations of these three points along the Lenakel coastline. The location (19.529ᵒ S,
169.260ᵒ E) had the highest inundation for tsunamigenic earthquakes that originated within
local earthquake zones (apart from the New Hebrides Mw 9.0). The third highest inundation
height location (−19.549ᵒ S, 169.277ᵒ E) was most prominent in regional and distant
tsunamigenic earthquake sources. Each of these locations has buildings approximately 250
m from the coastline and are at high risk from the tsunami run-up.
vii 19Tsunami hazard assessment, Lenakel, Tanna, Vanuatu
Figure 22: Map of the three hazardous points with the highest inundation locations for a majority of the
tsunami scenarios (red stars). The buildings (yellow) and roads (pink lines) are overlaid on a satellite imagery
of Lenakel, Tanna.
6.1 Possible evacuation routes from the maps
In addition to these tsunami hazard maps from the 32 scenarios, possible evacuation zones
may be determined and proposed to the Lenakel Town Council to ensure that evacuation
procedures are in place for possible future tsunamis.
6.2 Probabilistic tsunami hazard assessment
At the end of 2018, Geoscience Australia (2019) released a new probabilistic tsunami hazard
assessment (PTHA), providing free and open access to a database of tsunamigenic
earthquakes, including thousands of sources around the ring of fire. Furthermore, deep-
water tsunami wave propagation was computed for all scenarios and its maximum stage
recorded at key locations, named hazard points, around the Pacific region. For each hazard
point, the study also attempts to estimate the return period of the offshore tsunami wave
height.
Figure 23 illustrates the hazard curve obtained from a hazard point located off Lenakel from
the PTHA18 database. The hazard curve is shown in the diagram as an orange line with the
confidence interval marked as dashed lines. It is important to note that the estimated return
period of tsunami wave height has a high uncertainty, so it should be used only as indicative
information. The maximum stage for each MDRR scenario (red crosses), as well as for the
1875 tsunami event, is plotted against the hazard curve to provide some context. Most of
Pacific Community: Geoscience, Energy and Maritime Division 20Tsunami hazard assessment, Lenakel, Tanna, Vanuatu
the MDRR scenarios have a high likelihood with a return period less than 25 years. The
worst case scenario, a magnitude 9.4 earthquake along the New Hebrides Trench, could
have an estimated return period significantly higher than 10,000 years. Interestingly, the
return period of the 1875 tsunami event is estimated at about 2,500 years.
Figure 23: Hazard curve of the PTHA18 database with the maximum stage of the MDRR scenarios (red
crosses) overlaid on the curve (orange line). The historical scenario is labelled using a green star.
7 EVACUATION PLANNING
In October 2018, SPC, in partnership with local authorities, the Vanuatu Meteorology and
Geohazards Departments and the Tafea Provincial Office organised a two-day workshop in
Lenakel to showcase information developed as part of the project and to support the
tsunami drill exercise for Lenakel led by CARE International and the National Disaster
Management Office.
Participants at the two-day workshop, including representatives from vulnerable groups
(disabled people, women, children) school teachers, NGOs, and provincial and central
government personnel, were guided toward designing Lenakel’s evacuation routes and
locating evacuation zones.
SPC, guided by the Government of Vanuatu, used the worst case scenario (New Hebrides
Trench magnitude 9.4 scenario) as a baseline for this mapping exercise. In groups,
participants discussed the various route options and drew on transparent papers overlayed
onto the tsunami inundation map.
After each group had reported back, a consensus was found on the first draft of Lenakel’s
tsunami evacuation map (Figure 24).
Finally, the draft evacuation map was presented by a government representative to
community leaders on the Community Provincial Disaster and Climate Change Committees
Pacific Community: Geoscience, Energy and Maritime Division 21Tsunami hazard assessment, Lenakel, Tanna, Vanuatu
across Tanna to support the tsunami drill exercise that was successfully carried out on 18
October 2018.
Figure 24: Draft Lenakel tsunami evacuation map
8 CONCLUSION
A tsunami inundation hazard assessment was carried out on Lenakel, Tanna. This
assessment was part of a multi-hazard mapping component of the KfW project. The output
of this assessment was the 32 tsunami inundation hazard maps produced for Lenakel Town
Council and relevant government departments. The 32 tsunamigenic earthquake scenarios
were based on the MDRR project, inclusive of the 2090 SLR (RCP 8.5) projection. These
scenarios were simulated, using the tsunami model GeoClaw to produce the heights of the
inundation.
Furthermore, a probabilistic tsunami hazard curve was obtained from the PTHA database for
Lenakel. Indicative return periods were given to each MDRR scenario in relation to the
maximum wave height generated offshore Lenakel.
The hazard assessment was used to provide detailed inundation maps and to identify low-
risk areas for evacuation routes and centre planning. A workshop was organised, in
collaboration with the central and provincial government, to support the design of
evacuation routes. The draft evacuation routes were used as part of the tsunami evacuation
drill exercise that was successfully carried out in Lenakel on 18 October 2018.
Pacific Community: Geoscience, Energy and Maritime Division 22Tsunami hazard assessment, Lenakel, Tanna, Vanuatu
9 REFERENCES
AUSTRALIAN BUREAU OF METEOROLOGY AND CSIRO 2014. Pacific-Australia Climate Change
Science and Adaptation Planning Program. Current and future climate of Vanuatu.
Melbourne, Australia: Australian Bureau of Meteorology and CSIRO.
CLAWPACK DEVELOPMENT TEAM. 2018. GeoClaw [Online]. Available:
http://www.clawpack.org/geoclaw.html#geoclaw [Accessed October 29, 2018].
ESLER, S. 2015. Vanuatu post-disaster needs assessment: Tropical Cyclone Pam, March
2015. Port Vila: Government of Vanuatu.
GA (GEOSCIENCE AUSTRALIA). 2019. Probabilistic Tsunami Hazard Assessment (PTHA)
[Online]. Available: http://www.ga.gov.au/about/projects/safety/ptha [Accessed
February 14 2019].
HERON, D. & LUKOVIC, B. 2015. Hazard and risk maps and geo-data report: Planning for
urban prepardness (Contract No.C.06). Wellington: Beca International Consultants
Ltd.
IOUALALEN, M., PELLETIER, B. & GORDILLO, G. S. 2017. Investigating the 28 March 1875 and
the 20 September 1920 earthquakes/tsunamis of the Southern Vanuatu arc, offshore
Loyalty Islands, New Caledonia. Tectonophysics, 709: 20–38.
KUMAR, S. P. & BOSSERELLE, C. 2017. Recorded tsunami waves from 4 January 2017
earthquake (M 6.9, 221 km SW of Fiji). Suva: Pacific Community.
MAKIN, B. 2018. Down to the New Hebrides Trench again [Online]. Port Vila: Vanuatu Daily
Post. Available: http://dailypost.vu/news/down-to-the-new-hebrides-trench-
again/article_c28a4301-171c-58d4-a301-d0289789b60f.html [Accessed October 29,
2018].
NATIONAL GEOGRAPHIC. 2018. Ring of Fire [Online]. Available:
https://www.nationalgeographic.org/encyclopedia/ring-fire/ [Accessed October 29,
2018].
PCRAFI (PACIFIC CATASTROPHE RISK ASSESSMENT AND FINANCING INITIATIVE). 2011.
Country Risk Profile: Vanuatu. Available: http://pcrafi.spc.int/documents/175
[Accessed October 26, 2018].
THOMAS, C. & BURBIDGE, D. 2008. A probabilistic tsunami hazard assessment of the
Southwest Pacific Nations. Canberra: Geoscience Australia.
USGS. 2018. M 6.9 - 226km SW of Nadi, Fiji [Online]. Available:
https://earthquake.usgs.gov/earthquakes/eventpage/us10007pj6/executive#executi
ve [Accessed October 29, 2018].
Pacific Community: Geoscience, Energy and Maritime Division 23Tsunami hazard assessment, Lenakel, Tanna, Vanuatu ANNEX A: Tsunami Evacuation Planning Workshop, participant list Vanuatu Government 1. Mr Ettienne Ravo Acting SG, Tafea Province Vanuatu Email: eravo@vanuatu.gov.vu 2. Mr David Martin Tafea Provincial Planning Officer Isangel, Tanna Email: dmartin@vanuatu.gov.vu; 3. Ms Wendy Tamasi Provincial Officers DWA Email: wtamasi@vanuatu.gov.vu 4. Mr Taio Johnny NDMO Isangel, Tanna Email: tjohnny@vanuatu.gov.vu 5. Mr Sam H Kapalu Probation Officer – DOCS skapalu@vanuatu.gov.vu Lenakel Community 6. Ms Flora Nakou Secondary School Teacher Email: floranakou26@gmail.com 7. Jimmy Dick Local Store Owner Tel: 5756145 World Vision 8. Japherth Kahu Email : amonj414@gmail.com Red Cross 9. Marie Iawek Red Cross Volunteer Pacific Community: Geoscience, Energy and Maritime Division 24
Tsunami hazard assessment, Lenakel, Tanna, Vanuatu

Care International
10. Mr John Kaweil
    Logistic Officers
    Email: Jkaio.kawiel@gmail.com

11. Mr Richard Tasi
    Resilience Team Leader
    Email: RichardT@Careint.org

12. Mr Jerry Napuat
    PO Officer
    Email: Jerry.napuat@careint.org

13. Ms Sandra Sila
    Email: Sandra.Silas@careint.org

Facilitators

Pacific Communities (SPC)

14. Mr Herve Damlamian
    Oceanographer
    Email: herved2@spc.int

15. Mr Taito Nakalevu
    BSRP Project Manager
    Email: tatiton@spc.int

16. Ms Virginia (Ginny) Rokoua
    Programme Administrator
    Email: virginiar@spc.int

Vanuatu NDMO
17. Johnny Tarry Nimau
       Coordinator| PARTneR Project (Pacific Risk Tool for Resilience)
       National Disaster Management Office (NDMO) Port Vila
       Tel: 22699
       Email: Johnie@vanuatu.gov.vu

18. Mr Jeffery Kaitip
    Department of Local Authorities
    PMB 9021, Port Vila
    Email: jkaitip@vanuatu.gov.vu

Pacific Community: Geoscience, Energy and Maritime Division              25
Pacific Community
spc@spc.int | www.spc.int
Headquarters: Noumea, New CaledoniaYou can also read