Trends and Outlook 2022 - Generously supported by - NJ Center for Nonprofits
←
→
Page content transcription
If your browser does not render page correctly, please read the page content below

0

Trends and Outlook 2022

Generously supported by
1

New Jersey Nonprofits
Trends and Outlook 2022

Executive Summary
The New Jersey Center for Nonprofits conducted its annual survey of New Jersey nonprofits online
from February 25-March 14, 2022 to assess how nonprofits fared in 2021 and to gauge their outlook
for the coming year. This report is based on the 225 online responses from New Jersey 501(c)(3)
organizations submitted during the survey period.

Nonprofits overall have clearly experienced some key improvements since the worst of the
pandemic in 2020. However, a number of significant challenges and opportunities remain.

•   Demands for services and rising expenses are still outpacing funding – a longstanding
    problem with deep ramifications for delivery of programs and services in our communities.
•   Nonprofits are struggling with significant workforce shortages that threaten their ability to
    meet community needs.
•   Nonprofits also weighed in with their observations about the funding practices of their
    philanthropic partners, revealing significant opportunities to improve these vital
    relationships.
•   Incorporating diversity and equity as a permanent and intentional part of all aspects of
    nonprofit work remains critically important.

      Increased demand for services                          More nonprofits expect demand
       outpaced funding increases in                         for services and expenses to rise
                   2021                                             in 2022 than funding

                                                               81%                   79%

            61%
                                                                                                           55%
                                     48%

      Demand increased         Funding increased       Demand will increase Expenses will increase Funding will increase

            More than half of respondents with employees reported
           staff shortages, with an average vacancy rate of 21%.
                  These shortages pose significant challenges to program delivery.
2

Stronger Funding Partnerships are Needed
For many years, but particularly in the context of the pandemic, natural disasters, and the
heightened outcry for racial and social justice, funders have been urged to embrace more
flexibility and transparency in their grantmaking. Practices such as general operating support,
simplified application and reporting procedures, multi-year funding and others have been cited
as ways to level the power imbalance, advance greater equity, strengthen partnerships between
funders and their nonprofit partners, and thereby improve community impact.

Asked about these practices among their own funders, nonprofits report that only a small portion
of their funders engage in these practices with any regularity, a clear indicator of the huge
opportunity for improvement in this area. The New Jersey Center for Nonprofits and the Council of
New Jersey Grantmakers are partnering on Doing Good Better, an initiative to encourage change.
More information on this effort will be forthcoming.

Actions Taken
•   As in prior years, seeking additional resources to support their work was again the most
    common action taken by organizations, whether through new fundraising appeals, pursuing
    funding from alternative sources, adding special events or recruiting volunteers.
•   Forty percent reported that they definitely planned to resume in-person events that had
    been converted to virtual due to the pandemic.
•   More than two-thirds (70%) are operating on a hybrid basis (part in-person, part virtual).
•   Nonprofits engaged in a wide array of collaborative activities with other nonprofits to
    leverage efficiencies and impact.
•   Many organizations reported altering their programming or delivery modes in response to
    the pandemic. Organizations continued to navigate the shifts to and from remote formats,
    while others added or expanded their focus on mental health, trauma-related programming,
    and an intensified focus on diversity, equity, inclusion, and racial and social justice.

Challenges Faced by Individual Organizations
Asked to identify the issues presenting the greatest challenges to the viability of their own
organizations, nonprofits most frequently mentioned:
• financial uncertainty (46%)
• the need for a stronger board (39%)
• cannot afford enough good staff (38%)
• the need for better branding or communications (37%)
• increased benefits/insurance costs (30%)
• (Tie) increased demand for program services / need to improve diversity, equity & cultural
   competence (26%)
3 Nonprofit Sector Issues Asked about the issues most important to maintaining and improving the viability of the nonprofit sector in the coming decade, nonprofits most frequently selected: • nonprofit infrastructure/capacity building (55%) • foundation/corporate funding (53%) • attracting/retaining qualified workers (44%) • attracting/retaining capable, committed board members (42%) • diversity/inclusion/equity within nonprofits (37%) • giving and volunteering incentives (30%) Overall Outlook Nonprofits see their own overall circumstances much more positively compared to one year ago during the height of the pandemic. More than 60% said that their organizations’ overall circumstances were better than one year ago while only 13% said that they were worse. By comparison, in our 2021 survey, nearly 40% said their situations were worse than the year before and only 29% said they were better. Their outlook for the coming year was also hopeful, with 63% predicting their situation would be better one year from now, although a significant number remained uncertain about their prospects. The Importance of Investing in Nonprofits and Social Infrastructure The past two years have underscored how essential nonprofits are to our communities, to meeting critical needs and helping New Jersey and the nation come through the ongoing crises we face. Investment in key societal infrastructures – particularly historically excluded constituencies and communities of color – will be vital as we seek a strong recovery for all. The New Jersey Center for Nonprofits will continue to provide information, knowledge and advocacy to foster connections and promote constructive public policies and solutions.
4

New Jersey Nonprofits
Trends and Outlook 2022

Nonprofit landscape shows some improvement, but urgent
need for vital services persists
New Jersey’s nonprofits play a key role in strengthening the state’s social, economic, and
community fabric. Nonprofit organizations are vital contributors to the economic well-being of
the state. There are nearly 40,000 501(c)(3) organizations in New Jersey. Pre-COVID, they
employed 330,000 people—nearly 10% of the state’s private workforce—and spent about $50
billion annually, much of this in the Garden State, and enlisted the aid of 1.6 million volunteers.
The programs, services, and economic benefits provided by nonprofits are critical factors in
making New Jersey a thriving place to live and work.

New Jersey’s nonprofits have been critical throughout the COVID-19 pandemic, providing life-
saving care, social services, education, mental health counseling, job assistance and training,
comfort, healing and inspiration, and countless other critical functions.

Nonprofits have clearly experienced some key improvements since the worst of the pandemic
in 2020, and this is reflected in the survey responses. However, significant challenges and
opportunities remain.

Demand for services is outpacing funding and people served
Although many organizations that had temporarily suspended or reduced services in 2020
resumed them in some form in 2021, the survey showed continued volatility in their situations.
More than 60% of surveyed nonprofits reported that demand for services rose in 2021, but only
48% said that their funding increased in the same period. Human service, health, and
public/societal benefit organizations were most likely to report increases, while arts and cultural
organizations, many of which suffered extended periods of interrupted programming, were
more likely to report decreases.

And while not all nonprofits’ missions involve direct service to individuals, it is still useful to
compare how many reported increased demand over the past year to how many served more
people during the same period. Among those reporting higher demand in 2021, only four-fifths
said that they had served more clients/constituents.

This situation is expected to worsen in 2022. Four-fifths of organizations are predicting that
demand for their services will rise in the coming year and a similar portion are projecting
increased expenses, but only 55% expect that their funding will increase.
5

Labor Force Shortages
The workforce shortages that have been widely reported across the state and nation are hitting
New Jersey nonprofits hard, with significant implications for program and service delivery. More
than half (56%) of all survey respondents with employees reported that they are experiencing
staffing shortages, with an average vacancy rate of 21% and a total of nearly 1,300 unfilled
positions among the 90 organizations that provided estimates. Difficulty offering competitive
compensation due to budget constraints, and competition for employment from other sectors
were cited most frequently as the biggest obstacles to filling vacancies.

Trends in Funding
Total Funding 2021 vs. 2020
Forty-eight percent of respondents reported that overall funding had increased in 2021
compared with the year before – a marked improvement over 2020, but still short of the 61% of
organizations that experienced demand for services. Twenty percent reported that funding had
decreased in the past year, while 29% noted no significant change.

Breaking down these trends by type of                Funding compared to prior
funding source, funding increases were
                                                               year
reported most frequently from individual
donations, where reported increases          60%
                                                                                                 48%
outpaced flat or reduced funding by a         40%
notable margin. In many other major                                                              29%
                                              20%                                                20%
categories, increases and flat funding
                                               0%
were reported with similar frequency. As a
                                                     2017      2018      2019      2020      2021
continued reflection of cancelled,
postponed or altered events, decreases in            Increase of 5% or more

special event funding were reported by a             Decrease of 5% or more
sizeable portion of organizations. (See              No significant change (+/- 5% or less change)
chart on next page.)
6
F u n d ing C h a n g es 2 0 2 1 v s 2 0 2 0
Private foundations 28% 14% 32%
Corporate donations 19% 20% 37%
Donations from individuals 44% 19% 30%
Fees for service 20% 18% 20%
Membership dues 5% 8% 20%
Investment income 21% 6% 23%
Special events 20% 32% 17%
Planned giving 9% 4% 18%
Endowment 8% 1% 12%
United Way 1%5% 13%
Federal government 18% 6% 19%
State government 24% 4% 22%
County government 19% 4% 24%
Local government 7% 5% 19%
Bus. ventures/commercial activity 5% 7% 8%
% responses reporting funding change per category (N=198)
Increase Decrease No significant change7
Funding Outlook for 2022
As another indicator of improved Funding Outlook for the Coming Year
circumstances since the
2022 2021 2020 2019 2018 2017
pandemic’s peak, nonprofits were
more optimistic about their Increase 55% 39% 56% 49% 48% 50%
funding prospects for the coming Decrease 13% 19% 8% 13% 13% 14%
year than our 2021 survey. Fifty-five Remain the
28% 30% 31% 30% 30% 31%
percent predicted that their overall same
funding would rise in 2022, while Unknown/not
5% 12% 5% 8% 9% 5%
28% projected steady funding and reported
13% predicted decreases.
While this outlook is more positive than a year ago, these projections still trail respondents’
predictions of increased demand for services (81%) and increased expenses (79%).
Projected Funding from Specific Sources in 2022 vs. 2021
Nonprofits were more hopeful about donations from individuals than they were about funding
from any other funding source, with 51% of respondents predicting that individual giving would
rise in 2022. Respondents were also fairly optimistic that special event revenue would rise in
2022 (47% predicting increases vs. only 7% anticipating decreases and 16% predicting level
support). They were also hopeful about corporate support, with 41% projecting increased
corporate donations, though they were more evenly split in predicting increased vs. level
funding from foundations. Consistent with prior years, organizations receiving government
funds were among the least likely to predict increases from these sources in 2022, with flat
funding outweighing projected increases. Many also expressed uncertainty about their
predictions. (See chart on next page.)
Funder/Nonprofit Partnerships: A Call for Action
For many years, but particularly in the context of the pandemic, natural disasters, and the
heightened outcry for racial and social justice, funders have been urged to embrace more
flexibility and transparency in their grantmaking. Practices such as unrestricted support,
simplified application and reporting procedures, multi-year funding and others have been cited
as ways to level power imbalances, advance equity, strengthen relationships between funders
and their nonprofit partners, and improve community impact.
Asked about their experience with their own funders, fewer than 20% of nonprofits reported
that “many or most” of their funders engage in any of these practices, a clear indicator of
the huge opportunity for improvement in this area. The New Jersey Center for Nonprofits and
the Council of New Jersey Grantmakers are partnering on Doing Good Better, an initiative to
encourage change. More information on this effort will be forthcoming. (See chart, page 9.)8
P r e d ict ed F u n d ing 2 0 2 2 v s 2 0 2 1
Private foundations 36% 7% 31%
Corporate donations 41% 9% 24%
Donations from individuals 51% 9% 27%
Fees for service 27% 7% 19%
Membership dues 14% 1% 17%
Investment Income 13% 11% 22%
Special Events 47% 7% 16%
Planned Giving 15% 1% 15%
Endowment 9% 1% 12%
United Way 2%
3% 11%
Federal government 11% 7% 19%
State government 15% 7% 26%
County government 14% 5% 23%
Local government 10% 3% 18%
Business venture/commercial activity 14% 1% 10%
% responses reporting funding change per category (N=191)
Increase Decrease No significant change9
Nonprofits' Impressions of their Funders' Practices
(n=174)
Grantmaking practices align with the funder's values; values are transparent to existing or prospective grantees.
16% 44%
Internal and external commitment to advancing diversity & equity
15% 57%
Most or all grants are unrestricted (general operating support).
10% 59%
Seeks input and listens to community and grantees
7% 62%
Understands the roles of direct programs, indirect costs (overhead), and capacity building to increase impact.
6% 56%
"Right-sized" applications/reporting requirements, to limit the costs of applying for and reporting on small grants.
5% 43%
Willing to support direct programs, indirect costs (overhead), and capacity building.
5% 67%
For restricted grants, seeks to understand full project costs; includes overhead (indirect costs) as an allowable cost.
5% 48%
Provides multi-year grants.
5% 43%
Simplifying the grant application & research to place more of the burden on the funder and not the grantee.
3% 45%
Support beyond the check, e.g. capacity building assistance, referrals to other resources, in-kind volunteers, etc.
2% 59%
Shares assessments of their own work with grantees.
2% 43%
Uses third-party assessments for objective feedback.
1% 22%
Participates in funding pools, affinity groups, or other collaborations with other funders.
1% 30%
Uses results from the assessments to alter practices.
1% 24%
0% 10% 20% 30% 40% 50% 60% 70% 80% 90% 100%
Many or most of my funders already do this Some of my funders do this10
Expenses
In 2021
In a likely reflection of resumption of in-person activities and increased staff costs, half (52%) of
respondents reported that expenses had increased in 2021, up from 35% in our previous survey.
One-third (33%) reported no change, while 21% reported that expenses had decreased in 2021
compared with the prior year.
Expense Predictions for 2022 Projected Expenses in
Nearly 80% of respondents expected expenses to rise in 2022. 2022 vs. 2021
A much smaller percentage (55%) expected their total (N=211)
funding to rise in 2022. Increase 79%
Decrease 3%
Remain the same 16%
Revenue vs. Expenses in 2021 Unknown 2%
Half (51%) of respondents reported that revenues had
exceeded expenses in their most recent fiscal year, while 30% Total Income vs. Expenses
reported roughly equal revenues to expenses. Only 18% for Most Recent Fiscal
reported taking in less than they had spent, a significant Year-End
improvement from last year’s survey when 35% reported (N=212)
year-end shortfalls. Surplus 51%
Break-even 30%
Deficit 18%
Cash Reserves/Lines of Credit
Cash reserves or lines of credit can help organizations stabilize cash flow fluctuations and meet
expenses when funding payments are late or when other unexpected shortages occur. Nearly
three-quarters (74%) of survey respondents reported that they had a cash reserve (defined in
the survey as an unrestricted amount of funds set aside to provide a cushion against future
unexpected cash flow shortages, expenses or losses), and 28% reported a line of credit.
Among organizations with cash reserves, 24% reported having a reserve of 1-3 months of
operating funds; 30% reported 3-6 months' worth; and 43% reported over six months of
operating funds. Nearly half (47%) indicated that their cash reserve remained relatively
constant over the past year, 39% said that their reserve was larger, and 14% said it was smaller
at the end of 2021. By comparison, in our prior survey a year ago, 39% had indicated their cash
reserve had remained stable and 29% said their cash reserve was smaller than the year before.11 Among organizations with lines of credit, 43% reported having to borrow against the line of credit in 2021 (up from 31% who reported borrowing in last year’s survey). Forty-four percent of respondents with a line of credit indicated that it was "essential" or "very important" to their organizations' continued ability to provide core programs and services. Organization Reactions to Emerging Trends As in prior years, seeking additional resources to support their work was again the most common action taken by organizations, whether through new fundraising appeals, pursuing funding from alternative sources, adding special events or recruiting volunteers. Forty percent reported that they definitely planned to resume in-person events that had been converted to virtual due to the pandemic. And while operating virtually is not feasible for a number of nonprofit programs and organizations, 70% of respondents reported that they are operating in some form of hybrid fashion, with some functions being conducted remotely and others in person. About one-fifth (22%) are operating fully in person, and 8% are fully remote. (See chart on next page.)
12

                                  Organization Reactions to Current Trends
                              Initiated new fundraising appeals

                         Sought funds from alternative sources

                          Introduced/increased fees for service

                                      Canceled a special event

                                          Added a special event

                               Converted major event to virtual

Resumed a major event in person that was suspended or virtual

                                Postponed fundraising appeals

                                                        Cut staff

                                      Restored laid off positions

                                                     Added staff

         Reduced staff hours (incl. short work weeks, furloughs)

                                           Increased staff hours                              Might do in 2022

                                         Froze/Reduced salaries
                                                                                              Definitely will do in 2022
                                  Restored previous salary cuts
                                                                                              Have already done
                     Raised salaries (above any pre-cut levels)

                                    Reduced employee benefits

                                   Increased employee benefits

                                            Curtailed programs

                                               Added programs

                            Entered a partnership/collaboration

                             Ended a partnership/collaboration

                                              Explored a merger

                                           Completed a merger

                           Permanently closed the organization

                Started new bus. venture or for-profit subsidiary

        Ended a bus. venture or dissolved a for-profit subsidiary

     Increased advocacy for org funding, field, or constituency

                                 Recruited additional volunteers

                                 Reduced number of volunteers

                                                                    0%     10%       20%        30%           40%          50%

                                                           % Responses Indicating Type of Action (N=179)
13 Partnerships/Collaborations Partnerships are prevalent in the nonprofit community generally, and this was especially true in this year’s survey. Respondents reported a wide variety of collaborations, including a partnership to promote family literacy; a partnership with a community college and nonprofit to provide high school equivalency training to youths who age out of foster care without a high school diploma; public/private partnerships to combat food insecurity; county health departments partnering with houses of worship for vaccine clinics; joint fundraising and events; advocacy coalitions; and many others. Forty-one percent indicated that they were considering new partnerships for 2022. Seventeen percent said that they might, or definitely would, explore a merger in 2022 and 9% said that they definitely would or might complete one. Changes in Program/Service Focus Many organizations reported altering their programming or delivery modes in response to the pandemic. Organizations continued to navigate the shifts to and from remote formats, while others added or expanded their focus on mental health, trauma-related programming, and an intensified focus on diversity, equity, inclusion, and racial and social justice. Issues Facing New Jersey’s Nonprofits Respondents were asked to identify which issues, aside from funding, presented the greatest challenges to the viability and effectiveness of their individual organizations, and to select the five issues that they felt were most important to improving the viability of the nonprofit sector in the coming decade. Respondents’ choices for the top issues were a clear reflection of the challenges of the past year. Individual Organizations Asked to identify the issues presenting the greatest challenges to the viability of their own organizations, nonprofits most frequently mentioned financial uncertainty (46%). This was followed by the need for a stronger board (39%), staffing costs, branding and communications, the need to improve diversity, equity and cultural competence, and the rising demand for program services.
14

                Challenges to Organization Viability/Effectiveness

                                Financial uncertainty                                                        46%

                             Need for stronger board                                                   39%

                    Cannot afford enough good staff                                                  38%

           Need for better branding/communications                                                   37%

                  Increased benefits/insurance costs                                           30%

             Increased demand for program services                                        26%

Need to improve diversity/equity/cultural competence                                      26%

                      Cannot find enough good staff                                      25%

                          Need for strategic planning                                    24%

                            Low organization visibility                                23%

          Improve partnerships with other non-profits                              21%

Need to increase advocacy/public policy involvement                              18%

                    Need for leadership development                          18%

                                   COVID-19 recovery                         18%

                Need for new technology/equipment                          15%

        Need to evaluate organizational effectiveness                      15%

                             High employee turnover                        15%

              Improve p'ships with for-profits or gov't                    15%

                        Need for technology training                 12%

              Need for training other than technology           9%

                                                 Other     5%

            Decreased demand for program services         4%

                                                                % responses per item (N=179)
15
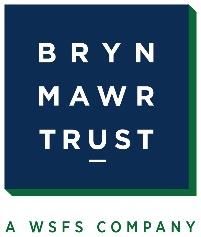
Nonprofit Sector Issues
Nonprofit infrastructure/capacity building was cited by 55% as the most pressing nonprofit
sector issue, followed closely by foundation and corporate funding (53%), attracting and
retaining qualified workers (44%) and capable board members (43%), and diversity, inclusion
and equity within nonprofits (42%).
Most Important Issues in Maintaining and Improving the Non-Profit Sector
in the Next Decade
Non-profit infrastructure/capacity building 55%
Foundation/corporate funding 53%
Attracting/retaining qualified workers 44%
Attracting/retaining capable, committed… 42%
Diversity/inclusion/equity within non-profits 37%
Giving and volunteering incentives 30%
Federal funding/federal budget 28%
State fiscal policy/state budget 27%
Improving public understanding about non-… 27%
COVID-19 recovery 18%
Reducing competition between non-profits 18%
Civil society/civic engagement 17%
Access to technology 17%
Paperwork reduction (reducing red tape) 15%
Non-profit advocacy/lobbying rights 14%
Ensuring non-profit… 14%
Insurance and liability 9%
Restoring public trust in non-profits 8%
Charitable registration/solicitation laws and… 8%
Contracting 7%
Taxation/tax reform 6%
Reducing competition from for-profits 5%
Other 3%
Privatization 0%
% Responses per Item (N=183)16
Diversity & Equity
Any examination of the nonprofit landscape demands continued attention and action to
address deep-seated inequities and years of under-investment in critical systems and
historically excluded communities, and particilarly communities of color. These inequities have
exacerbated the impact of the pandemic and the associated economic effects.
While the current landscape is challenging for nonprofits across the board, there are notable
distinctions in the survey responses from organizations that reported that they primarily serve
communities of color compared with those that don’t.
• Organizations that primarily serve communities of color comprised a greater proportion of
“front-line” nonprofits such as those in human services.
• They were more likely to report that expenses had risen in the prior year, and more likely to
predict that demand for services would rise in the coming year, although equal
percentages of both groups reported that demand had risen in 2021, and funding lagged
behind expenses and demand for services.
• They were more likely to report that expenses had exceeded revenues in their most recent
fiscal year, and slightly less likely to report a year-end surplus.
• They were less likely to report a cash reserve, and months of cash on hand were smaller
overall among organizations that primarily serve communities of color than among those
that don’t.
• Organizations serving communities of color were less likely to have suspended services,
even temporarily, due to the pandemic.
As we noted in last year’s report, a number of underlying factors contribute to these trends,
including the heightened human needs and disparate impact of the virus and economic
consequences on people of color; and the
greater likelihood that human service and NJ Nonprofits Identifying
other front-line organizations derive more of Diversity/Equity/Inclusion as one of the
their revenues from government, where Top 5 Issues
funding often fails to cover the full costs of 100%
providing services, among others.
80%
But with heightened and overdue focus over
the last two years on systemic racism, and 60%
given the longstanding underrepresentation
40%
37%
of people of color in nonprofit leadership 26%
and philanthropic decisionmaking circles, it 20%
is critical that these issues not be swept
aside, and that they remain front-focused 0%
for all organizations.
For the NP Sector Overall For my Organization17
Overall Circumstances and Outlook
Comparison with One Year Ago
Nonprofits see their own overall circumstances much more positively compared to one year
ago during the height of the pandemic. More than 60% said that their organizations’ overall
circumstances were better than one year ago while only 13% said that they were worse. By
comparison, in our 2021 survey, nearly 40% said their situations were worse than the year before
and only 29% said they were better.
How nonprofits view their circumstances vs. one year ago
70%
63%
60% 61%
53%
50% 49%
40% 39%
38%
34%
32%
30% 29%
28%
24%
20%
14% 14% 13%
10% 11%
0%
2017 2018 2019 2020 2021
Actual - Better Actual - No Change Actual - Worse
Outlook for 2022
Nonprofits’ outlook for the coming year was also hopeful, with 63% predicting their situation
would be better one year from now, although a significant number remained uncertain about
their prospects.18 The Importance of Investing in Nonprofits and Social Infrastructure The past two years have underscored how essential nonprofits are to our communities, to meeting critical needs and helping New Jersey and the nation come through the ongoing crises we face. Investment in key societal infrastructures – particularly historically excluded constituencies and communities of color – will be vital as we seek a strong recovery for all. The New Jersey Center for Nonprofits will continue to provide information, knowledge and advocacy to foster connections and promote constructive public policies and solutions.
19

   Background and Methodology
   The New Jersey Nonprofit Issues and Trends Survey is conducted annually by the New Jersey Center
   for Nonprofits in order to gauge trends, experiences and views of our state’s nonprofit community.

   The Center conducted this year’s survey online in late February and early March 2022 to assess how
   nonprofits fared in 2021 and to determine their outlook for the coming year. An email announcement
   with a link to the survey was sent to approximately 4,500 subscribers of the Center’s email list plus viral
   redistribution, and additional outreach was made via social media (Facebook, Twitter, LinkedIn and
   Instagram), nonprofit listservs, and to funders or other umbrella organizations serving nonprofits in the
   state. All communications encouraged recipients to share the survey notice/instrument broadly within
   their own networks. The 225 responses from New Jersey 501(c)(3) organizations that were submitted as
   of March 14, 2022, were included in this analysis.

   Who participated in the survey?
   This report is drawn from responses of the 225 New Jersey 501(c)(3) organizations that completed the
   survey from February 25-March 14, 2022. The graphs below show the distribution of the nonprofits’
   mission focus, geographical location, and budget size.

                  Annual Operating Budget                                              Primary Service Focus
                                 (N=225)                                                          (N=225)
                $50,000 to                   $200,000 to                                           Education,
               199,999, 12%                  499,999, 13%                       Arts, Culture,                    Public,
                                                                                                      10%
                                                                                Humanities,                      Societal
            Under                                                                     15%                       Benefit, 14%
                                                     $500,000 to
          $50,000, 16%
                                                      $999,999,
                                                         14%             Environment
           Over $20
                                                                         Animals, 5%
           million, 3%                                                                                               Health, 10%

            $10 million
              to $20                                                            Religion-         Human
                                               $1 million to
            million, 7%                                                        related, 1%       Services,
                                                  $2.499
                              $2.5 million                                       Other, 0%         43%
              $5 million to                    million, 18%
                               to $4.99
               9.9 million,
                              million, 9%
                   8%

          Geographic Location
                                                                   Respondents’ Primary Office Location by County
            of Organizations
                                                    Atlantic           2.2%         Gloucester         0.9%     Ocean               14.2%
North                          35%
                                                    Bergen             5.3%         Hudson              3.1%    Passaic              1.8%
Central                        39%
                                                    Burlington         2.7%         Hunterdon          0.4%     Salem               0.0%
South                          26%
                                                    Camden             4.4%         Mercer             12.4%    Somerset            4.4%

                                                    Cape May           0.4%         Middlesex          4.9%     Sussex               1.3%

                                                    Cumberland         0.9%         Monmouth           16.9%    Union               4.4%

                                                    Essex              12.0%        Morris              7.1%    Warren              0.0%
The New Jersey Center for Nonprofits is the statewide network, champion and go-to resource for
and about our state’s nonprofits. For 40 years, the Center has provided advocacy, knowledge, insights
and tools so nonprofits can focus on the communities and causes they serve. We strengthen
nonprofits individually and collectively by:
Championing and Advocating for the nonprofit community as an indispensable part of the social,
economic and equitable well-being of New Jersey and its residents.
• Comprehensive information about New Jersey nonprofits
• Advocating for nonprofits in Trenton and Washington
• Communicating the value of nonprofits through public education
• Documenting nonprofit trends through surveys and research reports
• Uniting our state’s nonprofits around common goals
Advancing Knowledge and promoting learning to foster effective, equitable and ethical
organizations for the public good.
• High quality management and compliance information
• Expert phone and email consultation – priority access for members
• Timely online and email news and articles
• Affordable professional development training and recorded webinars on timely topics
• Customized training
Convening and Fostering Connections between and among nonprofit organizations and their
champions, as well as partners in government and for-profit business, to enhance collective strength.
• Our “don’t miss” annual New Jersey Nonprofit Conference
• Issue briefings/town halls/local or regional strategic convenings around common issues
• Issue-specific task forces
• Amplifying the learnings, programs and educational offerings of others
• Member Mondays – Informal discussion, networking and strategy sessions for members
Helping Nonprofits Stretch Scarce Resources
• Cost-saving programs: D&O insurance, unemployment trust, payroll, and more
• High-traffic nonprofit jobs board – free postings for members
• Discounts on Center events, workshops and publications for members
• Leveraging nonprofits’ dollars by serving as the first-stop resource for nonprofit expertise,
information, services and referrals
To find out more or to get involved, visit njnonprofits.org, or email us at center@njnonprofits.org.
New Jersey Center for Nonprofits
3635 Quakerbridge Road, Suite 35 | Mercerville, NJ 08619
732 227 0800 | fax: 732 227 0087
njnonprofits.org | center@njnonprofits.orgYou can also read