Training students in Python programming skills and WPS wrapping for geoprocessing tasks by using examples of less commonly applied thematic ...
←
→
Page content transcription
If your browser does not render page correctly, please read the page content below
AGILE: GIScience Series, 2, 15, 2021. https://doi.org/10.5194/agile-giss-2-15-2021
Proceedings of the 24th AGILE Conference on Geographic Information Science, 2021.
Editors: Panagiotis Partsinevelos, Phaedon Kyriakidis, and Marinos Kavouras.
This contribution underwent peer review based on a full paper submission.
© Author(s) 2021. This work is distributed under the Creative Commons Attribution 4.0 License.

Training students in Python programming skills and WPS
wrapping for geoprocessing tasks by using examples of less
commonly applied thematic mapping methods
Christian Sterna (corresponding author) and Gertrud Schaaba
christian.stern@h-ka.de, gertrud.schaab@h-ka.de
a
    Faculty of Information Management and Media, Karlsruhe University of Applied Sciences, Karlsruhe, Germany

Abstract. Python programming and the application of                               Application Programming Interfaces (API) functional
web services technology can be considered important                               components can be assembled to run complex
skills for geomatics students when looking for                                    geoprocessing tasks (Zhao et al., 2012). The standards for
employment later. A course on Web Processing Services                             spatial content and associated services are developed by
(WPS) as part of the International Geomatics master                               the Open Geospatial Consortium (OGC). Its non-
programme at Karlsruhe University of Applied Sciences                             propriety web mapping approach is based on open
takes this into consideration while using the opportunity                         interfaces, encoding and schemas. The interface Web
of making students aware of less-known thematic                                   Processing Service (WPS) enables to describe a service
mapping methods. Students are introduced to automating                            that provides geoprocessing functionalities to be executed
a complex geoprocessing task and finally wrapping it into                         in a web environment (Rautenbach et al., 2012). In order
a WPS. It is achieved by following the phases of first                            to successfully teach students how to apply Python
conceptualizing the single steps before then using ArcGIS                         programming and/or how to make use of WPS for
ModelBuilder and Python scripts in combination to build                           geoprocessing different approaches are followed.
the processing chain. The alternate band map method                               Institutions of higher education build on integrating e.g.
serves as example in the hands-on exercise. Later students                        problem-based learning (Deng and Di, 2008), game-
are asked to automate the generation of the geometries for                        based approaches (Priyaadharshini et al., 2019) or their
the map face and/or map legend supporting other thematic                          own e-learning tools (Javed et al., 2013) in traditional
mapping methods like the square density map or the                                classroom teaching.
absolute value raster map. The paper discusses the
                                                                                  Building on Service-Oriented Architecture (SOA) to
teaching approach and experiences made so far.
                                                                                  support web services which automatically generate
Conceptualizing the automatization of a given complex
                                                                                  thematic maps is receiving increased attention for two
geoprocessing problem proved to be the most challenging
                                                                                  reasons: the many geoportals with their potential to
part for the students.
                                                                                  visualize the manifold data which is already stored in
Keywords: service-oriented web cartography, geo-                                  Spatial Data Infrastructures (SDI) (Cerba and Cepicky,
processing web service, alternate band map, square                                2012; Kraak et al., 2018; Zepner et al., 2020) and the new
density map, absolute value raster map                                            challenges encountered for analyzing big geospatial point
                                                                                  data supported by intelligent visualization (Coetzee and
                                                                                  Rautenbach, 2017; Gröbe and Burghardt, 2017; Pillay et
1 Introduction and Background                                                     al., 2019). Thematic cartography has been a focus of
                                                                                  university training at Karlsruhe University of Applied
Python is an object-oriented scripting language that is                           Sciences (HKA) from early on (Schaab, 2014). Nowadays
appreciated for being readable and thus easy to reuse and                         teaching students in the necessary programming and
maintain. Its general-purpose kind renders it useful in                           software development skills may be considered of higher
almost all fields of science and industry. It is said to boost                    importance, which however is not necessarily the easier
the developers’ productivity because they have to write                           task. In Jan 2014 HKA received the Esri Developer Center
less code and do not need to compile the code (Lutz,                              (EDC) label. Here we aim at server applications supporting
2013). Web service technology supports interoperability                           correct and appealing visualization. Hence, the question
by common standards and the accessibility to and sharing                          arose how to motivate students to get a grip on
of distributed resources in the internet. Through the use of                      programming while still conveying knowledge on

                                                                                                                                      1 of 10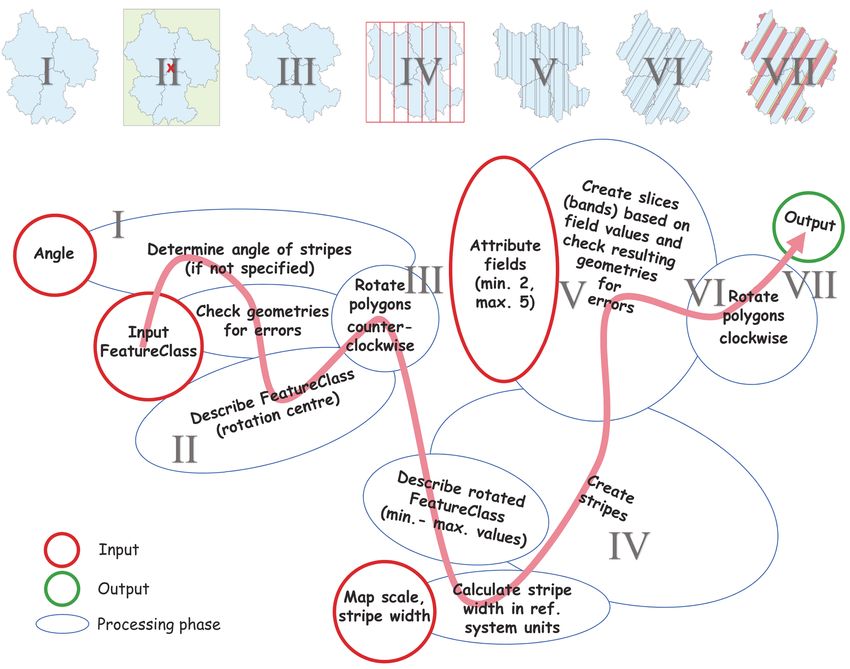
sophisticated thematic cartography. After an initial                    gramm, translating to ‘square raster areal diagram’, by
workshop with students in May 2015, a new course on                     M. Bürgener, 1957). It allows for an appropriate
WPS was introduced to the International Geomatics master                depicting of minorities and majorities in their true
programme (start: summer semester 2018). It aims at                     location, while visually revealing the proportions as
imparting knowledge on implementing cartographic web                    stated in the statistics. Not being an aerial diagram map,
services, which deliver the required map face geometries                but using the absolute method while offering relative
and legend building blocks to be applied in the design of               information at the same time, for this the dot density
thematic maps.                                                          map (Tyner, 2010) is known but not necessarily the
                                                                        square density map (Dichtequadratmethode by F.
Using SOA and applying web services in cartography
                                                                        Scharner, 1958). The latter works with grid cell areas
started with extending the symbolizing and labelling
                                                                        instead of dots, is visually pleasing and can benefit from
capabilities of Styled Layer Descriptor (SLD) and
                                                                        an increased visual impact. In comparison to the
Symbology Encoding (SE) for the OGC Web Services
                                                                        standard classified choropleth maps, there is no loss of
(i.e. WMS, WCS and WFS) (e.g. Dietze and Zipf, 2007;
                                                                        information because it does without classes. The
Sae-Tang and Ertz, 2007; Iosifescu-Enescu et al., 2010).
                                                                        inventor of the method points to the necessity of certain
By wrapping existing or new geoprocessing function-
                                                                        legend elements for adding understanding to the map
ality in a WPS and chaining the tasks, the limitations of
                                                                        method.
the standards can be overcome and more sophisticated
and diverse thematic map products can be generated                      Having elaborated on the setting and background of the
(e.g. Cerba and Cepicky, 2012; Rautenbach et al., 2012;                 topic, in the following section 2 the teaching approach is
Zeng et al., 2013; Krimbacher, 2014; Moncrieff et al.,                  described, also in comparison to others. Section 3 takes
2016). For an automated, parallel processing of                         the example of one particular thematic map method to
distributed big geospatial data, the software design                    demonstrate the prototypic solving of the geoprocessing
pattern approach can be used to produce a series of                     task as a web service. In section 4 we present and discuss
thematic map designs which employ only those                            the other methods which have been tackled by students so
cartographic representation methods which are                           far and conclude on our teaching approach.
appropriate depending on the input data characteristics
(Coetzee and Rautenbach, 2017).
                                                                        2 Teaching Methods
For mapping areal distributions of quantitative area-related
characteristics, the choropleth, dasymetric and chorodot                The field of information and communication technology
map methods are widely used. All apply the relative                     (ICT) poses ever and fast evolving developments. At
method based on standardized data but use different                     HKA we want to prepare geomatics students to be
reference units. They typically visualize census data on                capable of taking on the resulting chances and
very limited basemaps, require an equal-area map                        challenges. It requires the students to be trained in the
projection and the consideration of an appropriate data                 most modern methods, techniques and technologies. At
classification (e.g. Slocum et al., 2010). But what about               the same time students are required not to lose grip with
other areal cartographic methods which allow the                        the old but still valid, i.e. well-established, meth-
representation of proportions (sections) making up a topic,             odologies which have proven to be beneficial in data
of spatial variation within enumeration units or offering               analysis and visualization. In times of “Big Data” an
absolute and relative information at the same time?                     increasing amount of statistical data, too, is readily
Common to areal diagrams is that the entire map face is                 available from nearly everywhere and at any time. It
subdivided according to the percentages of the                          asks for experts who know how to facilitate the breaking
characteristics of the depicted variable (Kraak and                     down and packaging of data into understandable
Ormeling, 2010). The alternate band map (Poidevin,                      information for everyone.
1989) uses equal-sized stripes, distinctly partitioned into             Opinions and approaches vary of how to train the future
slices (bands) per enumeration unit, which form                         experts in the application of Python and/or geo-
distinctive categories but need to represent and add to                 processing services. Priyaadharshini et al. (2019) regard
100% (i.e. the method visualizes sections). However, an                 traditional classroom teaching in programming as boring
alternate band map does not provide information on the                  and monotonous due to the lack of interaction. They state
geographical distribution or spatial pattern within the                 that learners expect new teaching techniques, digital
reference units. In contrast, this is the case for the                  working tasks and continuous motivation-pushing
absolute value raster map (Quadratraster-Flächenkarto-

AGILE: GIScience Series, 2, 15, 2021 | https://doi.org/10.5194/agile-giss-2-15-2021                                        2 of 10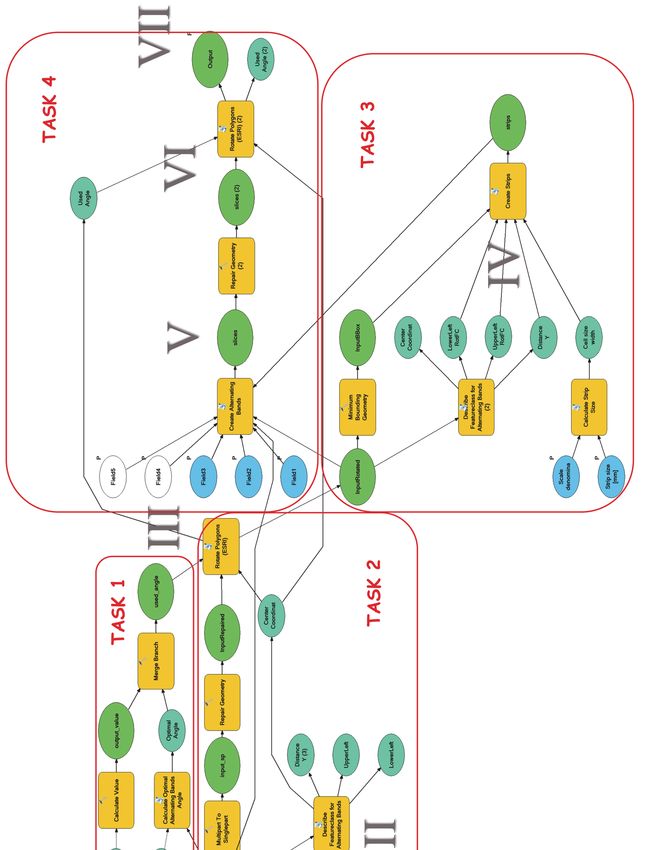
assessments of their results. Thus they embark on a                     assignment where each student has to choose a different
mixture of game-based learning and traditional classroom                task from a given list. The tasks are of varying level of
teaching for their Python programming lectures. At the                  difficulty to also challenge those students who have
Department of Geomatics of Stuttgart University of                      already a high affinity to programming. The common
Applied Sciences a WPS Teaching Tools Collection was                    focus of the tasks is the programmatically direct
set up for self-studies in an interactive e-learning                    manipulating of geometries while creating a well-
environment. It aims at supporting understanding of                     documented scripting tool for the ArcGIS Platform. After
scope, definition and deployment of WPS without having                  that, about a third into the semester, the focus starts to
to expose the students to handle technical or                           change from mere teaching of Python/ArcPy towards
programming details (Javed et al., 2013). The GeoBrain                  introducing WPS and the concept of the geoprocessing
project was initially developed to foster the use of                    web. The necessary background is achieved by jointly
NASA’s geospatial data by scientists and general users                  studying the OGC Web Services Common Standard
and to allow for transforming the data into information                 (Whiteside and Greenwood, 2010), the OpenGIS Web
and knowledge by means of web services (Di, 2004). It                   Processing Service Standard (Schut, 2007) and the paper
resulted not only in an extension offering the GRASS GIS                by Zhao et al. (2012). On the cartography side, a short
functionalities as web services (Qiu et al., 2012), but                 overview or repetition of in particular areal representation
offers online resources for educational purposes in                     methods for thematic maps is included, which also covers
geospatial science and engineering (Deng and Di, 2008).                 the example of the alternate band map being of relevance
Deng and Di report that GeoBrain helped to improve the                  later. The last component, for a change again as a small
teaching effectiveness in traditional classroom teaching as             hands-on session, is the setting up a simple WPS on the
well as in problem-based learning regarding WPS use in                  ArcGIS Platform using an Esri tutorial.
a cloud-based environment. Our approach for teaching
                                                                        Next the alternate band map method is used as an
Python and WPS within a single course aims at a versatile
                                                                        example for learning how to go about creating a WPS.
problem-based learning environment.
                                                                        Over a couple of teaching units, this WPS is first jointly
It all started after discussions with master students on                conceptualized, then implemented via coding and finally
curriculum development, in which the students expressed                 published. The units are based on an elaborate hands-on
the wish to learn Python. Now the programming language                  exercise worked on together with all students in the lab.
is being taught in the second semester of the International             Details regarding the steps involved are presented in
Geomatics master study programme as part of a lecture                   section 3. Approximately the last third of the semester is
on Web Processing Services (WPS) covering 2 SWS (2                      filled by project group work on a specific task of again
contact ‘hours’ of 45 min per week, i.e. 30 in total). As               conceptualizing, programming and publishing a WPS
Tab. 1 shows, the course starts with an emphasis on                     rooted in thematic cartography. The group members (2
Python, but gradually evolves towards a focus on WPS.                   to 3 students) are responsible for subdividing the work
At the beginning a short introduction to the Python                     and assigning the tasks as well as for organizing a
programming language is provided. It is meant to                        successful project management. Similar to the student
harmonize the level of knowledge within the usually                     assignments, also here the students need to make their
rather heterogeneous group of students: students from                   coding available as well as to prepare a documentation.
abroad mix with students who followed the geodata-                      In parallel, each student has to look for and study a piece
related Python programming course within their bachelor                 of literature on the application of WPS, WPS chaining
studies on Geo-Information Management at HKA. Basics                    or other advancements of the geoprocessing web.
such as data types and structures and a comparison                      Reporting about it by means of a lightning talk ensures
between Python versions 2.x and 3.x are covered. It is                  that every student participant gains at least an idea of the
followed by an introduction to the ArcPy module of the                  current state-of-the-art regarding WPS. A demonstration
ArcGIS Platform, which allows access to its                             of how to chain two WPS helps to illustrate web service
geoprocessing resources. First small geoprocessing                      orchestration and concludes the outlook.
scripting tools for ArcGIS are programmed by the
                                                                        The results of student assignment, project work and
students to ensure practical experience.
                                                                        lightening talk form the basis for assessing the students’
To provide for more advanced and later-on required                      performance. Feedback is provided and decisions made
Python/ArcPy programming skills, concepts like cursors                  of who of the students is ready to sit the written exam. It
and methods for directly manipulating features and                      concludes the course and allows to mark each student’s
geometries are introduced and tested. It leads to a first               performance individually.

AGILE: GIScience Series, 2, 15, 2021 | https://doi.org/10.5194/agile-giss-2-15-2021                                          3 of 10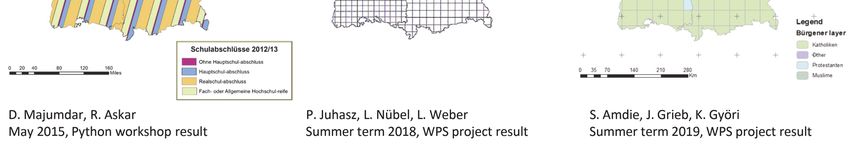
Data and Software Availability                                          originally compiled for the Python workshop, were taken
                                                                        from Esri’s Data and Maps 2012 (accessible to Esri
The data, software and computational infrastructure used                users). The statistical data stems from the Federal
in the teaching course can be summarized by referring to                Statistical Office of Germany (https://www-genesis.
the ArcGIS platform, which is available to members of                   destatis.de; for the data license by-2-0 see https://www.
the university. Python 2.7 (https://www.python.org) and                 govdata.de/dl-de/by-2-0). The teaching material and
the ArcPy library of ArcGIS Desktop 10.x are used to set                coding scripts are not shared, because it would defeat the
up geoprocessing chains as ArcGIS ModelBuilder tools.                   teaching aim and require the consent of the students.
Wrapped as a WPS the geoprocessing chain is published
to a standalone ArcGIS Server at Karlsruhe University of
Applied Sciences, which is available within the university              3. The Alternate Band Map Method as a WPS
network and runs on a virtual machine with Windows
Server 2012 R2. It is planned to switch to ArcGIS Pro and               The alternate band map method was chosen for use as
the Python 3.x environment soon. The spatial data, as                   the hands-on teaching example: it is rarely known, is
Table 1: Content of the course on Web Processing Services as part of the International Geomatics master programme at
Karlsruhe University of Applied Sciences.

AGILE: GIScience Series, 2, 15, 2021 | https://doi.org/10.5194/agile-giss-2-15-2021                                        4 of 10
easy to understand and implement by students while                      The conceptual phase of setting-up the WPS usually starts
being not too trivial, and provides a convincing output.                with a blank map of enumeration units (e.g. regions of
An example of an alternate band map is provided in Fig.                 France) on a sheet of paper and some tabular statistical
3 to the left. It is based on statistical data of school                data accommodating the cartographic representation
graduation types attained for the German states. The                    method already. Having been introduced to the map
data requires to be standardized, i.e. expressing relative              method before, the students are asked to sketch the
values, which sum up to 100 % per enumeration unit. In                  alternate band map method for some of the areal units.
the process of creating the alternate bands, the map                    They should take notes about the requirements and rules
maker has to familiarize with the data first (e.g. checking             applied for producing such a map. In the next step, the
out minimum and maximum values). Next, decisions are                    students are asked to think about automating the process.
required on the direction and width of the stripes which                What input is needed? What are the required parameters?
determine the partitioning of the map face. The decision                Are there also optional parameters? These are example
for the stripes’ orientation is a compromise between the                questions which describe the determining of the WPS’s
overall orientation of the enumeration units and the fact               input. Next the processing of the spatial data needs to be
that stripes being placed in cardinal direction are visually            conceptualized, which always turns out to be the most
most appealing (Arnberger, 1997). The stripe’s width is                 difficult part for the students. Ideas of how to break down
determined by the number of slices (bands) and their                    the task need to be developed, which requires to think
minimum values to be visualized. Here the rule applies                  outside the box. Finally, the output needs to be described
that each stripe must be displayed in its entire width at               which again appears as an easy task after the demanding
least once per enumeration unit (ibid.).                                interim steps have been solved.

Figure 1: Conceptual model for geoprocessing the spatial geometries for an alternate band map based on GIS functionality.
Roman numerals link the illustrations of the processed geometries to the workflow. The arrangement of the workflow reflects
the ArcGIS ModelBuilder diagram in Fig. 2.

AGILE: GIScience Series, 2, 15, 2021 | https://doi.org/10.5194/agile-giss-2-15-2021                                         5 of 10
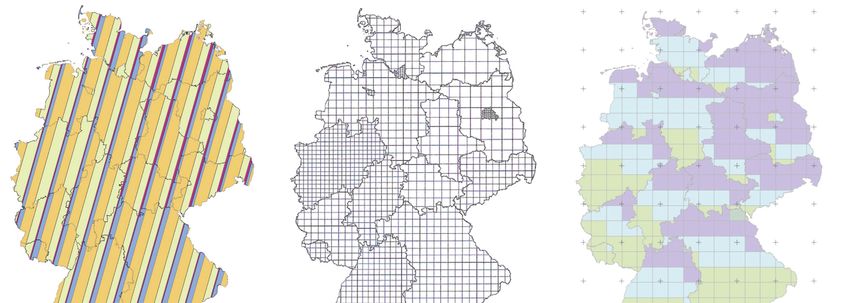
Fig. 1 visualizes the final concept including sketches of               to learn how to branch in a model, how to create scripting
the processed geometries. Required input parameters to                  tools, and how to call tools from within Python code. They
the Alternate Bands WPS are the input geometries                        are asked to make extensive use of the ArcGIS Online Help
(polygons) of the enumeration units, at least two attribute             and to use other resources, too. Starting with smaller tasks,
fields with statistical data (allowing for up to three                  in step IV the students are asked to code a complete script.
additional fields), the scale of the resulting map and the              After documenting the resulting model tool by means of
desired stripe width in millimetres. The angle defining the             metadata and after a thorough testing in ArcGIS locally, the
orientation of the stripes is regarded optional and calculated          process is published as a WPS to ArcGIS Server. The
automatically based on the spatial input data if not                    Alternate Band WPS service can then be used by the
specified. All this covers the initial step (I) of the processing       students for designing their own maps (see e.g. Fig. 3, left).
chain. For calculating the ‘optimal angle’ of the stripes, the
average main orientation of all polygons is determined via
the Minimum Bounding Geometry functionality and a                       4. Discussion and Conclusions
value of 90 (degrees) subtracted to obtain the orthogonal
direction. As such it remains for now a simple solution only            Fig. 3 shows examples of student work on thematic
with further optimization potential. Additionally, the input            cartography WPS during the initial workshop or semester
geometries are “repaired” in case that they do not follow               courses. The alternate band map method (Fig. 3, left)
Esri’s feature geometry specifications. In the second step              provides a visually appealing result, although two
(II) the input feature class is “described” in order to                 disadvantages remain: The method does not provide
determine the rotation centre, which serves as input to the             information on the actual location and spatial distribution
next action (step III). Here the geometries are rotated                 within the reference units. Care has to be taken on how to
counterclockwise based on the ‘optimal angle’. This                     place the stripes, because it depends on the reference units’
approach helps to simplify the upcoming calculations,                   sizes and shapes as well as their overall arrangement if the
especially when generating the slices (bands) within the                stripes and their slices are equally often represented
stripes. The ‘describe’ functionality is run once more, this            (Arnberger, 1997). The WPS could be further improved:
time for deriving the minimum and maximum coordinates                   more tricky parts are still waiting for a solution like the
of the bounding box extent. These variables are needed for              automated determination of a threshold for the minimum
the creation of the stripes in the subsequent processing step           proportion to be depicted, of the ‘optimal angle’ for the
(IV). The stripes can be easily achieved by creating a                  stripes by considering the shape of the enumeration units
fishnet by means of the respective ArcGIS tool. The most                more closely, of the optimal stripe width depending on the
complicated step is reached with action V. Here, the stripes            size of the enumeration units, the map scale and the
per polygon feature need to be sliced (subdivided)                      statistical data, and the automatic creation of a meaningful
according to the relative values stored in the attribute table          legend layer. Still also missing is a proper documentation
and specified as input parameters (via the field names). In             and the sharing of the service, which will only make sense
an iterative process, per polygon feature the stripes are split         when we will have moved on to using a different hands-on
into smaller slices (bands) and then intersected with the               exercise during the master course on WPS.
polygon feature’s geometry. In the final processing step                In case of the square density map (Fig. 3, centre) one
(VI), the resulting geometries are also repaired in case that           wonders why this method is not more commonly used.
the newly created polygons do not follow the specifications             By replacing each dot symbol of a grid-based dot density
and then rotated based on the ‘optimal angle’. Rotation is              map with a square, dot densities are transformed into
done clockwise to finally generate the output feature class             square densities with the advantage of representing one
ensuring its correct spatial positioning (VII). Colouring of            density dot by two sides of a density square. It increases
the bands is not part of the processing chain.                          the visual impact by more black ink and thus facilitates
Fig. 2 (see Appendix) reveals that the hands-on exercise for            the distinction of even small differences (Scharner,
a complex geoprocessing task performed on the ArcGIS                    1958). As the student example of the WPS output
Platform requires a splitting of the processing chain in                reveals, also here it becomes evident that automatically
tasks. I.e. the students are handed over an incomplete                  creating a legend (or at least the required geometries) as
model based on a ModelBuilder tool and incomplete                       part of the overall WPS (see e.g. Zeng et al., 2013) is as
Python scripts. For each task, learning aims are defined and            important as creating the features for the map face. It
the target what to achieve is set. Due to the combined use              will help to avoid misleading legends and thus
of the ModelBuilder and Python coding, the students need                misinterpretation of maps by the map users. The need
                                                                        for automating also the creation of a legend is

AGILE: GIScience Series, 2, 15, 2021 | https://doi.org/10.5194/agile-giss-2-15-2021                                            6 of 10
highlighted by Chua and Vande Moere (2017) and Jenny scripting language which is easy to understand, is portable
et al. (2010). between operating systems and open-source and provides
many popular third-party libraries and applications built
The absolute value raster map presented in Fig. 3 to the
on top of it (Lutz, 2013), the students get the chance of
right shows that the entire map face is subdivided by a
becoming part of its big and active user and developer
grid of equal-sized squares. It leads to the same absolute
community. Being confronted with OGC specifications
area value per grid cell throughout but different
and gaining experience in setting-up web services, the
proportions per grid cell because their numbers vary per
concept of Software as a Service (SaaS) becomes all of a
enumeration unit. The optimal size of the grid cells
sudden approachable. In our course on WPS, the
depends on the map scale, the average reference unit size
automation of processes plus making them available/
and the demand of depicting a given scattered
sharing them with others is linked to the fast evolving
distribution (Bürgener, 1957). This mapping of the
field of service-oriented web cartography by generating
geographical distribution within the enumeration units
map face geometries and legend layers. They can serve as
was not realized by the students. A solution could be to
input in straight-forward browser-based visualization
integrate a dasymetric modelling approach (see Mileu
tools of open data portals (Kraak et al., 2018) but also in
and Queirós, 2018 for an overview on GIS-based
graphically more enhanced map visualizations derived by
dasymetric mapping tools), which the students failed to
means of Desktop Mapping (DTM) or by focusing on
realize. For none of the three thematic mapping
dynamic interactive features (as in traditional web
methods, which we tackled together with our students so
mapping). In combination, all this adds to the motivation
far, we are aware of an automated solution.
of the students.
Students’ programming assignment work can only very
Instead of mixing game-based learning and traditional
sometimes be considered ready for sharing as final
classroom teaching (Priyaadharshini et al., 2019), for
products. However, working on these prototypes can act
teaching we follow a problem-based learning approach
as an eye-opener to a wider pool of cartographic
to keep the students connected to the subject and
visualization options as compared to what the students are
interested. Interlinked with teaching how to set-up and
aware of. They also learn how to get around the
use WPS as a state-of-the-art technology in service-
limitations of only applying standard GIS software
oriented architectures, we teach them programming with
functionality but experience the power of automating
Python by means of a complex hands-on exercise on a
geoprocessing tasks. By programming in Python, a
challenging cartographic task that helps to visualize
Figure 3: Student results of so far implemented thematic cartography WPS based on statistical data for Germany’s states: an
alternate band map on school graduation types attained in 2012/13 (left), a map face on population density 2011 depicted by
the square density method (centre), a map on religious affiliations 2011 based on the absolute value raster method but being
implemented only partially (right).
AGILE: GIScience Series, 2, 15, 2021 | https://doi.org/10.5194/agile-giss-2-15-2021 7 of 10statistical data. It works, although Javed et al. (2013) Cartography and Geographic Information Science.,
point to the limitation for hands-on exercises on WPS 44:5, 390–409, https://doi.org/10.1080/15230406.
due to the generally complex use cases. Similarly, the 2016.1174623, 2017.
educational material offered by the GeoBrain project
Coetzee, S. and Rautenbach, V.: A design pattern
(Deng and Di, 2008) focuses on using WPS in a cloud-
approach to cartography with big geospatial data, The
based environment and not on how to set-up and
Cartographic Journal., 54:4, 301–312, https://doi.
program WPS. Also our teaching falls short, this in
org/10.1080/00087041.2017.1400199, 2017.
regard to fully introducing WPS chaining.
Deng, M. and Di, L.: GeoBrain online resources for
The approach of teaching Python and WPS within a single
supporting college-level data-intensive geospatial
course integrates theoretical knowledge (taught by the
science and engineering education, IGARSS 2008
lecturer or presented by students) of established methods
proceedings, Boston (MA), IV, 7-11 Jul 2008, 443–446,
(thematic cartography) and new techniques (web
https://doi.org/10.1109/IGARSS.2008.4779753, 2008.
services), hands-on programming exercises (geo-
processing web services) as well as independent Di, L.: GeoBrain – A web services based geospatial
individual and group work (accommodating different knowledge building system, https://geobrain.csiss.gmu
knowledge/experience levels). This versatility in teaching .edu/geobrainhome/docs/Geobrain_Webservice.pdf
means, in topics, techniques and methods covered, plus (accessed 26.02.2021), 2004.
asking students to elaborate solutions for overlooked, i.e. Dietze, L., and Zipf, A.: Extending OGC Styled Layer
not yet solved tasks, is considered to drive the students’ Descriptor (SLD) for thematic cartography. Towards the
motivation. The course works closely with what the ubiquitous use of advanced mapping functions through
ArcGIS Platform offers, while a different module of the standardized visualization rules, 4th International
International Geomatics master programme is dedicated Symposium on LBS and Telecartography proceedings,
to open source software tools in the GIS field. In future Hong Kong, 8-10 Nov 2007, https://www.geog.uni-
we plan to make use of ArcGIS Notebooks (based on heidelberg.de/md/chemgeo/geog/gis/thematic-sld.lbs-
Jupyter Notebooks) for accommodating the hands-on telecarto2007.pdf (accessed 26.02.2021), 2007.
exercises. Most challenging to our students proved to be
the conceptualization phase of independently finding Gröbe, M. and Burghardt, D.: Micro diagrams: a multi-
solutions for the automatization of a given complex scale approach for mapping large categorised point
problem as specified in the student project, which requires datasets, AGILE 2017 proceedings, Wageningen, 9-12
in-depth study of examples and related publications. May 2017, 128, https://agile-online.org/conference_
paper/cds/agile_2017/shortpapers/128_ShortPaper_in_
PDF.pdf (accessed 13.01.2021, 2017.
References Iosifescu-Enescu, I., Hugentobler, M. and Hurni, L.:
Web cartography with open standards – A solution to
Arnberger, E.: Thematische Kartographie mit einer
cartographic challenges of environmental management,
Kurzeinführung über EDV-gestützte Kartographie und
Environmental Modelling & Software., 25, 988–999,
Quellen der Fernerkundung, 4th ed., Westermann
https://doi.org/10.1016/j.envsoft.2009.10.017, 2010.
Schulbuchverlag, Braunschweig, 1997.
Javed, R., Lehmkühler, H. and Behr, F.-J.: Teaching
Bürgener, M.: Das Quadratraster-Flächenkartogramm,
tools for web processing services, Applied Geoinfor-
In: E. Meynen (ed.), Geographisches Taschenbuch.
matics for Society and Environment 2013 proceedings,
Jahrweiser zur Deutschen Landeskunde 1956/57, Franz
Ahmedabad, 16-19 Dec 2013, 399–404,
Steiner Verlag, Wiesbaden, 466–471, 1957.
http://publishing.applied-
Cerba, O. and Cepicky, J.: Web services for thematic geoinformatics.org/downloads/AGSE_2013_Proceedin
maps, In: M.P. Peterson (ed.), Online maps with APIs gs_AGSE_Publishing.pdf (accessed 26.02.2021), 2013.
and WebServices, Lecture Notes in Geoinformation and
Jenny, B., Hutzler, E. and Hurni, L.: Self-adjusting legends
Cartography, Springer-Verlag, Berlin Heidelberg, 141–
for proportional symbol maps, Cartographica., 44:4, 301–
155, https://link.springer.com/chapter/10.1007/978-3-
304, https://doi.org/10.3138/carto.44.4.301, 2010.
642-27485-5_10, 2012.
Kraak, M.-J. and Ormeling, F.: Cartography: visualization
Chua, A. and Vande Moere, A.: BinSq: visualizing
of spatial data, 3rd ed., Prentice Hall, Harlow, 2010.
geographic dot density patterns with gridded maps,
AGILE: GIScience Series, 2, 15, 2021 | https://doi.org/10.5194/agile-giss-2-15-2021 8 of 10Kraak, M.J., Ricker, B. and Engelhardt, Y.: Challenges https://www.isprs-ann-photogramm-remote-sens-spatial-
of mapping sustainable development goals indicators inf-sci.net/I-4/163/2012/ (accessed 04.01.2021), 2012.
data, ISPRS International Journal of Geo-Information.,
Sae-Tang, A. and Ertz, O.: Towards web services dedicated
7, 482, https://doi.org/10.3390/ijgi7120482, 2018.
to thematic mapping, OSGeo Journal. (FOSS4G 2007
Krimbacher, A.: Service-oriented architecture for proceedings, Victoria, 24-27 Sep 2007), 3, 31–34,
thematic cartography on the web, Master thesis, Eid- https://journal.osgeo.org/index.php/journal/article/view/14
genössische Technische Hochschule Zürich, Institute of 0/106 (accessed 26.02.2021), 2007.
Cartography and Geoinformation, http://www.ika.
Schaab, G.: Der Wandel in der Kartographie-Ausbildung
ethz.ch/studium/masterarbeit/2014_krimbacher_report.
an der Hochschule Karlsruhe, Gemeinsame Tagung der
pdf (accessed 22.12.2020), 2014.
DGfK, der DGPF, der GfGI und des GiN proceedings,
Lutz, M.: Learning Python, 5th ed., O’Reilly, Beijing Hamburg, 26-28 Mar 2014, 226, https://www.
Köln, 2013. dgpf.de/src/tagung/jt2014/proceedings/proceedings/pape
rs/Beitrag226.pdf (accessed 01.03.2021). 2014.
Mileu, N. and Queirós, M.: Development of a QGIS
plugin to dasymetric mapping, FOSS4G Conference Scharner, F.: Ein Beitrag zur Frage der Dichtedar-
proceedings, Guimarães, 29-31 Aug 2018, 18, 9, stellung in Kartogrammen. Allgemeines Statistisches
https://doi.org/10.7275/3628-0a51, 2018. Archiv., 42, 125–139, 1958.
Moncrieff, S., Turdukulov, U. and Gulland, E.-K.: Schut, P. (ed.): OpenGIS web processing service, OGC
Integrating geo web services for a user driven explor- document 05-007r7, http://portal.opengeospatial.org/
atory analysis, ISPRS Journal of Photogrammetry and files/?artifact_id=24151 (accessed 01.03.2021), 2007.
Remote Sensing., 114, 294–305, http://dx.doi.
Slocum, T.A., McMaster, R.B., Kessler, F.C. and Howard,
org/10.1016/j.isprsjprs.2016.01.015, 2016.
H.H.: Thematic cartography and geovisualization, 3rd ed.,
Pillay, L., Schaab, G., Coetzee, S., and Rautenbach, V.: Pearson Prentice Hall, Upper Saddle River (NJ), 2010.
A comprehensive workflow for automating thematic
Tyner, J.A.: Principles of map design. The Guilford
map geovisualization from univariate big geospatial
Press, New York (NY), 2010.
point data. 29th International Cartographic Conference
proceedings, Tokyo, 15–20 Jul 2019, https://doi.org/ Whiteside, A. and Greenwood, J. (eds.): OGC web
10.5194/ica-proc-2-100-2019, 2019. services common standard, OGC document 06-121r9,
http://portal.opengeospatial.org/files/?artifact_id=38867
Poidevin, D.: La carte – moyen d’action. Guide
(accessed 01.03.2021), 2010.
practique pour la conception et la réalization de cartes,
Ellipses, Paris, 1989. Zeng, X., Du, Q., Ren, F. and Zhao, F.: Design and
implementation of a web interactive thematic carto-
Priyaadharshini, M., Natha Mayil, N., Dakshina, R.,
graphy method based on a web service chain, Boletim
Sandhya, S. and Bettina Shirley, R.: Learning analytics:
de Ciências Geodésicas., 19:2, 172–190, https://
game-based learning for programming course in higher
doi.org/10.1590/S1982-21702013000200002, 2013.
education, Procedia Computer Science., 172, 468–472,
https://doi.org/10.1016/j.procs.2020.05.143, 2019. Zepner, L., Jirka, S., Schulte, J., Sauer, P.,
Darabisahneh, B., Possienka, R. and Mäs, S.: Datensatz-
Qiu, F., Ni, F., Chastain, B., Huang, H., Zhao, P., Han,
orientierte, automatische Auswahl raum-zeitlicher
W. and Di., L.: GWASS: GRASS web application
Visualisierungen. Eine nutzerfreundliche und effiziente
software system based on the GeoBrain web service,
Visualisierung offener raumzeitlicher Daten der
Computers & Geosciences., 47, 143–150, https://
mCLOUD, https://mviz.geo.tu-dresden.de/images/
doi.org/10.1016/j.cageo.2012.01.023, 2012.
mVIZ-Leitfaden.pdf (accessed 24.02.2021), 2020.
Rautenbach, V., Coetzee, S., Strzelecki, M. and Iwaniak,
Zhao, P., Foerster, T. and Yue, P.: The geoprocessing
A.: Results of an evaluation of the orchestration
web, Computers & Geosciences., 47, 3–12,
capabilities of the ZOO project and the 52° North
http://dx.doi.org/10.1016/j.cageo.2012.04.021, 2012.
framework for an intelligent geoportal, ISPRS Annals of
the Photogrammetry, Remote Sensing and Spatial
Information Sciences. (XXII ISPRS Congress procee-
dings, Melbourne, 25 Aug – 01 Sep 2012), I-4, 163–168,
AGILE: GIScience Series, 2, 15, 2021 | https://doi.org/10.5194/agile-giss-2-15-2021 9 of 10Appendix
Figure 2: The ArcGIS ModelBuilder diagram for creating the spatial geometries
for an alternate band map as used in teaching Python programming as part of
setting-up a WPS. Roman numerals link to the descriptive workflow in Fig. 1.
AGILE: GIScience Series, 2, 15, 2021 | https://doi.org/10.5194/agile-giss-2-15-2021 10 of 10You can also read