TRAINING CNN CLASSIFIERS SOLELY ON WEBLY DATA
←
→
Page content transcription
If your browser does not render page correctly, please read the page content below
JAISCR, 2023, Vol. 13, No. 1, pp. 75 – 92
                                                                                 10.2478/jaiscr-2023-0005

TRAINING CNN CLASSIFIERS SOLELY ON WEBLY DATA

                                     Dominik Lewy, Jacek Mańdziuk∗

                                 Faculty of Mathematics and Information Science,
                                        Warsaw University of Technology,
                                     Koszykowa 75, 00-662 Warsaw, Poland
                                        ∗ E-mail:   mandziuk@mini.pw.edu.pl

                           Submitted: 24th March 2022; Accepted: 19th October 2022

                                                       Abstract

             Real life applications of deep learning (DL) are often limited by the lack of expert labeled
             data required to effectively train DL models. Creation of such data usually requires sub-
             stantial amount of time for manual categorization, which is costly and is considered to be
             one of the major impediments in development of DL methods in many areas. This work
             proposes a classification approach which completely removes the need for costly expert
             labeled data and utilizes noisy web data created by the users who are not subject matter
             experts. The experiments are performed with two well-known Convolutional Neural Net-
             work (CNN) architectures: VGG16 and ResNet50 trained on three randomly collected
             Instagram-based sets of images from three distinct domains: metropolitan cities, popu-
             lar food and common objects - the last two sets were compiled by the authors and made
             freely available to the research community. The dataset containing common objects is
             a webly counterpart of PascalVOC2007 set. It is demonstrated that despite significant
             amount of label noise in the training data, application of proposed approach paired with
             standard training CNN protocol leads to high classification accuracy on representative
             data in all three above-mentioned domains. Additionally, two straightforward procedures
             of automatic cleaning of the data, before its use in the training process, are proposed.
             Apparently, data cleaning does not lead to improvement of results which suggests that the
             presence of noise in webly data is actually helpful in learning meaningful and robust class
             representations. Manual inspection of a subset of web-based test data shows that labels
             assigned to many images are ambiguous even for humans. It is our conclusion that for the
             datasets and CNN architectures used in this paper, in case of training with webly data, a
             major factor contributing to the final classification accuracy is representativeness of test
             data rather than application of data cleaning procedures.
             Keywords: Classification, webly data, InstaFood1M, InstaCities1M, InstaPascal2M

1   Introduction                                             2010-2011, when shallow methods were used, to
                                                             less than 5% in 2015 with the use of deep learn-
    In recent years applications of deep learning to         ing (DL). For reference, this result is below human
computer vision have moved the field substantially            level accuracy error of 5.1% [40]. This advance-
towards human-level performance. A great exam-               ment was possible mainly due to large publicly
ple of this trend are the results of ILSVRC (Ima-            available annotated datasets like ImageNet [40] or
geNet Large Scale Visual Recognition Challenge)              COCO [29]. Creation of such datasets requires sub-
that plummeted from more than 25% top-5 error in             stantial amount of time for manual categorization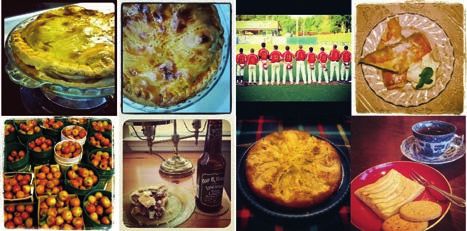
76                                                                                 Dominik Lewy, Jacek Mańdziuk

which is costly and is considered to be one of the          photos of metropolitan cities, images of popular
greatest impediments in DL models development in            dishes and images presenting common objects.
many areas.
    DL efficiently tackles a great number of com-         1.2 Related literature
puter vision tasks like image categorization [24, 43,        Despite certain approaches to classification
47, 17], object detection/localization [36, 37, 42],     with scarce availability of expert labeled data, like
image segmentation [16, 41, 12], or image caption-       One-shot Learning/Few-shot Learning, e.g. [2, 50,
ing [3].                                                 11], synthetic data generation [8, 15, 20, 53, 45],
                                                         Transfer Learning [54], or using expert labeled data
1.1 Main contribution                                    to guide the learning process [48, 18], the problem
     In this work we experimentally verify the effi-      of training deep neural networks in the case of a
cacy of an approach to training Convolutional Neu-       complete lack of expert labeled samples is not a
ral Network (CNN) classifiers on noisy web images         common research topic.
annotated by the users (presumably their authors)             Our approach relies on the use of large quanti-
who, in many cases, do not assign appropriate la-        ties of data downloaded from the internet. Clearly,
bels (annotations), as they are not obliged to follow    the usage of webly data in DNN training is not a
any particular set of labeling rules. In popular non-    new concept. For instance, in [32] web data is uti-
expert domains (such as city or nature landmarks,        lized in the CNN training, though augmented with
food, monuments, cars, etc.) the availability of such    a certain category supervision process. Another
loosely-tagged images in the Internet is abundant.       class of algorithms called Multiple Instance Learn-
Hence it is interesting and potentially promising to     ing [56, 31, 9] relies on weakly-supervised learning,
verify to which extent relying solely on webly data      with labels assigned not to individual images but to
in the training process may still lead to high-quality   groups of images. Yet another work assumes ex-
classifiers. In summary, the main contribution of         istence of some “easy images” (i.e. characteristic
this work is threefold:                                  and well-framed images on a light background) [7],
 – Demonstrating the effectiveness of a standard         which are used to pre-train the network before noisy
    approach to training a CNN image classifier with      images appear.
    no use of expert labeled data or human expertise         Some methods use a mixture of expert-labeled
    of any kind, based solely on non-expert labeled      and noisy samples in the training process, which
    data (downloaded from the web users accounts)        is generally the most common scenario of utiliz-
    with high amount of label noise. The underly-        ing web data in classification tasks, e.g. [51, 33,
    ing claim is that CNN classifiers despite being       4, 49, 52, 5]. Another way of web data utiliza-
    trained on noisy-labeled data may accomplish         tion is its application as a means of model pre-
    meaningful classification accuracy when tested        training [30, 46, 21].
    on class-representative samples.
                                                             Two streams of research explicitly addressing
– Creation of two webly datasets: a food-related         the presence of noise in the data refer to the outliers
  one (InstaFood1M [26]), composed of 1 million          handling by either filtering or label purification [1,
  images (10 categories, each with 100 000 sam-          5, 55], and decreasing the outliers impact on the
  ples) and the other one, depicting common ob-          training process by adjusting the weights [28, 34],
  jects (InstaPascal2M [27]), composed of 2 mil-         respectively.
  lion images (20 categories, each with 100 000              The method proposed in this paper differs from
  samples). Both datasets were created by down-          the above-cited accomplishments by taking ran-
  loading images from Instagram. The latter              domly collected web data as is, with no further
  one is a webly counterpart of PascalVOC2007            manual modification of any kind. The webly data
  dataset [10]. Both sets are freely available for       is used directly in the training process without em-
  research purposes.                                     ploying auxiliary expert labeled images or specific
– Experimentally proving the efficacy of proposed         training setting.
  approach in three distinct domains: landmark
TRAINING CNN CLASSIFIERS SOLELY ON . . .                                                                    77

    The two papers closest to our research are [19,      put data labeling and representativeness of test im-
23] which also use webly data for CNN training.          ages. Additional experiments aimed at automatic
Our work differs from [19] in that in [19] a robust      cleaning of the data (with no human assistance) are
linear regression algorithm is trained on top of the     presented in Section 5. Conclusions and directions
features extracted by a CNN, while our method uses       for future work are discussed in the last Section.
a fully trainable CNN for both visual feature gener-
ation and classification. In [23] the authors take a
curriculum learning approach and enhance webly           2 Proposed approach
data training by using Google queries, which are
                                                             Our goal is to develop high accuracy classifiers
considered to be “easy images” [7].
                                                         trained solely on photo images collected from web
    Our method refers to the idea of Transfer Learn-     pages of randomly selected Internet users. This type
ing (TL) [54], which has recently become a com-          of data includes relatively high percentage of non-
mon aspect of the vast majority of deep CNN ap-          representative images (e.g. a photo of a city park or
plications. TL is often realized with the help of one    a sand beach) and dubious or erroneous labels (e.g.
of the well-know large CNNs pre-trained on a large       a selfie with a cat in an apartment which is labeled
dataset (ImageNet [40] or COCO [29]). Such a pre-        as “New York city”).
trained deep CNN is used as a starting point for al-
                                                            On a general note the proposed approach can be
most any image related problem.
                                                         characterized as follows (the details are provided in
    In the view of non-expert knowledge approach         Section 3):
proposed in the paper, besides initialization based
on ImageNet, we have also tested CNN training            – Automated data collection by means of down-
with random weight initialization to make sure             loading images from random web pages based
that the proposed approach is capable of extract-          on respective category hashtags.
ing meaningful patterns and does not simply rely on
features developed during ImageNet pre-training.         – Automated data cleaning with no need of human
While both scenarios differ in the speed of learn-         expert involvement.
ing (ImageNet based initialization visibly shifts up
the starting accuracy), in terms of ultimate accu-       – Using a pre-trained CNN architecture in the
racy, the advantage of domain-based initializa-            training process on the above noisy web data.
tion compared to learning from scratch is mini-
mal (section 3.7.2 presents the details).                – Accuracy assessment on class-representative
                                                           images.
    One of the datasets used in our experiments
(Instacities1M [13]) was previously utilized in the
work related to embedding images in text specific
vectors, like Glove or word2vec [14]. In [14]
those embeddings were used to enhance the im-
age retrieval quality. Our research objectives and
proposed solution methods are clearly non over-
lapping with [14]. The other two datasets (In-             Figure 1. Flowchart of the proposed approach,
staFood1M [26] and InstaPascal2M [27]) were pre-            with obligatory and optional steps indicated.
pared by the authors of the paper and this research           The proposed approach is summarized in Fig-
marks their first use.                                    ure 1. Please note that a cleaning procedure listed
    The remainder of this paper is arranged as fol-      in step 2 is optional and apparently, as discussed in
lows. Section 2 presents proposed solution in more       Section 5, its usage does not improve the accuracy.
detail. The next Section describes three datasets        This observation is one of the main conclusions of
used in the experiments, as well as experiment setup     this work - in the case of webly data, the final classi-
and technical details of the training procedure. Sec-    fication quality is much more dependent on the rep-
tion 4 summarizes the results in terms of classifica-     resentativeness of the test dataset than application
tion accuracy in the context of the quality of the in-   of cleaning procedures.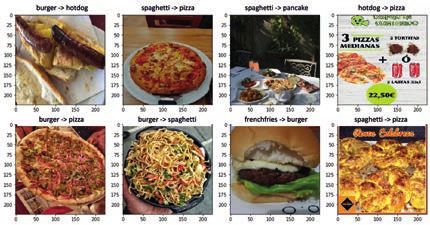
78                                                                                  Dominik Lewy, Jacek Mańdziuk

       Figure 2. Logos of the three Instagram-based datasets used in the
     experimental evaluation: InstaCities1M [13], InstaFood1M [26] and
     InstaPascal2M [27]. The last two sets were compiled by the authors.

    Please also note, that although the use of pre-         3 Experiment setup
trained models in step 3) speeds up training, in
terms of accuracy the learning from scratch leads to            This Section presents detailed specification of
only slightly inferior results. Consequently, the use       three training datasets and two CNN pre-trained ar-
of networks initialized based on domain knowledge           chitectures used in the experiments along with tech-
saves training time but does not increase the ulti-         nical details of the training procedure.
mate classification accuracy in a meaningful way.
The details are presented in Section 3.7.                   3.1   InstaCities1M set and Clean city-
                                                                  related test set
2.1 Motivation                                                  InstaCities1M [13] contains 1 million 224x224
    The above-described problem setting addresses           colour images taken (presumably) in the following
real business needs. For instance, many companies           10 cities: New York, Singapore, Miami, Toronto,
may require automated image categorization (e.g.            Los Angeles, San Francisco, Melbourne, Sydney,
automatic tagging of company’s internal images) or          London and Chicago. The data is divided into
an automated detection of a certain object (e.g. a          a training set (800 000 images), a validation set
safety helmet on construction site, safety gloves for       (50 000 images) and a test set (150 000 images).
ironwork or people presence in restricted areas) on             InstaCities1M was created by downloading im-
the photos taken, for instance, by the CCTV cam-            ages tagged by a city name from Instagram. As In-
era. In many cases a relevant training data (ready          stagram primary reason is private sharing of images
to use) is not available or its availability is seriously   with other platform users, neither the images nor
limited.                                                    their descriptions are validated by experts of any
    Traditional shallow methods work with little            kind.
data but they do not meet harsh accuracy require-                Figure 3a shows that many of InstaCities1M
ments of commercial solutions. Deep learning                images are not representative for any city (e.g. a
methods could meet those expectations but need              tattoo on a hand) and even a human would have
more training data which is costly to gather and in         a hard job with correct classification of the ma-
some cases hinders wider adoption of those algo-            jority of them. A manual inspection of 10 ran-
rithms in commercial solutions. The approach pro-           domly sampled sets, each composed of 8 images,
posed in the paper relies on using large amounts            revealed that, on average, there was only 1 image
of randomly collected web data (photos of required          per set that was truly class-specific. The remaining
objects) and despite obvious flaws in this data (am-         7 presented a common city content which poten-
biguous or erroneous labels or non-representative           tially might have been taken in some other cities,
images) alleviates the problem of scarce availability       as well. This observation supports the claim about
of human-labeled samples and enables wider adop-            high level of noise in the dataset. Ambiguous clas-
tion of DL methods in certain domains.                      sification and uncharacteristic images are just one
                                                            source of the problems. Additionally, labeling is
                                                            sometimes incorrect because people assign a city
                                                            name different from the location in which the im-
                                                            age was actually taken. Some examples of incor-
TRAINING CNN CLASSIFIERS SOLELY ON . . .                                                                             79

rect labeling are presented in Figure 3b. None of                  upper-bound a single set of the easy to predict im-
such dubious or incorrectly-labeled samples were                   ages (Clean Selected) was defined in the following
manually removed from the dataset, as our aim is to                manner. For each class 300 images with the high-
propose and evaluate a fully automated approach to                 est class probability returned by the trained network
data collection and CNN training.                                  were selected regardless of the prediction correct-
                                                                   ness. Each of 100 instances of Clean Random as
                                                                   well as the Clean Selected set included 2700 im-
                                                                   ages (300 per class). As stated above the underlying
                                                                   idea was to use this data as an independent test set
                                                                   composed of representative images.

                                                                   3.2    InstaFood1M set and Clean food-
                                                                          related test set

(a) Randomly selected images labeled as London.                        InstaFood1M dataset [26] was prepared by the
                                                                   authors following the InstaCities1M structure. The
                                                                   set was created by downloading images from Insta-
                                                                   gram identified by particular hashtags. It contains
                                                                   1 million 224x224 colour images from 10 follow-
                                                                   ing categories: Apple Pie, Burger, Donuts, French
     (b) Examples of images with incorrect or                      Fries, Hot Dog, Mac & Cheese, Pancake, Pizza,
              unjustifiable labels.                                 Spaghetti, and Steak, which constitute the top-10
                                                                   food in the USA2 ’3 . Analogously to InstaCities1M
      Figure 3. InstaCities1M - The majority of
  (randomly chosen) images in Figure 3a are clearly                the data is divided into a training set (800 000 im-
not representative for London. In Figure 3b the images             ages), a validation set (50 000 images) and a test set
  (from left to right) are assigned to Sydney, Miami,              (150 000 images).
London and Singapore, resp. while the real classes are
                                                                       Additionally, an independent test set with food
 Melbourne (Flinders Street Railway Station image),
 undefined (there are no characteristic landmarks that
                                                                   images labeled by the experts was created as a sub-
could be helpful in identifying the location), undefined            set of food-101 dataset from kaggle.com4 , origi-
      (but rather not London) and Sydney (Opera                    nally described in [6]. food-101 contains 1000 im-
                   House image), resp.                             ages per each of its 101 classes. For the sake of
                                                                   direct comparison with cities classification exper-
    In order to develop a test set composed of,                    iments, the data was randomly down-sampled in
most probably, properly labeled images we have                     each category from 1000 to 300 images, comprising
additionally downloaded images from official In-                    the Clean food-related data set composed of 3000
stagram accounts of the above-listed cities, ex-                   images.
cept for Miami which seems not to have such                            InstaFood1M suffers from a similar noise prob-
an official account1 . The following accounts                       lem as InstaCities1M, albeit to a lesser extent. In
were used for photo collection: nycgov (398                        the case of food, there are fewer non-representative
images), visit singapore (1117), seetorontonow                     images. Similarly to the previous case we had man-
(1097), losangeles city (1583), onlyinsf (1470),                   ually verified the content of 10 randomly sampled
cityofmelbourne (1641), sydney (2968), london                      sets, each composed of 8 images, and observed that,
(8450) and chicago (2725).                                         on average, 5 out of 8 images were indeed class-
    100 randomly sampled subsets of these images                   specific.
(henceforth denoted as Clean Random) were cre-
ated. Furthermore, in order to estimate the accuracy
  1 Consequently   the experiments were finally performed with the remaining 9 cities.
  2 https://visual.ly/community/infographic/food/top-10-americas-favorite-foods
  3 https://food.ndtv.com/food-drinks/10-american-foods-777850
  4 https://www.kaggle.com/dansbecker/food-101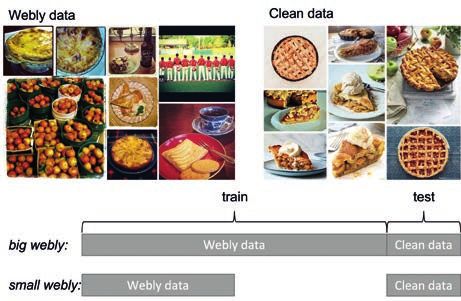
80                                                                                       Dominik Lewy, Jacek Mańdziuk

                                                             Bicycle, Bird, Boat, Bottle, Bus, Car, Cat, Chair,
                                                             Cow, Dining Table, Dog, Horse, Motorbike, Person,
                                                             Potted Plant, Sheep, Sofa, Train, TV/Monitor. In to-
                                                             tal 2.1 million 224x224 colour images were down-
                                                             loaded to comprise InstaPascal2M, further divided
                                                             into a training set (1 600 000 images) a validation set
                                                             (400 000 images) and a test set (100 000 images).
                                                             The same sources of noise as in the two above-
  (a) Randomly selected images labeled as Apple              described datasets (incorrect labeling and ambigu-
                      Pie.                                   ous content) can be observed in InstaPascal2M, as
                                                             depicted in Figure 5.

  (b) Examples of dubious food-related images.

      Figure 4. InstaFood1M - Some of the images
   presented in Figure 4a are clearly not those of apple
   pies though may be somehow linked to this category
 - e.g. a photo of apples. In Figure 4b the images (from
left to right) are assigned to Apple Pie, Burger, Pancake,
    and Spaghetti, resp., although the real/appropriate         (a) Randomly selected images labeled as Bus.
 classes are disputable. The first picture presents Apple
  laptop, the next one is a photo of spaghetti (first plan)
 and burger (in the background), the third one is a funny
     photo of a dog’s face - in some sense resembling
  a pancake, and the last one was taken in a restaurant -
      probably with spaghetti on a small plate in the          (b) Some wrongly-labeled examples of images
                  very bottom of the figure.                      from Car, Sofa, Dog and Airplane classes.

    Generally, there are two sources of noise as pre-             Figure 5. InstaPascal2M - 4 out of 8 randomly
                                                              selected images presented in Figure 5a actually depict
sented in Figure 4b. The first one is the same as in
                                                                 a bus (3 pictures of real buses and a hand-drawing
the case of InstaCities1M - the label may not repre-            of a bus). Arguably another one (3rd, top row) could
sent the content (e.g. Apple computer under Apple            have been taken in a bus interior. Some of the remaining
Pie hashtag). The other problem is more specific              ones do not present a bus, but may possibly be linked to
for this dataset as there can be more than one food          this category (a bus stop, or an interior of a metro cart -
category presented in the image (a typical example               another means of transportation). In Figure 5b the
is a Burger with French Fries). Regarding the in-              images present a cat, a row of chairs, an elephant and
dependent Clean test set compiled from food-101              a helicopter. The first two are wrongly classified and the
                                                               last two are out of the scope of predefined categories.
data, due to its manual labeling and verification,
no incorrectly labeled or irrelevant images are ex-
pected. The issue which may still exist here is the              As representative object-related (Clean) test
co-appearance of more than one food category in an           samples, the images from test part of Pas-
image.                                                       calVOC2007 were considered. In order to ad-
                                                             just PascalVOC2007 samples, which were origi-
                                                             nally meant for multi-label classification two met-
3.3   InstaPascal2M set and Clean object-
                                                             rics were calculated: accuracy on images that had
      related test set
                                                             only one class assigned (1905 samples), referred
    InstaPascal2M dataset [27] was also prepared             to as accuarcy filtered, and accuracy on all Pas-
by the authors, as a webly counterpart of Pas-               calVOC2007 test images (4952). In the former
calVOC2007 dataset [10]. The same 20 categories              case, which represents a typical multi-class setting,
as in PascalVOC2007 were considered: Aeroplane,              the accuracy calculation was straightforward. In the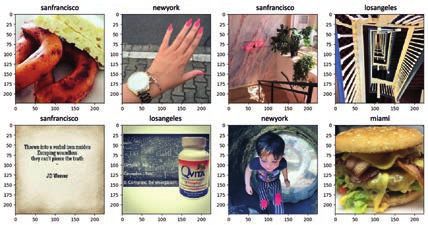
TRAINING CNN CLASSIFIERS SOLELY ON . . .                                                                    81

latter case, for each image it was checked whether        as in [17] (i.e. sampled from Gaussian distribution
the predicted class is on the list of assigned classes.   with zero mean and standard deviation depending
This measure will be referred to as accuarcy one.         on the number of layers in the network) and the
                                                          training was performed from scratch. The use of
3.4   Pre-trained CNN                                     ResNet50 was motivated by its slightly higher per-
                                                          formance and simpler training procedure.
    Two CNN architectures pre-trained on Ima-
geNet [40] are used as a starting point of the training
                                                          3.6 System parameterization
procedure: VGG16 [43] and ResNet50 [17] (pre-
sented in Figs. 6 and 7, resp.). Standard VGG16 is            Initially four sets of experiments were run,
extended by the dropout layers that we have added         each involving one of the two smaller training sets
(highlighted in orange) to prevent over-fitting. Both      (InstaCities1M and InstaFood1M) and one of the
architectures have 10 or 20 output neurons, depend-       two CNN architectures (VGG16 and ResNet50).
ing on the number of classes in the three consid-         VGG16 was extended by regularization in a form
ered datasets (not 1000 as in the original versions).     of a dropout after each fully connected layer.
These two popular and quite different CNN archi-          ResNet50 was used with no modifications, except
tectures were selected to check generality of the         for adjusting the size of the output layer (which
proposed training approach and its independence of        concerned both architectures). Except for the
a particular pre-trained CNN selection.                   above mentioned modifications both VGG16 and
                                                          ResNet50 followed the original implementations
                                                          described in [43] and [17], respectively.
                                                              Depending on the dataset and CNN architec-
                                                          ture the learning process encompassed between 1
  Figure 6. VGG16 architecture with 10 output             and 4 steps, each of them composed of 8 epochs
                  neurons.                                (full training passes). Each epoch was further di-
                                                          vided into 4 iterations for the reasons of error re-
                                                          porting (4 times per epoch). In the case of VGG16,
                                                          the learning rate was set to 1E − 4 in the first step
                                                          and decreased by the factor of 10 at the beginning
                                                          of each subsequent step. Furthermore, training in
                                                          the first two steps was limited to the last 3 layers
                                                          only, with the remaining part being frozen. In sub-
 Figure 7. ResNet50 architecture with 10 output           sequent steps the whole network was trained (albeit
                   neurons.                               with lower starting learning rates). This strategy (in
                                                          the case of VGG16) proved to yield better accuracy
3.5   Randomly Initialized CNN                            than training all weights from the beginning. In the
                                                          case of ResNet50, the whole network was trained
     For the majority of experiments we have used
                                                          right from the start with the initial learning rate
CNNs pre-trained on ImageNet as we would like to
                                                          equal to 1E − 5. For both networks, when the accu-
speed up the process and reduce the carbon foot-
                                                          racy started to plateau learning rate was decreased
print [44] of our experiments. Moreover, it is
                                                          by a factor of 10. A 50 000-image validation set
the best practice to use knowledge already avail-
                                                          was used to prevent over-fitting. The batch size was
able and build up on it. Nevertheless, we also
                                                          equal to 64 images. In all experiments Adam opti-
wanted to demonstrate that high accuracy of the
                                                          mizer [22, 39] was used.
networks truly depends on the information avail-
able in the webly data and not on the features de-            Figure 8 presents example learning curves for
rived from ImageNet that were already available           both datasets. In the case of VGG16 a 4-step train-
as a starting point. To this end, additional experi-      ing process was performed. All layers were un-
ments with all three webly sets with randomly ini-        frozen after the second step, which caused a spike
tialized ResNet50 network were conducted. For             in both training and validation accuracy curves af-
random initialization the weights were initialized        ter iteration 64 for both datasets. In the case of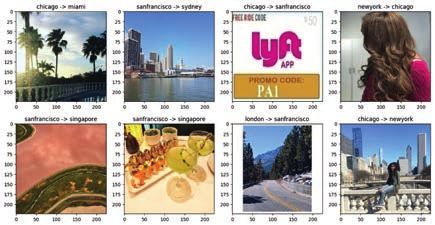
82                                                                                                   Dominik Lewy, Jacek Mańdziuk

ResNet50 one-step training was sufficient and all                       on the remaining 770 000 images with the accu-
weights were trained right from the beginning.                         racy monitored based on 50 000 validation images
                                                                       to prevent over-fitting. Each of the 4 experiments
                                                                       was conducted 3 times.
                                                                           Additionally, two other data sets (one per each
                                                                       problem domain), described in Sections 3.1 and 3.2,
                                                                       respectively were used as Clean test sets, presum-
                                                                       ably without noise.
                                                                           In the case of InstaPascal2M the experiments
                                                                       were performed on both noisy Instagram images
                  (a) VGG16 - InstaCities1M
                                                                       and the representative ones. As noisy images
                                                                       100 000 Instagram test samples left aside at the be-
                                                                       ginning of the experiment were used. These ob-
                                                                       servations were divided into 10 disjoint sets so as
                                                                       to resemble the testing settings of the experiments
                                                                       with the two other datasets (InstaCities1M and In-
                                                                       staFood1M). As a class representative Clean set
                                                                       the test part of PascalVOC2007, described in Sec-
                 (b) ResNet50 - InstaCities1M                          tion 3.3, was used.
                                                                           The main experimental hypothesis was that
                                                                       a classifier trained on (very) noisy Internet data
                                                                       could still provide high quality predictions on
                                                                       representative data.

                                                                       3.7.2 Additional experiments
                  (c) VGG16 - InstaFood1M                                  Additional experiments conducted on all three
                                                                       webly data sets aimed at verifying the importance of
                                                                       ImageNet initialization in the training process. Fur-
                                                                       thermore, we tested whether using higher volumes
                                                                       of webly data would lead to performance increase.
                                                                       The experiments were limited to ResNet50 archi-
                                                                       tecture as it offered slightly higher accuracy with
                                                                       simpler training procedure. For each webly data
                 (d) ResNet50 - InstaFood1M                            set the following 4 experiments were performed.
                                                                       First, the ResNet50 network with random initializa-
 Figure 8. Training (blue line) and validation (red                    tion was trained based on half of the training and
     line) accuracy curves for both datasets.                          validation data. Then, analogous training was per-
                                                                       formed with the same network initialized on Ima-
                                                                       geNet. Both experiments will be referred to as small
                                                                       webly. Afterwards, the same experiments were re-
3.7 Training and testing protocols                                     peated using the entire webly data for training / val-
3.7.1 Main experiments                                                 idation subsets - referred to as big webly experi-
                                                                       ments (the proposed approach is visualized for a
    For both InstaCities1M and InstaFood1M sets
                                                                       sample class in Figure 9). In both small webly and
the experiments were performed as follows5 . First,
                                                                       big webly runs the whole Webly test set (composed
30 000 images from each set were randomly se-
                                                                       of 30 000 samples for InstaFood1M and InstaCi-
lected and set aside to be used as a noisy (Webly)
                                                                       ties1M, and 100 000 samples for InstaPascal2M)
test set. After that both architectures were trained
     5 The   source code for all experiments is available at https://github.com/SzefKuchni/Insta codes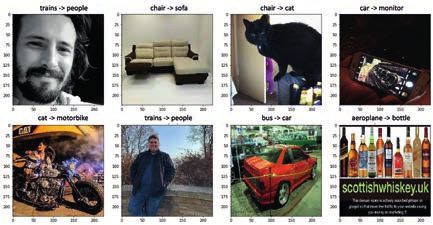
TRAINING CNN CLASSIFIERS SOLELY ON . . .                                                                      83

was used to check the accuracy of the trained mod-         InstaCities1M the impact of training set size is the
els. Each of the 4 experiments was repeated 3 times.       highest among the three sets as reducing the amount
                                                           of training data by 50% (small webly) caused an ac-
                                                           curacy drop of 5.7 p.p. for Clean Random and 7
                                                           p.p. for Clean Selected, respectively.
                                                               The results for InstaPascal2M are presented in
                                                           Table 3. The mean accuracy on Clean dataset (Pas-
                                                           calVOC2007) when the whole training data was
                                                           used (big webly) reached 83.8% and 80.5% for
                                                           acc f iltered and acc one measures, respectively.
                                                           The results for Webly test data were on average 31.9
                                                           p.p. worse. Reducing the training data (small we-
                                                           bly) caused a relatively minor accuracy deteriora-
                                                           tion (between 2.1 and 3.3 p.p.).

   Figure 9. The figure illustrates the baseline idea       4.2 Training on clean data
     of the proposed approach. In the upper part,
   two types of datasets for “apple pie” category are          For the sake of establishing the reference point
 visualized: webly data that contains some erroneous       we performed experiments aimed at verifying the
 images (due to noise) and clean dataset that contains     level of accuracy which can be achieved using ex-
only class-representative images. In the lower part, the
                                                           clusively clean (class representative) training data.
  concept of the experiments is visually explained by
 means of indicating the dataset types and their sizes.        In food-101 set, the same 3 000 images (which
                                                           composed the Clean test dataset) were used for test-
                                                           ing and the remaining 7 000 for training (6 000)
4 Experimental results                                     and validation (1 000), resp. In the case of Pas-
                                                           calVOC2007, we followed the standard data split
4.1 Training on webly data                                 suggested by the authors of this set, i.e. for training
    On InstaFood1M the results achieved with               and validation we used 5011 images and for test-
VGG16 and ResNet50 are close to each other, as             ing 4952 images. In the case of cities-related data,
presented in Table 1. For both architectures test ac-      despite efforts, we could not reach any meaningful
curacy on user Instagram images (denoted as Webly          results, due to small number of samples (2700) and
in the table) is lower than on manually labeled data       their relatively lower specificity.
from kaggle.com (denoted as Clean). Test results               The results of training with clean data did not
on Clean data are repeatable and of high accuracy          match the accuracy achieved with webly data train-
(up to 89.1% on average), exceeding Webly test re-         ing in none of the two domains in which we had
sults by up to 24.5 p.p. Lowering the amount of            enough clean data available. For food-related data
training data (small webly experiments) causes only        the accuracy presented in Table 1 (clean) is on av-
slight accuracy drop on both Clean and Webly test          erage a few percent worse than using big webly
sets. Similar trends can be observed for InstaCi-          training data. The same observation is valid in
ties1M (Table 2) where tests on Clean set collected        common objects related data, presented in Table 3,
from official Instagram cities accounts yield higher        where clean training leads to worse performance
accuracy than tests on Webly data from Instagram           than training on big webly data for both measures
user accounts, albeit the accuracy is generally lower      described.
compared to food data. For randomly selected im-
ages from the Clean test set (Clean Random in Ta-
                                                           4.3 Training with/without pre-training
ble 2), depending on the architecture, the accuracy
is up to 14.1 p.p. higher than for noisy images (We-           Learning curves aggregating results of 4 exper-
bly). The difference raises significantly (up to 50.5       iments, each with 3 runs, with webly training data
p.p.) for the selected easy to predict data (Clean         sets are presented in Figure 10. It can be seen in the
Selected, defined in Section 3.7.1). In the case of         figures that indeed providing more data increases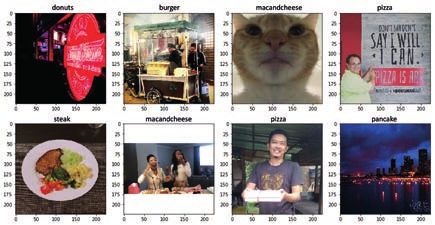
84                                                                                           Dominik Lewy, Jacek Mańdziuk

  Table 1. InstaFood1M. Accuracy results on Webly and Clean test sets described in Section 3.7.1. big webly and
 small webly refer to utilization of the entire training set and half of this set, resp. (cf. Section 3.7.2). clean training
data refers to class representative images coming from food-101 dataset (cf. Section 4.2). For Webly data the results
of a single experiment are reported with standard deviation hence this data was divided into ten equal-size parts. For
             Clean data only one value per experiment is available since this dataset was used as a whole.
                          Each experiment was repeated 3 times with ImageNet initialization.
             Data                                                          Accuracy [%]
      Train       Test          Architecture    Exp.1             Exp.2           Exp.3               Mean
      big webly   Webly         ResNet50        64.6 (+/-0.84)    64.8 (+/-0.77) 64.4 (+/-0.89)       64.6 (+/-0.83)
                  Clean         ResNet50        88.5              89.4            89.4                89.1 (+/-0.53)
                  Webly         VGG16           61.0 (+/-0.77)    61.0 (+/-0.54) 60.9 (+/-0.56)       61.0 (+/-0.62)
                  Clean         VGG16           86.5              87.0            87.1                86.9 (+/-0.25)
      small webly Webly         ResNet50        62.1 (+/-0.77)    62.0 (+/-0.74) 61.9 (+/-0.72)       62.0 (+/-0.74)
                  Clean         ResNet50        87.9              88.0            87.4                87.8 (+/-0.32)
      clean       Clean         VGG16           79.0              79.7            77.8                78.9 (+/-0.79)
                  Clean         ResNet50        83.5              83.6            82.9                83.3 (+/-0.28)

    Table 2. InstaCities1M. Accuracy results for Webly test set and two variants of Clean test sets (Random and
 Selected) described in Section 3.7.1. big webly and small webly refer to utilization of the entire training set and half
    of this set, resp. (cf. Section 3.7.2). For Webly and Clean Random data the results are reported with standard
 deviation since these datasets were created by means of division of a larger data set into disjoint parts (Webly) or by
sampling from a larger data set (Clean Random). For Clean Selected only one value per experiment is available since
           this data set is composed of 300 easy to predict images from each class from the Clean test data.
                            Each experiment was repeated 3 times with ImageNet initialization.
             Data                                                               Accuracy [%]
  Train       Test                  Architecture     Exp.1             Exp.2           Exp.3               Mean
  big webly   Webly                 ResNet50         32.3 (+/-0.90)    31.8 (+/-0.86) 32.0 (+/-0.81)       32.0 (+/-0.86)
              Clean Random          ResNet50         46.9 (+/-2.37)    45.1 (+/-2.37) 46.3 (+/-2.44)       46.1 (+/-2.39)
              Clean Selected        ResNet50         83.5              80.7            83.4                82.5 (+/-1.62)
              Webly                 VGG16            30.3 (+/-0.75)    30.0 (+/-0.67) 30.1 (+/-0.84)       30.1 (+/-0.76)
              Clean Random          VGG16            41.9 (+/-2.43)    41.3 (+/-2.49) 42.7 (+/-2.45)       42.0 (+/-2.46)
              Clean Selected        VGG16            71.0              68.9            69.8                69.9 (+/-0.89)
  small webly Webly                 ResNet50         29.1 (+/-0.82)    28.8 (+/-0.56) 28.9 (+/-0.78)       28.9 (+/-0.72)
              Clean Random          ResNet50         40.3 (+/-2.34)    40.4 (+/-2.34) 40.5 (+/-2.38)       40.4 (+/-2.35)
              Clean Selected        ResNet50         75.3              76.3            74.9                75.5 (+/-0.75)

              (a) InstaFood1M                       (b) InstaCities1M                        (c) InstaPascal2M

Figure 10. Validation curves for experiments with random and ImageNet initialization on small webly and
                     big webly data sets. Each curve is an average of 3 experiments.
TRAINING CNN CLASSIFIERS SOLELY ON . . . 85
Table 3. InstaPascal2M. Accuracy results for Webly and Clean test sets described in Section 3.7.1. The results are
presented in the perspective of three types of training data: small webly - using half of the training and validation
data, big webly - using all this data and clean coming from PascalVOC2007. For Webly test data individual results are
reported with standard deviation since this data was divided into ten equal-size parts. For Clean data only one value
per experiment is available since this dataset was used as a whole. Each experiment
was repeated 3 times with ImageNet initialization.
Data Accuracy [%]
Train Test Measure Exp.1 Exp.2 Exp.3 Mean
big webly Webly acc filtered 51.9 (+/-1.09) 52.1 (+/-0.95) 51.9 (+/-0.96) 51.9 (+/-1.00)
acc one 52.1 (+/-0.77) 52.3 (+/-0.62) 52.1 (+/-0.62) 52.2 (+/-0.67)
small webly Webly acc filtered 49.3 (+/-0.91) 50.2 (+/-0.82) 49.4 (+/-0.78) 49.6 (+/-0.84)
acc one 49.5 (+/-0.61) 50.5 (+/-0.70) 49.6 (+/-0.51) 49.9 (+/-0.61)
big webly Clean acc filtered 82.7 84.7 84.1 83.8 (+/-1.03)
acc one 79.9 80.7 80.9 80.5 (+/-0.54)
small webly Clean acc filtered 80.4 82.1 80.0 80.5 (+/-1.11)
acc one 77.9 80.0 77.2 78.4 (+/-1.46)
clean Clean acc filtered 58.0 63.9 59.0 60.3 (+/-3.21)
acc one 66.3 69.0 68.1 67.8 (+/-1.34)
accuracy although the gain is moderate (2 − 5 p.p., fications were predictions of New York (true class:
depending on the data set) compared to the increase Chicago, London) and Miami (true class: Sydney,
in the amount of data (which was doubled). It can London, Chicago).
also be observed in Figures 10a, 10b and 10c that In the case of common objects classification a
learning curves of the networks initialized with Im- frequent mistake was prediction of various classes
ageNet data end up stabilizing on a similar level to instead of a person. Additionally, quite common
those initialized randomly with only up to 5% dif- was confusing the classes that appear in similar sur-
ference in the accuracy at the later epochs. The roundings, specifically mistaking a dog with a cat,
main difference, which is not surprising in fact, is a dog with a sheep or a chair with a sofa.
the clearly longer ’warm-up’ phase in randomly ini-
tiated experiments.
4.5 Potential limitations of the method ap-
In summary, the learning curves confirm that plicability
the same conclusions related to the efficacy of
webly data training can be drawn irrespective of The underlying assumption of proposed ap-
the weight initialization scheme (pre-training on proach is availability of massive image-based train-
ImageNet or random initialization). ing data in a given domain of interest. This is proba-
bly the main source of potential applicability limita-
tions, in particular in the expert areas or less popular
4.4 Error analysis
domains.
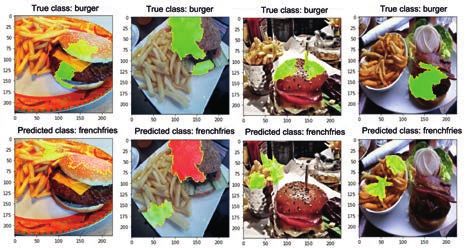
In food classification the most common errors The other limitation, which is also domain-
were caused either by simultaneous appearance of dependent, is frequent co-occurrence of two or
two or more products in the image or by products more classes. Such a situation may affect fi-
similarity that confused the system. The most com- nal model accuracy. In our experiments with In-
monly co-appearing class were French Fries and staFood1M significant part of errors were caused
the most frequent classes co-occurrence was that of by simultaneous appearance of two or more prod-
Burger and French Fries. ucts in the image. Figure 11 presents exam-
Cities classification is clearly a harder task, ple images containing both Burger and French
mainly because, unlike food, cities have very much Fries classes, accompanied by Locally Interpretable
in common e.g. rivers, skyscrapers, buildings, Model-agnostic Explanations (LIME) [38] analysis
roads, parks, etc. and therefore many city photos (which points areas supporting prediction of a par-
are not truly representative for the location in which ticular class in a given image, as well as those which
they have been taken. The most frequent misclassi- undermine this prediction). All four images were86 Dominik Lewy, Jacek Mańdziuk
incorrectly classified and from the LIME analysis (either InstaFood1M, InstaCities1M or InstaPas-
it stems that there are significant clusters of pixels cal2M) was randomly divided into N disjoint parts
supporting each of the two classes. (P1 , . . . , PN ) of the same size. Subsequently, N sep-
arate copies of ResNet50 network, henceforth de-
noted by RN1 , . . . , RNN , with the same architecture
and using the same learning procedure as in the
main experiments, were trained - each on one of the
subsets P1 , . . . , PN , resp. Afterwards, each RNi , i =
1, . . . , N made predictions on the samples belong-
ing to P \ Pi where P := ∪k=1,...,N Pk . This way each
image was classified N − 1 times (by N − 1 net-
works, trained independently). The following two
data cleaning strategies were proposed and tested:
– Correction - changing the label of an image
Figure 11. LIME analysis [38] of examples of the when all N − 1 networks agreed on the same
most frequently co-occurring classes: Burger and class which was different from the original one.
French Fries. Green color represents areas which
support prediction of a given class and red color – Removal - removing an image from the training
represents areas that undermine this prediction. In the set when each of N − 1 networks output a differ-
upper row the analysis is presented from the perspective ent class.
of Burger (true class) and in the lower one form the
perspective of French Fries (wrong class). Both strategies aimed at removing the noise from
the training data, either by correcting dubious la-
Considering potential risks associated with bels or by deleting images that were presumably not
practical utilization of the method, a situation which representative for any class.
should generally be treated with special care is un-
In all data cleaning experiments N = 5 was
even importance of particular classes. Proposed
used, as a reasonable compromise between results
method treats all errors with the same degree of rel-
credibility (the number of concurrent predictions)
evance which may not necessarily be the case in
and relevance of the training subsets (their reason-
practice (e.g. in medicine where false positive di-
able sizes).
agnosis is usually less harmful than false negative
one). A possible remedy would be redefinition of Each experiment was performed according to
the loss function used during training so as to reflect the following scenario: (1) random division of
the true relevance of particular classes or particular dataset P into Pi , i = 1, . . . , 5, (2) training RNi , i =
misclassifications. Another risk which may mate- 1, . . . , 5 based on Pi , (3) testing trained RNi on P \
rialize in practice is uneven support for the classes Pi , i = 1, . . . , 5, (4) labels correction or removal (de-
in the training set. A situation when some classes pending on the considered cleaning variant) leading
are represented by much smaller numbers of train- to a cleaner dataset P′ , (5) training ResNet50 on
ing examples than other classes may skew the sys- P′ and its testing according to the main experiment
tem performance towards classes with more abun- scheme.
dant representations. Again, the advise would be to A summary of data cleaning experiments is pre-
accommodate the effects of nonuniform class dis- sented in Table 4. The level of correction is com-
tribution in the loss function or to apply data aug- parable among all three datasets in terms of the per-
mentation process [25] to images belonging to un- centage of corrected observations. Examples of cor-
derrepresented classes. rected samples, presented in Figures 12, 14 and 16,
respectively, show that the newly assigned labels
are generally well chosen.
5 Data cleaning
The number of removed samples with respect
In the quest for further enhancement of re- to the dataset size varies much more than in the
sults we proposed two straightforward procedures correction experiments. InstaCities1M has poten-
for data cleaning. In both of them, the dataset tially the most ambiguous labels (many city imagesTRAINING CNN CLASSIFIERS SOLELY ON . . . 87
can be non-representative for a particular city) and
InstaPascal2M classes are the most distinct from
one another. Examples of removed samples (due
to complete disagreement among networks) are de-
picted in Figures 13, 15 and 17, respectively. The
vast majority of these samples are not representa-
tive for any of the classes in the respective datasets
and are clearly good candidates for a deletion.
Table 4. Summary of changes introduced to original Figure 14. InstaCities1M examples for which all
datasets in effect of application of data cleaning four RN networks agreed on the same new class
procedures. Rows labeled Original, Correction and
(initial → corrected).
Removal indicate the initial size of the training datasets,
the number of samples with modified (corrected) labels
and the number of removed observations, resp. Values
in parentheses show the number of observations
changed/removed as a percentage
of the original dataset.
Dataset InstaFood1M InstaCities1M InstaPascal2M
Original 800 000 800 000 1 600 000
Correction 42 502 44 392 98 091
(5.3%) (5.5%) (6.1%)
Removal 82 096 126 560 90 430
(10.3%) (15.8%) (5.7%) Figure 15. InstaCities1M examples (with initial
class) for which all four RN networks predicted
different classes.
Figure 12. InstaFood1M examples for which all
Figure 16. InstaPascal2M examples for which all
four RN networks agreed on the same new class
four RN networks agreed on the same new class
(initial → corrected).
(initial → corrected).
Figure 13. InstaFood1M examples (with initial Figure 17. InstaPascal2M examples (with initial
class) for which all four RN networks predicted class) for which all four RN networks predicted
different classes. different classes.88 Dominik Lewy, Jacek Mańdziuk
Quite surprisingly, the data cleaning procedures Extended experiments with food-related and
did not bring accuracy improvement over the base object-related images confirmed that training solely
results (without cleaning). This outcome suggests on class-representative data (i.e. well-framed and
that noisy images, when considered in a sufficiently unambiguous images) may not be competitive to
large number, carry certain background information training with noisy webly data, unless the clean
which is indeed relevant for the ultimate classifica- training dataset is sufficiently large. Consequently,
tion accuracy. the proposed training regime may offer a viable
alternative in domains with scarce availability of
expert-labeled data.
6 Conclusions
The approach presented in this paper is rudi-
The paper demonstrates that it is possible to mentary, and does not require any expert-labeled
efficiently train two CNN classifiers from com- data. We believe that future research on webly data
pletely different families (VGG and ResNet) on utilization should follow the same path, but with a
noisy web data. For the best model, the average focus on a more effective usage of the information
accuracy results on representative test data reached represented in webly data. In this context, inter-
89.1% on InstaFood1M and 82.5% on more de- esting areas of research are methods that can either
manding Instacities1M dataset. In the case of In- learn more effectively under the presence of noise,
staPascal2M the results on representative test data methods capable of selecting most useful images
attained (on average) 83.8% and 80.5% according from webly data, and self-supervised methods (e.g.
to accuracy f iltered and accuracy one measures, CLIP model [35]).
resp. The above scores are repeatable with very low
standard deviation which supports the claim about
robustness of proposed training approach.
References
Overall, the results confirm the possibility to [1] J. A. Aghamaleki and S. M. Baharlou. Transfer
use abundant weakly-labeled Internet resources of learning approach for classification and noise re-
duction on noisy web data. Expert Syst. Appl.,
images as a source of data in the training process, 105:221–232, 2018.
with no need for manual data inspection, data clean-
ing or other enhancement. [2] Z. Akata, F. Perronnin, Z. Harchaoui, and
C. Schmid. Label-embedding for attribute-based
The experiments showed that the resulting ac- classification. In 2013 IEEE Conference on Com-
curacy of webly-trained CNN classifiers is indepen- puter Vision and Pattern Recognition, Portland,
dent of the initialization method. A direct com- OR, USA, June 23-28, 2013, pages 819–826. IEEE
parison of randomly initialized architectures vs. Computer Society, 2013.
the same architectures initialized on ImageNet data [3] S. Bai and S. An. A survey on automatic image
confirmed that webly data contains all the infor- caption generation. Neurocomputing, 311:291–
mation required to train the models effectively, al- 304, 2018.
though using a good starting point (initialization of [4] A. Bergamo and L. Torresani. Exploiting weakly-
weights based on ImageNet) speeds up the training labeled web images to improve object classifica-
process significantly. tion: a domain adaptation approach. In J. D. Laf-
An auxiliary data cleaning process did not cause ferty, C. K. I. Williams, J. Shawe-Taylor, R. S.
Zemel, and A. Culotta, editors, Advances in Neu-
accuracy improvement which suggests that class
ral Information Processing Systems 23: 24th An-
representations learnt from webly data are indeed nual Conference on Neural Information Process-
meaningful and robust. In particular, excluding ing Systems 2010. Proceedings of a meeting held
huge chunks of “the noisiest” data in the Removal 6-9 December 2010, Vancouver, British Columbia,
experiments (with no consequent performance im- Canada, pages 181–189. Curran Associates, Inc.,
provement) suggest that it is not a matter of the 2010.
amount of noise in the webly training data but rather [5] J. Böhlke, D. Korsch, P. Bodesheim, and J. Den-
the quality of the test data that contributes mostly to zler. Lightweight filtering of noisy web data: Aug-
the overall classification results. menting fine-grained datasets with selected inter-
net images. In G. M. Farinella, P. Radeva, J. Braz,TRAINING CNN CLASSIFIERS SOLELY ON . . . 89
and K. Bouatouch, editors, Proceedings of the [14] R. Gomez, L. Gómez, J. Gibert, and D. Karatzas.
16th International Joint Conference on Computer Learning to learn from web data through deep se-
Vision, Imaging and Computer Graphics Theory mantic embeddings. In L. Leal-Taixé and S. Roth,
and Applications, VISIGRAPP 2021, Volume 5: editors, Computer Vision - ECCV 2018 Work-
VISAPP, Online Streaming, February 8-10, 2021, shops - Munich, Germany, September 8-14, 2018,
pages 466–477. SCITEPRESS, 2021. Proceedings, Part VI, volume 11134 of Lec-
ture Notes in Computer Science, pages 514–529.
[6] L. Bossard, M. Guillaumin, and L. Van Gool. Springer, 2018.
Food-101 – mining discriminative components
with random forests. In European Conference on [15] A. Gupta, A. Vedaldi, and A. Zisserman. Synthetic
Computer Vision, 2014. data for text localisation in natural images. In 2016
IEEE Conference on Computer Vision and Pattern
[7] X. Chen and A. Gupta. Webly supervised learn- Recognition, CVPR 2016, Las Vegas, NV, USA,
ing of convolutional networks. In 2015 IEEE In- June 27-30, 2016, pages 2315–2324. IEEE Com-
ternational Conference on Computer Vision, ICCV puter Society, 2016.
2015, Santiago, Chile, December 7-13, 2015,
pages 1431–1439. IEEE Computer Society, 2015. [16] K. He, G. Gkioxari, P. Dollár, and R. B. Girshick.
Mask R-CNN. In IEEE International Conference
[8] A. Dosovitskiy, P. Fischer, E. Ilg, P. Häusser, on Computer Vision, ICCV 2017, Venice, Italy,
C. Hazirbas, V. Golkov, P. van der Smagt, D. Cre- October 22-29, 2017, pages 2980–2988. IEEE
mers, and T. Brox. Flownet: Learning optical flow Computer Society, 2017.
with convolutional networks. In 2015 IEEE In-
ternational Conference on Computer Vision, ICCV [17] K. He, X. Zhang, S. Ren, and J. Sun. Deep residual
2015, Santiago, Chile, December 7-13, 2015, learning for image recognition. In 2016 IEEE Con-
pages 2758–2766. IEEE Computer Society, 2015. ference on Computer Vision and Pattern Recogni-
tion, CVPR 2016, Las Vegas, NV, USA, June 27-
[9] T. Durand, N. Thome, and M. Cord. WELDON: 30, 2016, pages 770–778. IEEE Computer Society,
weakly supervised learning of deep convolutional 2016.
neural networks. In 2016 IEEE Conference on
Computer Vision and Pattern Recognition, CVPR [18] D. Hendrycks, M. Mazeika, D. Wilson, and
2016, Las Vegas, NV, USA, June 27-30, 2016, K. Gimpel. Using trusted data to train deep net-
pages 4743–4752. IEEE Computer Society, 2016. works on labels corrupted by severe noise. In
S. Bengio, H. M. Wallach, H. Larochelle, K. Grau-
[10] M. Everingham, L. Van Gool, C. K. I. Williams, man, N. Cesa-Bianchi, and R. Garnett, editors,
J. Winn, and A. Zisserman. The pascal visual ob- Advances in Neural Information Processing Sys-
ject classes (voc) challenge. International Journal tems 31: Annual Conference on Neural Infor-
of Computer Vision, 88(2):303–338, June 2010. mation Processing Systems 2018, NeurIPS 2018,
December 3-8, 2018, Montréal, Canada, pages
[11] A. Frome, G. S. Corrado, J. Shlens, S. Bengio, 10477–10486, 2018.
J. Dean, M. Ranzato, and T. Mikolov. Devise: A
deep visual-semantic embedding model. In C. J. C. [19] H. Izadinia, B. C. Russell, A. Farhadi, M. D. Hoff-
Burges, L. Bottou, Z. Ghahramani, and K. Q. man, and A. Hertzmann. Deep classifiers from im-
Weinberger, editors, Advances in Neural Infor- age tags in the wild. In G. Friedland, C. Ngo, and
mation Processing Systems 26: 27th Annual Con- D. A. Shamma, editors, Proceedings of the 2015
ference on Neural Information Processing Systems Workshop on Community-Organized Multimodal
2013. Proceedings of a meeting held December 5- Mining: Opportunities for Novel Solutions, MM-
8, 2013, Lake Tahoe, Nevada, United States, pages Commons 2015, Brisbane, Australia, October 30,
2121–2129, 2013. 2015, pages 13–18. ACM, 2015.
[12] R. B. Girshick, J. Donahue, T. Darrell, and J. Ma- [20] M. Jaderberg, K. Simonyan, A. Vedaldi, and
lik. Rich feature hierarchies for accurate object A. Zisserman. Reading text in the wild with con-
detection and semantic segmentation. In 2014 volutional neural networks. Int. J. Comput. Vis.,
IEEE Conference on Computer Vision and Pattern 116(1):1–20, 2016.
Recognition, CVPR 2014, Columbus, OH, USA,
June 23-28, 2014, pages 580–587. IEEE Computer [21] A. Joulin, L. van der Maaten, A. Jabri, and N. Vasi-
Society, 2014. lache. Learning visual features from large weakly
supervised data. In B. Leibe, J. Matas, N. Sebe,
[13] R. Gomez. Instacities1m, https://gombru.github.io and M. Welling, editors, Computer Vision - ECCV
/2018/08/01/InstaCities1M/, 2018. 2016 - 14th European Conference, Amsterdam,90 Dominik Lewy, Jacek Mańdziuk
The Netherlands, October 11-14, 2016, Proceed- supervised pretraining. In V. Ferrari, M. Hebert,
ings, Part VII, volume 9911 of Lecture Notes in C. Sminchisescu, and Y. Weiss, editors, Computer
Computer Science, pages 67–84. Springer, 2016. Vision - ECCV 2018 - 15th European Conference,
Munich, Germany, September 8-14, 2018, Pro-
[22] D. P. Kingma and J. Ba. Adam: A method for
ceedings, Part II, volume 11206 of Lecture Notes
stochastic optimization. In Y. Bengio and Y. Le-
in Computer Science, pages 185–201. Springer,
Cun, editors, 3rd International Conference on
2018.
Learning Representations, ICLR 2015, San Diego,
CA, USA, May 7-9, 2015, Conference Track Pro- [31] L. Niu, W. Li, D. Xu, and J. Cai. Visual recogni-
ceedings, 2015. tion by learning from web data via weakly super-
[23] J. Krause, B. Sapp, A. Howard, H. Zhou, A. To- vised domain generalization. IEEE Trans. Neural
shev, T. Duerig, J. Philbin, and L. Fei-Fei. The Networks Learn. Syst., 28(9):1985–1999, 2017.
unreasonable effectiveness of noisy data for fine- [32] L. Niu, Q. Tang, A. Veeraraghavan, and A. Sabhar-
grained recognition. In B. Leibe, J. Matas, N. Sebe, wal. Learning from noisy web data with category-
and M. Welling, editors, Computer Vision - ECCV level supervision. In 2018 IEEE Conference on
2016 - 14th European Conference, Amsterdam, Computer Vision and Pattern Recognition, CVPR
The Netherlands, October 11-14, 2016, Proceed- 2018, Salt Lake City, UT, USA, June 18-22, 2018,
ings, Part III, volume 9907 of Lecture Notes pages 7689–7698. Computer Vision Foundation /
in Computer Science, pages 301–320. Springer, IEEE Computer Society, 2018.
2016.
[33] L. Niu, A. Veeraraghavan, and A. Sabharwal. We-
[24] A. Krizhevsky, I. Sutskever, and G. E. Hinton. Ima-
bly supervised learning meets zero-shot learning:
genet classification with deep convolutional neural
A hybrid approach for fine-grained classification.
networks. In P. L. Bartlett, F. C. N. Pereira, C. J. C.
In 2018 IEEE Conference on Computer Vision
Burges, L. Bottou, and K. Q. Weinberger, editors,
and Pattern Recognition, CVPR 2018, Salt Lake
Advances in Neural Information Processing Sys-
City, UT, USA, June 18-22, 2018, pages 7171–
tems 25: 26th Annual Conference on Neural Infor-
7180. Computer Vision Foundation / IEEE Com-
mation Processing Systems 2012. Proceedings of
puter Society, 2018.
a meeting held December 3-6, 2012, Lake Tahoe,
Nevada, United States, pages 1106–1114, 2012. [34] G. Patrini, A. Rozza, A. K. Menon, R. Nock, and
[25] D. Lewy and J. Mańdziuk. An overview of mixing L. Qu. Making deep neural networks robust to la-
augmentation methods and augmentation strate- bel noise: A loss correction approach. In 2017
gies. Artificial Intelligence Review, 2022. IEEE Conference on Computer Vision and Pattern
Recognition, CVPR 2017, Honolulu, HI, USA,
[26] D. Lewy and J. Mańdziuk. Instafood1m, July 21-26, 2017, pages 2233–2241. IEEE Com-
https://szefkuchni.github.io/InstaFood1M/, 2019. puter Society, 2017.
[27] D. Lewy and J. Mańdziuk. Instapascal2m, [35] A. Radford, J. W. Kim, C. Hallacy, A. Ramesh,
https://szefkuchni.github.io/InstaPascal2M/, 2019. G. Goh, S. Agarwal, G. Sastry, A. Askell,
[28] J. Li, Y. Song, J. Zhu, L. Cheng, Y. Su, L. Ye, P. Mishkin, J. Clark, G. Krueger, and I. Sutskever.
P. Yuan, and S. Han. Learning from large-scale Learning transferable visual models from natural
noisy web data with ubiquitous reweighting for language supervision. In M. Meila and T. Zhang,
image classification. IEEE Trans. Pattern Anal. editors, Proceedings of the 38th International Con-
Mach. Intell., 43(5):1808–1814, 2021. ference on Machine Learning, ICML 2021, 18-24
July 2021, Virtual Event, volume 139 of Proceed-
[29] T. Lin, M. Maire, S. J. Belongie, J. Hays, P. Per- ings of Machine Learning Research, pages 8748–
ona, D. Ramanan, P. Dollár, and C. L. Zitnick. Mi- 8763. PMLR, 2021.
crosoft COCO: common objects in context. In D. J.
Fleet, T. Pajdla, B. Schiele, and T. Tuytelaars, ed- [36] J. Redmon, S. K. Divvala, R. B. Girshick, and
itors, Computer Vision - ECCV 2014 - 13th Eu- A. Farhadi. You only look once: Unified, real-time
ropean Conference, Zurich, Switzerland, Septem- object detection. In 2016 IEEE Conference on
ber 6-12, 2014, Proceedings, Part V, volume 8693 Computer Vision and Pattern Recognition, CVPR
of Lecture Notes in Computer Science, pages 740– 2016, Las Vegas, NV, USA, June 27-30, 2016,
755. Springer, 2014. pages 779–788. IEEE Computer Society, 2016.
[30] D. Mahajan, R. B. Girshick, V. Ramanathan, [37] S. Ren, K. He, R. B. Girshick, and J. Sun. Faster
K. He, M. Paluri, Y. Li, A. Bharambe, and R-CNN: towards real-time object detection with
L. van der Maaten. Exploring the limits of weakly region proposal networks. In C. Cortes, N. D.You can also read