To isolate or not to isolate: the impact of changing behavior on COVID-19 transmission
←
→
Page content transcription
If your browser does not render page correctly, please read the page content below
Agusto et al. BMC Public Health    (2022) 22:138
https://doi.org/10.1186/s12889-021-12275-6

    RESEARCH ARTICLE                                                                                                                                 Open Access

To isolate or not to isolate: the impact of
changing behavior on COVID-19
transmission
Folashade B. Agusto1* , Igor V. Erovenko6 , Alexander Fulk1 , Qays Abu-Saymeh1 , Daniel Romero-Alvarez1 ,
Joan Ponce3 , Suzanne Sindi4 , Omayra Ortega5 , Jarron M. Saint Onge2 and A. Townsend Peterson1

    Abstract
    Background: The COVID-19 pandemic has caused more than 25 million cases and 800 thousand deaths worldwide
    to date. In early days of the pandemic, neither vaccines nor therapeutic drugs were available for this novel
    coronavirus. All measures to prevent the spread of COVID-19 are thus based on reducing contact between infected
    and susceptible individuals. Most of these measures such as quarantine and self-isolation require voluntary
    compliance by the population. However, humans may act in their (perceived) self-interest only.
    Methods: We construct a mathematical model of COVID-19 transmission with quarantine and hospitalization
    coupled with a dynamic game model of adaptive human behavior. Susceptible and infected individuals adopt various
    behavioral strategies based on perceived prevalence and burden of the disease and sensitivity to isolation measures,
    and they evolve their strategies using a social learning algorithm (imitation dynamics).
    Results: This results in complex interplay between the epidemiological model, which affects success of different
    strategies, and the game-theoretic behavioral model, which in turn affects the spread of the disease. We found that
    the second wave of the pandemic, which has been observed in the US, can be attributed to rational behavior of
    susceptible individuals, and that multiple waves of the pandemic are possible if the rate of social learning of infected
    individuals is sufficiently high.
    Conclusions: To reduce the burden of the disease on the society, it is necessary to incentivize such altruistic behavior
    by infected individuals as voluntary self-isolation.
    Keywords: COVID-19, Isolation and quarantine, Game theory, Human behavior, Imitation dynamics, Perception of risk

Background                                                                                 has been deemed a pandemic by the World Health Orga-
COVID-19 is a respiratory disease caused by a recently                                     nization (WHO).
discovered, novel coronavirus SARS-CoV-2. Since its dis-                                      According to COVID-19 data from Johns Hopkins Uni-
covery in Wuhan, China, in 2019, COVID-19 has led to                                       versity [1], the United States is currently the epicenter of
over 25 million cases globally, over 800 thousand deaths,                                  the outbreak, with nearly 5 million confirmed cases and
and 16 million recovered. Spreading globally, including to                                 over 180 thousand reported deaths. Additionally, South
vulnerable countries with challenging healthcare infras-                                   America, India, and Africa are experiencing rising in cases
tructures, the virus is now of international concern and                                   and deaths from the virus. Brazil has over 3 million con-
                                                                                           firmed cases with over 120 thousand deaths; India has
*Correspondence: fbagusto@gmail.com                                                        over 3 million confirmed cases with over 62 thousand
1
 University of Kansas, 66045 Lawrence, KS, USA                                             deaths; and South Africa has over 600 thousand con-
Full list of author information is available at the end of the article
                                                                                           firmed cases and 13 thousand deaths. These statistics
                                             © The Author(s). 2022 Open Access This article is licensed under a Creative Commons Attribution 4.0 International License,
                                             which permits use, sharing, adaptation, distribution and reproduction in any medium or format, as long as you give appropriate
                                             credit to the original author(s) and the source, provide a link to the Creative Commons licence, and indicate if changes were
                                             made. The images or other third party material in this article are included in the article’s Creative Commons licence, unless
                                             indicated otherwise in a credit line to the material. If material is not included in the article’s Creative Commons licence and your
                                             intended use is not permitted by statutory regulation or exceeds the permitted use, you will need to obtain permission directly
                                             from the copyright holder. To view a copy of this licence, visit http://creativecommons.org/licenses/by/4.0/. The Creative
                                             Commons Public Domain Dedication waiver (http://creativecommons.org/publicdomain/zero/1.0/) applies to the data made
                                             available in this article, unless otherwise stated in a credit line to the data.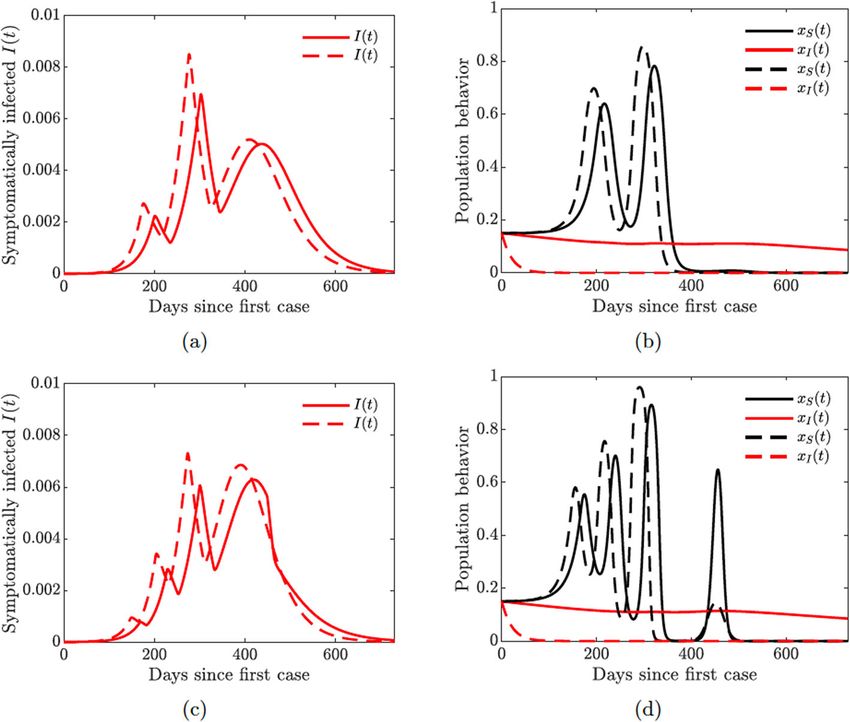
Agusto et al. BMC Public Health   (2022) 22:138                                                                 Page 2 of 20

point towards a grim realization that the world might be       COVID-19 due to the nonlinear interactions between dis-
losing the battle to contain and control the pandemic.         ease dynamics and population behaviour. Zhao et al. [13]
  COVID-19 is transmitted person-to-person via respi-          in their work showed the possibility to reduce COVID-
ratory droplets and aerosols or by touching contami-           19 outbreak through an imitating social learning process,
nated surfaces and objects containing the virus [2]; the       and individual-level behavioral change. Wei et al. [14]
virus can live for hours or days on contaminated sur-          used evolutationary game analysis to study the inter-
faces and objects [3]. The incubation period for those         action strategies and actions taken by the government
exposed to COVID-19 varies from 2 to 12 days [4, 5];           and public to control the virus, they found that govern-
onset of symptoms is often seen earlier in people with         ment’s initial emergency response to the epidemic can
pre-existing health conditions and compromised immune          effectively control the spread of the epidemic. However,
systems. There is a wide range of symptoms observed            these models used minimal mathematic models that do
in patients with COVID-19, including fever, shortness          not capture other human behavior like quarantine com-
of breath, dry cough, headache, nausea, sore throat,           pliance and violation, and impact of these behavioral
chest pain, loss of taste or smell, diarrhea, and severe       responses.
fatigue [5].                                                     Thus, the objective of this study is to gain insight into
  While the risk of severe complications and death from        the role of human behavior in modulating the spread and
COVID-19 is higher among the older population and              prevalence of COVID-19. We construct a mathematical
people with pre-existing conditions, younger adults and        model of COVID-19 transmission with quarantine and
children remain at risk. In China, 90% of children were        hospitalization, and we couple this model with a dynamic
asymptomatic and only 5.9% had severe infections (com-         game model of adaptive human behavior. Susceptible indi-
pared to 20% among adults with the disease) [6]. In Italy,     viduals seek to protect themselves from the infection, and
10% of COVID-19 infected people in ICUs are 20–40              they consider supporting school and workplace closures.
years old [7, 8]. Nonetheless, many young people are           Infected individuals cannot protect themselves, but they
not taking the pandemic seriously [8]. In the United           may try to protect the rest of the population by electing
States, there have been numerous examples of young             to self-isolate from other people. Individuals adopt strate-
adults ignoring these warnings and underestimating the         gies based on the perceived prevalence and burden of
disease risk either to themselves or to older individu-        the disease and on sensitivity to the social isolation mea-
als around them. For instance, a group of young adults         sures. They may also imitate strategies of other individuals
in Kentucky threw a “Coronovirus Party” [9] and other          via a social learning process (imitation dynamics [15]) if
gathered in an over-crowded pool party without social          these individuals are more successful according to appro-
distancing [10].                                               priately defined game payoff functions. This results in a
  In the early days of the pandemic, neither vaccines nor      complex interplay between the disease spread and human
therapeutics were available for this virus, public health      behavioral response, which affect each other in a feedback
responses require social policies. Various regions have        loop. We try to identify behavioral factors that reduce
tried distinct responses including social distancing, school   the scale of the pandemic, and propose possible mea-
and event closings, and travel bans. Social distancing         sures to address these factors for the benefit of the entire
guidelines as suggested by the Centers for Disease Control     society.
and Prevention (CDC) and the World Health Organiza-
tion states that individuals outside their homes should be     Methods
six feet apart from all other people and to wear a face        In this study, we develop a novel COVID-19 transmis-
mask at all times. The guidelines further recommend that       sion model that incorporates dynamic human behavior,
people frequently wash their hands for at least 20 sec-        which is driven by various factors. We parameterized the
onds, even in their homes, as research has shown that          model using data from the ongoing COVID-19 outbreaks.
soap kills the virus and reduces one’s chance of getting       To develop this novel game-theoretic model with dynamic
infected [11]. Infected individuals and suspected cases        human behavior, we first consider a baseline epidemiolog-
are quarantined or advised to self-isolate. However, little    ical model with static human behavior.
is known about best management strategies for limiting
further transmission and spread. Furthermore, the suc-         Baseline COVID-19 model
cess of these preventive measures depend on voluntary          We construct a model of COVID-19 transmission with
compliance by the population, humans may act in their          quarantine and hospitalization. We follow the natural
(perceived) self-interest only.                                history of the infection [16, 17] and partition the pop-
  Pedro et al. [12] developed a COVID-19 transmission          ulation according to their disease status as susceptible
model that incorporate the support for school and work-        (S(t)), exposed (E(t)), asymptomatically infected (A(t)),
place closure, they found the possibility of second wave of    symptomatically infected (I(t)), quarantined (Q(t)),
Agusto et al. BMC Public Health   (2022) 22:138                                                                              Page 3 of 20

hospitalized (H(t)), and removed (R(t)) individuals. The        Table 1 Description of the variables and parameters of the
static human behavior in this model is represented by the       COVID-19 model (1)
constant rate of violating quarantine.                          Variable                     Description
  We assume that the population is not affected by birth        S(t)                         Proportion of susceptible individuals
and natural mortality because we are modeling short-            E(t)                         Proportion of exposed individuals
term dynamics of the pandemic. We therefore treat com-          A(t)                         Proportion of asymptomatically infected
partment sizes as proportions of the entire population.                                      individuals
Susceptible individuals become exposed upon contact             I(t)                         Proportion of symptomatically infected
with infected individuals, and the force of infection is                                     individuals
given by                                                        Q(t)                         Proportion of quarantined individuals
                                                                H(t)                         Proportion of hospitalized individuals
    λ(t) = β[ I(t) + ηA A(t) + ηQ Q(t) + ηH H(t)] ,             R(t)                         Proportion of removed individuals

                                                                Parameter                    Description
where β is the infection rate, ηA are the modifica-
                                                                β                            Infection rate
tion parameters representing reduced infectiousness of
asymptomatic individuals. According to the Centers for          ηA ηQ , ηH                   Modification parameters for asymptomatic,
                                                                                             quarantined, and hospitalized infection rates
Disease Prevention and Control (CDC) asymptomatic
individuals are less infections compare to symptomatic          q                            Proportion of exposed developing
                                                                                             asymptomatic infections
individuals [18]. The modification parameters ηQ , and ηH
                                                                σ                            Disease progression rate from the exposed
accounts for the variability of the infectiousness of the                                    to infectious
quarantined, and hospitalized individuals due to limited
                                                                γI , γA , γQ , γH            Recovery rates of symptomatic,
contact with the susceptible individuals [19].                                               asymptomatic, quarantined, and
  Exposed individuals become infected at the rate σ . A                                      hospitalized individuals
proportion q of these individuals show no symptoms of           ωQ , ωH                      Quarantine and hospitalization rates
the disease and move to the asymptomatically infected           νQ                           Quarantine violation rate
compartment, while a proportion (1 − q) of exposed indi-
                                                                νH                           Hospital discharge rate
viduals develop clinical symptoms of the disease and move
to the symptomatically infected compartment. Asymp-             δI , δA , δQ , δH            Death rates of symptomatic, asymptomatic,
                                                                                             quarantined, and hospitalized individuals
tomatic (symptomatic) individuals recover from the dis-
ease at the rate γA (γI ) and die at the rate δA (δI ). Symp-
tomatic individuals are hospitalized at the rate ωH . Those
individuals whose condition is not sufficiently severe are        The flow diagram depicting the transitions between
quarantined at the rate ωQ . There have been reports of         compartments as the disease progresses through the pop-
people flouting quarantine [20–23], and we assume that          ulation is shown in Fig. 1, and the associated state vari-
quarantined individuals break the quarantine at the rate        ables and parameters are described in Table 1.
νQ . Quarantined individuals recover from the disease at          The differential equations describing the dynamics of
the rate γQ and die at the rate δQ .                            this model are given in Eq. 1.
  COVID-19 spreads at an alarming rate, requiring high
rates of hospitalization. Hospitals often become over-
whelmed and may run out of beds, respirators, ventilators,
and ICUs [24]. Furthermore, some hospitals are reserving
beds for the critically ill COVID-19 patients and discharg-
ing those with less severe illness [25, 26]. We assume that
due to the limitations in hospital capacity, hospitalized
individuals leave the hospitals while still infected at the
rate νH . Hospitalized individuals recover from the disease
at the rate γH and die at the rate δH .
  The removed individuals comprise both recovered and
deceased individuals. We disregard the possibility of rein-
fection because we are looking into short-term dynamics
of the disease spread in the population. We therefore
assume that recovered individuals do not contribute to the
                                                                    Fig. 1 Flow diagram of the COVID-19 model (1)
spread of the infection.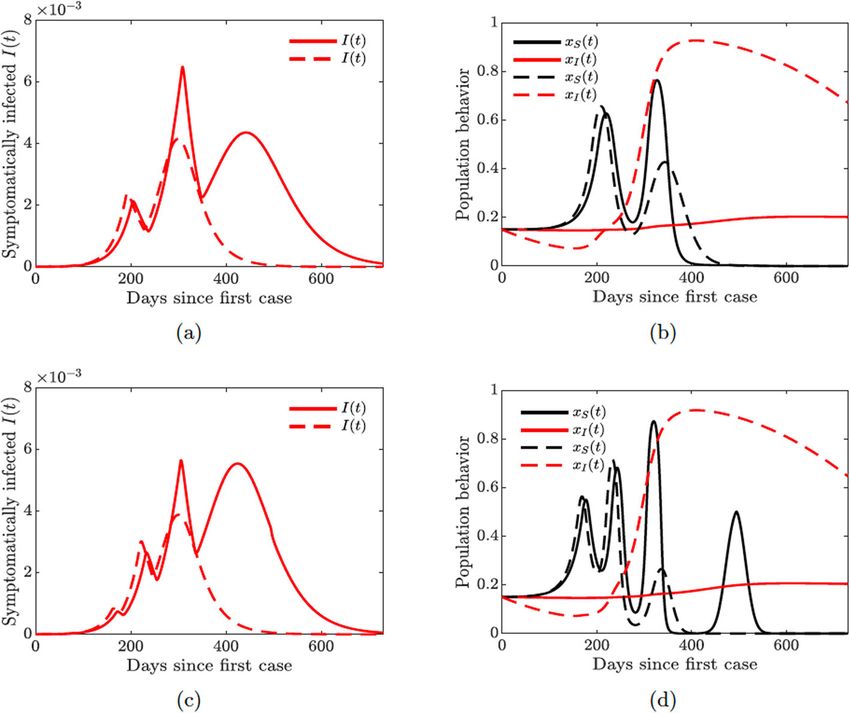
Agusto et al. BMC Public Health      (2022) 22:138                                                                                      Page 4 of 20

 dS                                                                       Table 2 Parameters values for the baseline COVID-19 model (1)
      = − β[ I(t) + ηA A(t) + ηQ Q(t) + ηH H(t)] S(t)
 dt                                                                       fitted to Arizona
dE
      = β[ I(t) + ηA A(t) + ηQ Q(t) + ηH H(t)] S(t) − σ E(t)              Parameter          Description                    Value        References
 dt
dA                                                                        β                  Infection rate                 0.4712       Fitted
      = qσ E(t) − (γA + δA )A(t)
 dt                                                                       ηA                 Asymptomatic infection         0.45         [18]
 dI                                                                                          rate modification
      = (1 − q)σ E(t) + νQ Q(t) + νH H(t) − (ωQ + ωH + γI + δI )I(t)                         parameter
 dt
dQ                                                                        ηQ                 Quarantined infection rate     0.0101       Fitted
      = ωQ I(t) − (νQ + γQ + δQ )Q(t)
dt                                                                                           modification parameter
dH                                                                        ηH
      = ωH I(t) − (νH + γH + δH )H(t)                                                        Hospitalized infection rate    0.4509       Fitted
dt                                                                                           modification parameter
dR
      = (γA + δA )A(t) + (γI + δI )I(t) + (γQ + δQ )Q(t)                  q                  Proportion developing          0.5          [18]
 dt                                                                                          asymptomatic infections
        + (γH + δH )H(t)
                                                                          σ                  Disease progression rate       1/6          [18]
                                                                    (1)   γI                 Recovery rates of              0.5997       Fitted
  The associated reproduction number [27, 28] of the                                         symptomatic
baseline COVID-19 model (1) with quarantine and hospi-                    γA                 Recovery rates of              0.2363       Fitted
                                                                                             asymptomatic
talization, denoted by R0 , is given by
                                                                          γQ                 Recovery rates of              0.3815       Fitted
      R0 = RI + RA ,                                                (2)                      quarantined

where                                                                     γH                 Recovery rates of              0.0107       Fitted
                                                                                             hospitalized
       (1 − q)β(k3 ηH ωH + k4 ηQ ωQ + k3 k4 )                  qβηA
RI =                                            and     RA =        ,     ωQ                 Quarantine rate                0.5326       Fitted
          (k2 k3 k4 − k3 νH ωH − k4 νQ ωQ )                     k1
                                                                          ωH                 Hospitalization rate           0.7495       Fitted
with k1 = γA + δA , k2 = γI + ωQ + ωH + δI , k3 =
νQ + γQ + δQ , and k4 = νH + γH + δH . The quan-                          νQ                 Quarantine violation rate      0.4586       Fitted
tity RI is the number of secondary infections produced                    νH                 Hospital discharge rate        0.0126       [18]
by symptomatic individuals, while RA is the number of                     δI                 Death rate of symptomatic      0.0065       Fitted
secondary infections generated by asymptomatic individ-                   δA                 Death rate of                  0.00325      Assumed
uals. Together, the epidemiological quantity R0 , measures                                   asymptomatic
the average number of COVID-19 secondary infections                       δQ                 Death rate of quarantined      0.0065       [18]
produced when a single infected individual is introduced                  δH                 Death rate of hospitalized     0.0065       [18]
into a completely susceptible population [27, 28]. Hence,
COVID-19 can be effectively controlled in the population
if the reproduction number (R0 ) can be reduced to (and
maintained at) a value less than unity (i.e., R0 < 1). It
should be noted that this model does not exhibite back-
ward bifurcation. If this phenomenon exist, reducing the
basic reproduction number to a value less than unity may
not be a sufficient condition for effective disease control.
Backward bifurcation is known to be caused in models
with vaccination, reinfection, and vector-borne disease
with mortality [29–34], none of these features are present
in this current model.

Parameter estimation and model fitting
Here we parameterize the baseline COVID-19 model (1).
We employ two strategies for obtaining the parameter val-
ues: first we obtained the parameter values from literature
(see Table 2). Second, for those parameter not found in
literature, we estimated their values by fitting the COVID-
19 model (1) to the cumulative number of cases data for
Arizona from January 26 to July 6, 2020. The data was                          Fig. 2 Fitting the baseline COVID-19 model parameters (1) to Arizona
obtained from Johns Hopkins website [1] and fitted using                       data of reported cumulative new cases. The COVID-19 outbreaks data
                                                                               are obtained from Johns Hopkins website [1]
the classic least-squares method; see Fig. 2 and Table 2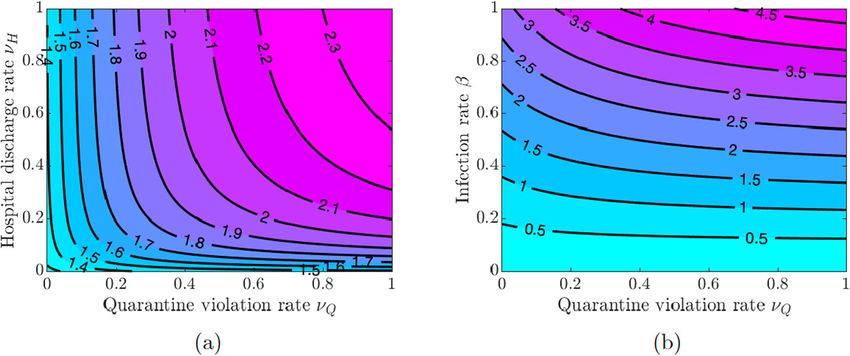
Agusto et al. BMC Public Health    (2022) 22:138                                                                           Page 5 of 20

for their values. Furthermore, the following values were                Following [12], we define
taken for the initial conditions: the initial total population
was taken as the population at the year 2020, i.e., N(0) =                           0    if t < tclose orxS < 1/2
                                                                            C(t) =                                                 (4)
6, 828, 000; the initially infected individuals as I(0) = 1.                         C0 if t ≥ tclose andxS ≥ 1/2
which is the same as the initial number of infected in the
data. We assumed E(0) = 101, A(0) = 100, Q(0) =                         where C0 is a combined measure of the effectiveness of
0, H(0) = 0 and R(0) = 0, so the initial susceptible are                physical distancing in those workplaces that remain open
S(0) = N(0) − E(0) − A(0) − I(0) − Q(0) − H(0) − R(0).                  and how many workplaces are closed. The decision to
   The resulting fitted parameter values are ηA =                       close schools and workplaces is “turned on” if the time
0.45, ηQ = 0.0101, ηH = 0.4509, γI = 0.5997, γA =                       after the start of the pandemic is at least tclose and at
0.236, γQ = 0.3815, γH = 0.0107, ωQ = 0.5326, ωH =                      least half of the (susceptible) population supports closure.
0.7495, νQ = 0.4586, νH = 0.0126, and δI = 0.0065.                      The closure policy is “turned off ” if less than half of the
Using these parameter estimates, and parameter values                   (susceptible) population supports closure.
tabulated in Table 2 we computed the numerical value of                   The susceptible individuals weigh the risk of the infec-
the reproduction number R0 for the COVID-19 outbreak                    tion based on the disease prevalence and the accumulating
in Arizona from January 26 to July 6, 2020 as R0 ≈ 1.84.                socio-economic losses due to the closures. The suscepti-
                                                                        ble individuals who do not support school and workplace
Model of dynamic human behavior                                         closure are willing to face the risk of infection, and their
In this section, we use the imitation dynamic approach                  perceived payoff is given by
of evolutionary game theory [35, 36] to model evolv-                       E0 = −πS [ I(t) + Q(t) + H(t)] ,                        (5)
ing human behavior in response to the pandemic and its
effect on the spread of the disease. We consider behavioral             where πS is the sensitivity to being infected with COVID-
response of both susceptible and infected individuals.                  19 parameter. The susceptible individuals who support
Susceptible individuals wish to protect themselves from                 closure efforts face socio-economic losses, and their per-
getting infected, and they consider supporting social dis-              ceived payoff is given by
tancing measures such as school and workplace closures.
                                                                           E1 = −ρS LS (t),                                        (6)
On the other hand, conscientious infected individuals
consider self-isolation as means to protect the rest of the             where ρS is the sensitivity to the accumulated socio-
population. We begin by modeling each type of behav-                    economic losses LS (t), as in [12].
ior separately, and then we implement both behavioral                     We now describe how the behavioral responses of sus-
responses within our baseline COVID-19 model.                           ceptible individuals evolve with time. An individual who
                                                                        did not support closure but decided to switch its strategy
Susceptible individual support for school and workplace                 achieves a payoff gain
closure
As the pandemic rages on without any known phar-                             ES = E1 −E0 = πS [ I(t)+Q(t)+H(t)] −ρS LS (t). (7)
maceutical drugs or vaccines, using personal protection
equipment (PPE), washing hands, social distancing, and                    We assume that individuals employ a social learning
economic lock-downs are the measures recommended to                     process where they adopt strategies of other individuals
contain and control the disease [37–39]. We adopt the                   with the rate proportional to the payoff gain, which can
approach of [12] to model the behavioral response of                    be realized via an imitation dynamic. The proportion of
the susceptible individuals. The susceptible individuals                susceptible individuals who support closure thus evolves
have two strategies to choose from: to support closure or               according to
not to support closure; we let xS (t) denote the propor-                    dxS
tion of susceptible individuals that support closure. The                       = κS xS (1 − xS ) ES ,                             (8)
                                                                             dt
time-varying function C(t) captures the impact of social
                                                                        where κS is the social learning rate. The individuals who
distancing measures such as school and workplace clo-
                                                                        do not support closure (1−xS ) sample the individuals who
sure on the transmission of COVID-19. The evolution of
                                                                        do support closure (xS ) and switch their strategy at the
the susceptible and exposed sub-populations with social
                                                                        rate proportional to the payoff gain ES . Using Eq. 7, we
distancing becomes
                                                                        obtain
dS                                                                      dxS
   = − β[ 1 − C(t)] [ I(t) + ηA A(t) + ηQ Q(t) + ηH H(t)] S(t)              = κS xS (1 − xS ){πS [ I(t) + Q(t) + H(t)] −ρS LS (t)}. (9)
dt
                                                                         dt
dE
   = β[ 1 − C(t)] [ I(t) + ηA A(t) + ηQ Q(t) + ηH H(t)] S(t) − σ E(t)
dt                                                                        Individuals are thus more likely to support closure if the
                                                                 (3)    prevalence of the infection is high and/or socio-economic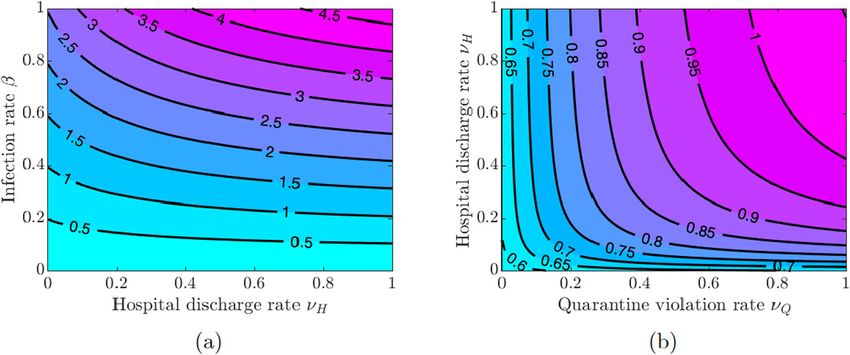
Agusto et al. BMC Public Health      (2022) 22:138                                                                      Page 6 of 20

losses due to the closures are low. On the other hand, due     tion term involving I(t) becomes (1 − xI (t))I(t). Hence,
to the accumulating nature of the socio-economic losses,       the equations for the susceptible and exposed individuals
individuals are not likely to support closure for too long.    from the baseline model become
  Since scaling payoff functions does not affect the out-
come, we can replace ES given by (7) with ES = I(t) +          dS
                                                                  = − β{[ 1 − xI (t)] I(t) + ηA A(t) + ηQ Q(t) + ηH H(t)}S(t)
Q(t) + H(t) − (ρS /πS )LS (t). Then                            dt
                                                               dE
                                                                  = β{[ 1 − xI (t)] I(t) + ηA A(t) + ηQ Q(t) + ηH H(t)}S(t) − σ E(t)
    dxS                                                        dt
        = κS xS (1−xS )[ I(t)+Q(t)+H(t)−εS LS (t)] , (10)                                                                      (12)
     dt

where εS = ρS /πS is the sensitivity to the socio-economic       A symptomatically infected individual who elects not to
losses relative to getting infected with COVID-19.             self-isolate faces the burden of infecting other individuals.
  Finally, following [12], the evolution of the time-varying   These individuals use the publicly available information
quantity LS (t), which represents the accumulated socio-       on the COVID-19–induced death rates to estimate the
economic losses, obeys the exponential fading memory           extent of the burden. We therefore assume that the payoff
mechanism given by                                             of an individual who chooses not to self-isolate is given by

    dLS                                                            E0 = −πI [ δI I(t) + δQ Q(t) + δH H(t)] ,                   (13)
        = αS C(t) − ξS LS (t),                         (11)
     dt
                                                               where πI is the sensitivity to infecting others parameter.
where αS controls the rate at which school and workplace       On the other hand, an infected individual who decides to
closures impacts socio-economic health of the population,      self-isolate faces a fixed cost of such a decision because the
and ξS is a decay rate that represents adjustment to the       length of self-isolation is approximately equal to the time
baseline losses.                                               it takes to recover. Hence, the payoff of an individual who
                                                               chooses to self-isolate is given by
Infected individual self-isolation
While susceptible individuals seek to avoid getting
                                                                   E1 = −ρI ,                                                  (14)
infected, the symptomatically infected individuals can-
not help themselves. We thus assume that conscientious
                                                               where ρI is the sensitivity to self-isolation parameter.
symptomatically infected individuals seek to minimize the
                                                                 Similar to the closure support model described above,
potential damage to the susceptible part of the population.
                                                               the proportion of symptomatically infected individuals
  Since COVID-19 was elevated to pandemic status, self-
                                                               who elect to self-isolate evolves according to the imitation
isolation and quarantine had been the prescribed non-
                                                               dynamic
pharmaceutical measures aimed at flattening the inci-
dence curve. China (at the peak of infection) instituted           dxI
mandatory quarantine of individuals and some parts of                  = κI xI (1−xI ){δI I(t)+δQ Q(t)+δH H(t)−εI }, (15)
                                                                   dt
the country [40, 41]. Other countries imposed travel bans
and recommended 14-day quarantines (via self-isolation)        where κI is the self-isolation social learning rate, and εI =
for their citizens who travel to hotspot places [42–44].       ρI /πI is the sensitivity to self-isolation relative to infect-
However, people break and violate self-isolation and quar-     ing others. The (conscientious) infected individuals would
antine [21, 23] either due to quarantine fatigue or to         tend to self-isolate if the COVID-19–induced death toll is
other factors such as procuring material needs or limited      high, while they would tend not to self-isolate as long as
opportunities to maintain isolation [45, 46]. Some have        the death rates become sufficiently low.
engaged in even more deadly behaviors ignoring policies
and attending large social gatherings [9, 10].                 The COVID-19 model with combined dynamic behavior
  We assume that the symptomatically infected individu-        We now combine the two types of adaptive strategic
als who tested positive for COVID-19 and were ordered          responses in the population. The susceptible individuals
to quarantine themselves leave quarantine at a constant        elect to either support or not support school and work-
rate νQ . However, symptomatically infected individuals        place closures, while infected individuals elect to self-
(I(t)) whose condition was not severe enough to go to          isolate or not to self-isolate. Combining Eqs. 3 and (12)
a hospital and/or get tested may elect to self-isolate to      and replacing the corresponding equations in the base-
protect others. Let xI (t) be the proportion of symptomat-     line model (1) results in a coupled COVID-19 model with
ically infected individuals I(t) who elect to self-isolate.    combined behavioral effects where parts of the popula-
We assume that self-isolated individuals do not contribute     tion adjust their behavior after sampling or learning other
to the spread of the infection, and the force of infec-        people’s behavior according to the appropriately defined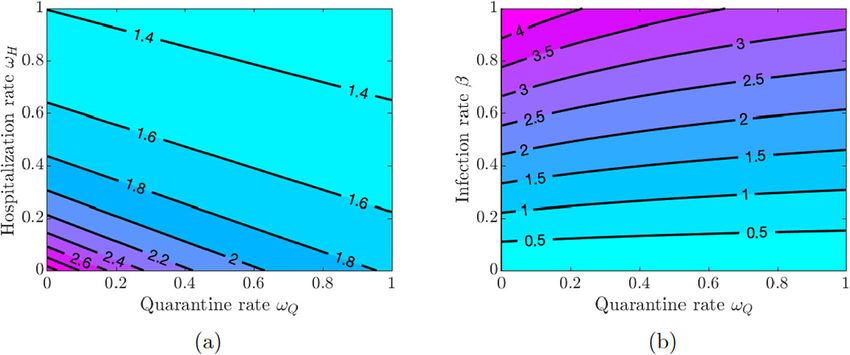
Agusto et al. BMC Public Health   (2022) 22:138                                                                              Page 7 of 20

payoffs. This coupled disease-behavior system is given by         Table 3 The dynamic human behavior model state variables and
                                                                  parameters
the following system of ordinary differential equations:
                                                                  Variable                Description
                                                                  xS (t)                  Proportion of susceptible individuals who
  dS                                                                                      support closure
     = − β[ 1 − C(t)] [ (1− xI (t))I(t) + ηA A(t) + ηQ Q(t)
  dt                                                              xI (t)                  Proportion of symptomatically infected
                                                                                          individuals who self-isolate
      + ηH H(t)] S(t)
                                                                  C(t)                    Impact of school and workplace closures
  dE
     = β[ 1 − C(t)] [ (1 − xI (t))I(t) + ηA A(t) + ηQ Q(t)        LS (t)                  Accumulated socio-economic losses due to
  dt
                                                                                          closures
      + ηH H(t)] S(t) − σ E(t)
 dA                                                               Parameter               Description
     = qσ E(t) − (γA + δA )A(t)
 dt                                                               κS                      Support for closure social learning rate
  dI
     = (1 − q)σ E(t) + νQ Q(t) + νH H(t)                          κI                      Self-isolation social learning rate
  dt
                                                                  εS                      Sensitivity to socio-economic losses relative
      − (ωQ + ωH + γI + δI )I(t)                                                          to COVID-19 infection
 dQ                                                               εI                      Sensitivity to self-isolation relative to
     = ωQ I(t) − (νQ + γQ + δQ )Q(t)                                                      infecting others
 dt
 dH                                                               tclose                  Initial time closures may take effect
     = ωH I(t) − (νH + γH + δH )H(t)
 dt                                                               C0                      Effectiveness of the closure measures
 dR                                                               αS
     = (γA + δA )A(t) + (γI + δI )I(t) + (γQ + δQ )Q(t)                                   Closure impact rate on socio-economic
  dt                                                                                      health
      + (γH + δH )H(t)                                            ξS                      Decay rate for socio-economic losses
dxS
    = κS xS (t)(1 − xS (t))[ I(t) + Q(t) + H(t) − εS LS (t)]
 dt
dLS
    = αs C(t) − ξS LS (t)
 dt
                                                                  infectious individuals from hospitals rate νH , and the
dxI
    = κI xI (t)(1 − xI (t))[ δI I(t) + δQ Q(t) + δH H(t) − εI ]   infection rate β in pairs and examine the effect of these
 dt
                                                                  variations on the value of R0 .
                                                          (16)
                                                                    Figure 3(a) shows that increasing quarantine and hos-
                                                                  pitalization rates reduces the value of R0 , but the disease
The game-theoretic model of dynamic human behavior                burden is still high because the values of R0 are greater
state variables and parameters are summarized in Table 3.         than one. However, Fig. 3(b) shows that the values of R0
                                                                  can be kept below 1 as long as the values of β do not
Results                                                           exceed a certain threshold (β ≈ 0.22), and this outcome
Simulating the baseline COVID-19 model                            does not depend on the quarantine and hospitalization
We begin by analysing a baseline model of COVID-                  rates (see also Fig. 4(a) in Appendix A). Using this lower
19 transmission with quarantine and hospitalization               level of the infection rate, we see in Fig. 4(b) in Appendix A
(described in Section 6). We then analyze two models of           that R0 can be kept below 1 provided either the quar-
dynamically adapting human behavior within the baseline           antine rate is above 0.4 or the hospitalization rate is
model (described in Section 6): support for school and            above 0.2.
workplace closures by susceptible individuals to protect            If symptomatically infected individuals violate quaran-
themselves from infection, and self-isolation by symp-            tine or are discharged from the hospitals into the commu-
tomatically infected individuals to protect others from           nity due to overwhelmed demand for hospitalizations or
infection. We analyze the effect of each type of behavior         lack of resources, then the disease burden is high and con-
on the spread and prevalence of COVID-19 separately and           taining the disease becomes challenging as values of R0
jointly.                                                          are greater than 1 for all values of νQ and νH (see Fig. 5(a)
                                                                  in Appendix A). The situation is even worse if quarantine
Impact of quarantine and hospitalization                          violation is varied along with poor hygiene and disregard
Here, we investigate the impact of quarantine and hospi-          for social distancing, which increases the infection rate β.
talization on the disease transmission. We vary the values        Figures 5(b) and 6(a) show that R0 < 1 as long as the val-
of the quarantine rate ωQ , hospitalization rate ωH , quar-       ues of β do not exceed approximately the same threshold
antine violation rate νQ , early discharge of symptomatic         value β ≈ 0.22 as in the case of varying quarantine and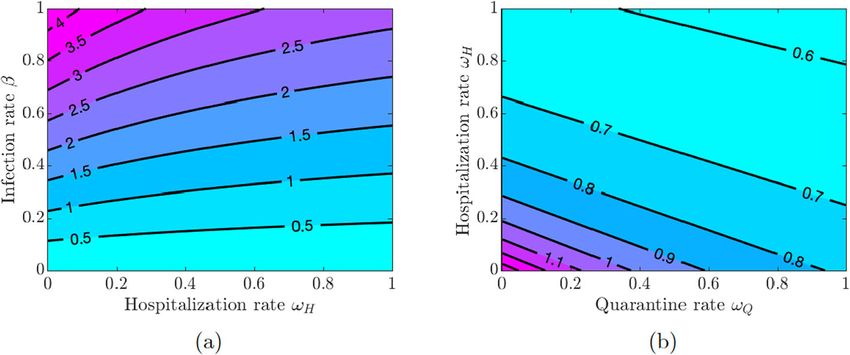
Agusto et al. BMC Public Health      (2022) 22:138                                                                                        Page 8 of 20

 Fig. 3 Contour plot of the COVID-19 reproduction number R0 given in Eq. 2. a Varying quarantine rate ωQ and hospitalization rate ωH . b Varying
 quarantine rate ωQ and infection rate β

 Fig. 4 Contour plot of the COVID-19 reproduction number R0 given in Eq. (2). a Varying quarantine violation rate νQ and hospital discharge rate νH .
 b Varying infection rate β and quarantine violation rate νQ

 Fig. 5 Simulation of the baseline COVID-19 model (1) for the proportions of symptomatically infected (I), quarantined (Q), and hospitalized (H)
 individuals. Solid lines correspond to base values of the model parameters from Table 2. a Dashed lines correspond to double quarantine
 (ωQ = 2 × 0.5326) and hospitalization (ωH = 2 × 0.7495) rates b Dashed lines correspond to double quarantine violation (νQ = 2 × 0.4586) and
 hospital discharge (νH = 2 × 0.0126) rates
Agusto et al. BMC Public Health (2022) 22:138 Page 9 of 20
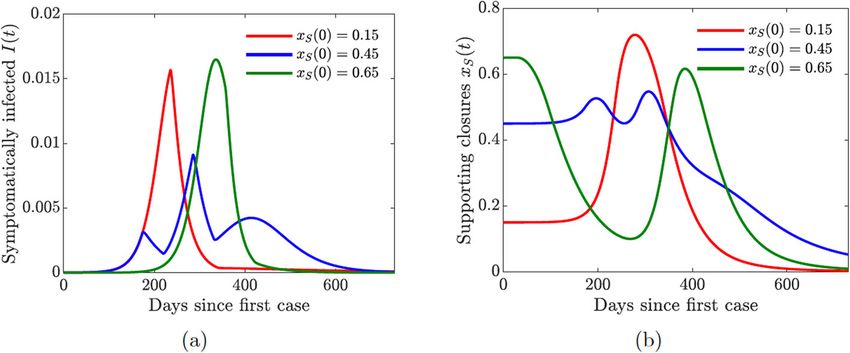
Fig. 6 Simulations of the COVID-19 model with dynamic human behavior (16) with various initial proportions xS (0) of the susceptibles in support of
lock-down. The social learning rate of susceptible individuals is κS = 1. a The progression of the proportion of symptomatically infected individuals
I(t). b The progression of the proportion of the susceptible population in support of the closure or lock-down measures. The measures are enacted
as long as t ≥ tclose and xS (t) ≥ 0.5
hospitalization rates. Figure 6(b) in Appendix A shows uals span three compartments: I, Q, and H. Figure 7(a)
that the values of R0 are below 1 provided the quarantine shows the effect of doubling the quarantine (ωQ = 2 ×
violation rate νQ is below 0.7 or the hospital discharge rate 0.5326) and hospitalization (ωH = 2 × 0.7495) rates. The
νH is below 0.4. Moreover, R0 < 0.75 if both νQ and νH overall number of infections is reduced, and the epidemic
are below 0.2. curve is flattened, while the peak of the infection is shifted
The results in Figs. 3 and 5 show the importance of to later in time. On the other hand, doubling the quaran-
keeping the infection rate β low in order to reduce the dis- tine violation (νQ = 2 × 0.4586) and hospital discharge
ease burden. This can be achieved by maintaining proper (νH = 2 × 0.0126) rates results in a higher infection peak
hygiene (washing hands as recommended), social distanc- that occurs sooner; see Fig. 7(b). These simulations fur-
ing, and using facial masks. ther suggest, as expected, that a larger COVID-19 burden
would be recorded if more people violate the quaran-
Role of quarantined and hospitalized individuals tine rules, while increasing the quarantine rate lowers the
In this section, we investigate the impact of quarantine disease burden in the community.
and hospitalization on the proportion of infected individ- In summary, the simulations of the COVID-19 model
uals that exhibit symptoms of COVID-19. These individ- (1) with static human behavior show that:
Fig. 7 Simulations of the COVID-19 model with dynamic human behavior (16) with various initial proportions xI (0) of symptomatically infected
individuals willing to self-isolate. The social learning rate of infected individuals is κI = 100, and the sensitivity to self-isolation is εI = 0.00008. a The
progression of the proportion of symptomatically infected individuals I(t). b The progression of the proportion of symptomatically infected
population willing to self-isolate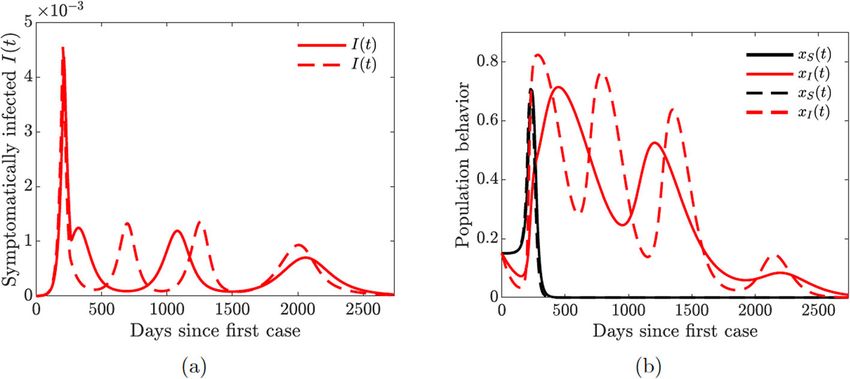
Agusto et al. BMC Public Health (2022) 22:138 Page 10 of 20
(i) Increased quarantine violation and hospital discharge When the population is initially skeptical about the
rates of those still infectious due to overwhelmed closures (xS (0) = 0.15), then it takes a while to build suf-
hospital resources increases the disease burden ficient support for the measure to be enacted (Fig. 8(b),
leading to an early epidemic peak. red line). As a result, the closures take place too late,
(ii) Increasing quarantine and hospitalization rates and the pandemic reaches its peak early on (Fig. 8(a), red
decreases the disease burden and reduces the line). On the other hand, when the population is initially
epidemic peak. Moreover, these measures postpone overenthusiastic about the closures (xS (0) = 0.65), the
the peak of the infection, thus giving more time to measure is enacted too early (Fig. 8(b), green line). How-
prepare for the coming spike of the disease. ever, the accumulating socio-economic losses due to the
lock-down start to wear people down, and the majority
Simulating the COVID-19 model with dynamic human
of the population begins to oppose the lock-down. This
behavior
results in a sharp peak of the cases (Fig. 8(a), green line),
Perceived risk of infection drives human behavior and
which is simply delayed in time. The rise in the prevalence
decisions during an epidemic. These behaviors and deci-
of infection forces individuals to revert to the lock-down
sions are derived from evaluating alternative decisions
measures, but this switch in behavior comes too late to
and weighing related cost-benefit [47]. In this section,
prevent a spike in infections.
we analyze the effects of dynamically changing human
The lowest infection peaks are achieved when the pro-
behavior by susceptible and symptomatically infected
portion of susceptible individuals initially supporting the
individuals within the baseline COVID-19 model (1); the
closures is neither too low or too high but “just right”
extended model is given by Eqs. 16. Unlike previous
(xS (0) = 0.45). The lock-down is enacted as soon as the
analyzes which focused on how susceptible individuals
number of cases begins to increase (Fig. 8(a) and (b), blue
change their behavior related to the use and acceptance of
lines). The initial epidemic is stifled, and the closure sup-
public health protective and preventive control measures
port drops below the threshold, which results in (partial)
[12, 13, 35, 36, 48], we also consider change in behavior
re-openings. However, the number of infected individuals
and decision making of the downstream symptomatically
is still relatively high, and a second bigger wave of infec-
infected population. The state variables and parameters
tions occurs. The second wave forces another shutdown,
associated with the behavioral model are summarized in
which persists for a shorter period of time compared to
Table 3.
the first one. This scenario is similar to what has been
Susceptible support for closure happening in the US, and it shows that a second wave
We begin by analyzing the effect of the susceptible indi- of COVID-19 may result from rational human behav-
viduals support or opposition of school and workplace ior due to the burden of accumulating socio-economic
closures. To isolate the effect of susceptible individual losses. This observation matches the results in [12], and
behavior, we assume that κI = 0 and xI (0) = 0, that it shows that our extended model with quarantine and
is, the symptomatically infected individual behavior is hospitalization still captures the basic features of a simpler
suppressed. Our modeling approach to the susceptible model.
individual behavior is derived from [12], and is described For simplicity, we used only one value of the susceptible
in Section 6. Susceptible individuals seek to avoid get- individual social learning rate parameter (κS = 1) here.
ting infected, and they weigh perceived risk of infec- We investigate the effects of varying this parameter when
tion versus the possible socio-economic losses due to we analyze a coupled model of susceptible and infected
the partial economy shutdown; the socio-economic losses individual behavior. In particular, faster social learning
accumulate over time. We assumed that the decision to rates may result in multiple waves of infection.
enact appropriate closures stays in effect if and only if a
certain minimum time has passed since the start of the Symptomatically infected self-isolation
pandemic and at least half of the susceptible population We now analyze the effect of voluntary decisions to
supports closures. self-isolate by symptomatically infected individuals. We
In all simulations involving susceptible individual sup- assume that κS = 0 and xS (0) = 0 so that suscepti-
port for closure, we assume that the effectiveness of clo- ble individual support for closure behavior is suppressed.
sures is C0 = 0.6 and the initial time the closure decision Our modeling approach to symptomatically infected indi-
may be enacted is tclose = 30 days. Figure 8(a) shows vidual behavior is described in Section 6 Unlike sus-
the effect of dynamically changing susceptible individual ceptible individuals, who seek to protect themselves
behavior on the progression of the epidemic with different from the infection, infected individuals cannot protect
starting conditions, which capture the initial predisposi- themselves—they are already infected. However, consci-
tion of the population towards such drastic measures as entious individuals may wish to protect the rest of the
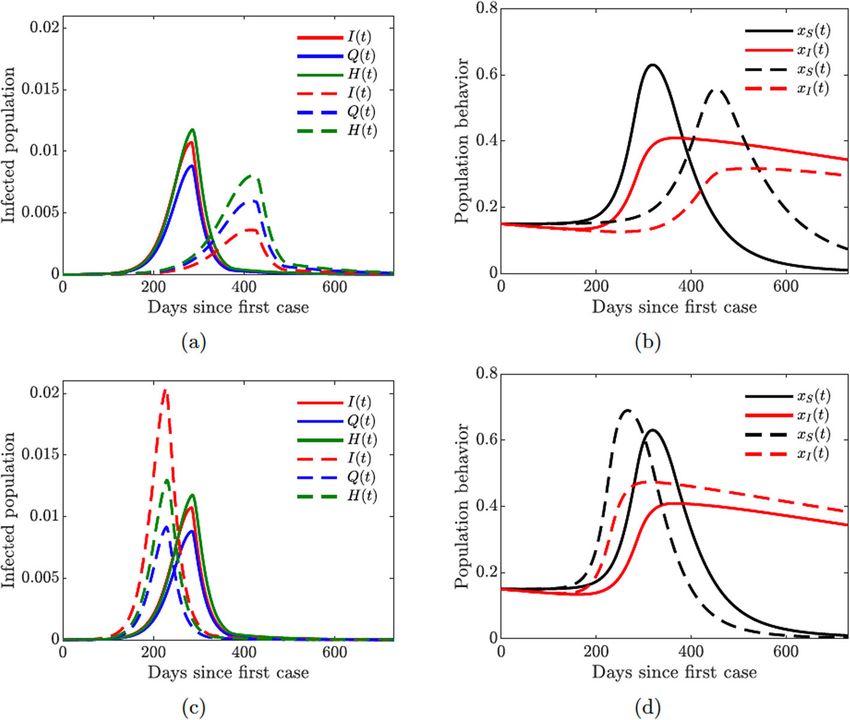
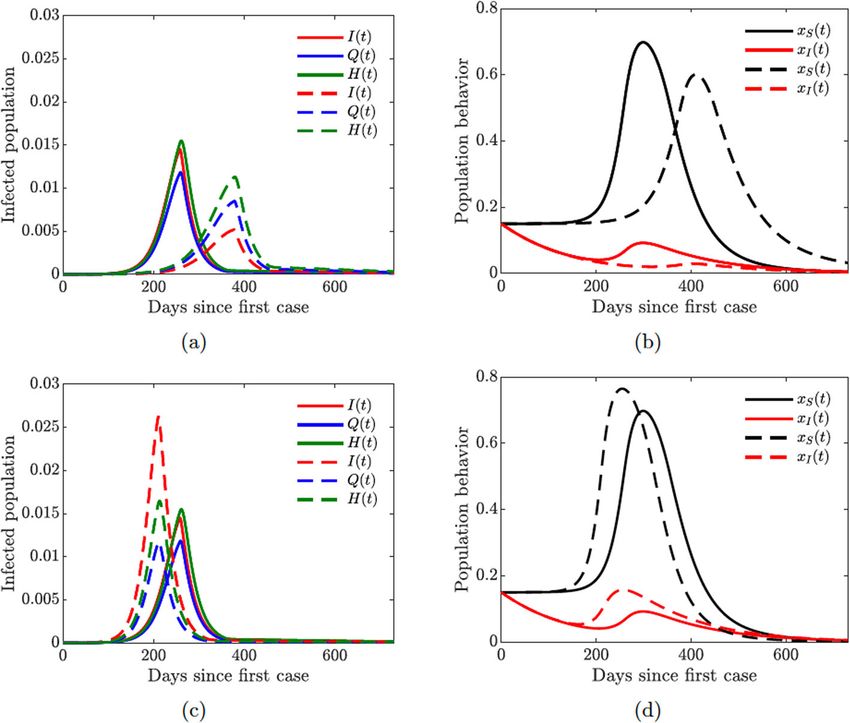
school and workplace closures. population from getting infected; these individuals weighAgusto et al. BMC Public Health (2022) 22:138 Page 11 of 20 Fig. 8 Simulations of the COVID-19 model with dynamic human behavior (16) for the proportions of all symptomatic infections and behavioral response with low sensitivity to self-isolation εI = 0.00001. The social learning rates are κS = 1 and κI = 100, and xS (0) = xI (0) = 0.15. Solid lines correspond to the values of the baseline model parameters given in Table 2. a–b Dashed lines correspond to double quarantine (ωQ ) and hospitalization (ωH ) rates c–d Dashed lines correspond to double quarantine violation (νQ ) and hospital discharge (νH ) rates the perceived burden of infecting others versus the incon- self-isolation results in bigger and more sustained support venience and cost of self-isolation. of self-isolation. Figure 9(a) shows the impact of dynamically changing infected individual behavior to self-isolate or not self- Human behavior coupled with quarantine and isolate on the progression of the epidemic. At the onset hospitalization of the epidemic, when the number of cases and fatalities In this section, we consider the full behavioral model, is relatively small, infected individuals would tend not to where both susceptible and symptomatically infected engage in voluntary self-isolation (Fig. 9(b)). As the num- individuals adjust their behavior in response to the epi- ber of infections—and hence disease-induced deaths— demic. We initialize the model simulations with only grows, the burden on the susceptible population becomes 15% of the susceptible population supporting closure and larger, and the infected individuals are more willing to self- 15% of the symptomatic population willing to self-isolate, isolate to protect others. The initial predisposition of the which correspond to the worst-case scenarios considered population to the altruistic act of self-isolation determines in Figs. 8(b) and 9(b). the peak of the epidemic and its timing (Fig. 9(a)). The Figure 10 shows the results of the simulation with vary- more individuals are willing to self-isolate, the lower the ing quarantine (ωQ ), hospitalization (ωH ), quarantine vio- peak and the later it occurs. lation (νQ ), and hospital discharge (νH ) rates. The peak of We considered one set of fixed values of the symptomat- the epidemic is lower and shifted to the right in time with ically infected individual social learning rate parameter higher quarantine and hospitalization rates (Fig. 10(a)), κI and the sensitivity to self-isolation parameter εI . We while an opposite effect is achieved with higher quaran- investigate the effects of varying these parameters in a full tine violation and hospital discharge rates (Fig. 10(c)). The behavioral model. In particular, lowering the sensitivity to population behavioral response is informed by the severity
Agusto et al. BMC Public Health       (2022) 22:138                                                                                       Page 12 of 20

 Fig. 9 Simulations of the COVID-19 model with dynamic human behavior (16) showing multiple waves of epidemic while varying susceptible (κS )
 and symptomatic (κI ) individual social learning rates with low sensitivity to self-isolation εI = 0.00001. Solid lines correspond to κI = 20, dashed
 lines correspond to κI = 650. a Proportion of symptomatic infections I(t) with one big and two smaller waves (solid lines), κS = 10. b Proportion of
 susceptible (xS ) and symptomatic (xI ) individuals adopting positive behavior, κS = 10. c Proportion of symptomatic infections I(t) with two big and
 one small wave (solid lines), κS = 30. d Proportion of susceptible (xS ) and symptomatic (xI ) individuals adopting positive behavior, κS = 30

 Fig. 10 Simulations of the COVID-19 model with dynamic human behavior (16) showing epidemic oscillations with high self-isolation social
 learning rate. Solid lines correspond to κI = 650, dashed lines correspond to κI = 1350; fixed values κS = 5 and εI = 0.00001. a Oscillating
 proportion of symptomatic infections I(t). b Proportion of susceptible (xS ) and symptomatic (xI ) individuals adopting positive behavior
Agusto et al. BMC Public Health       (2022) 22:138                                                                                          Page 13 of 20

of the epidemic: higher prevalence of the disease results                       such measures, while individuals who will lose their jobs
in larger proportions of individuals supporting closure or                      while part of the economy is shut down are less likely to
willing to self-isolate (Fig. 10(b) and (d)).                                   support measures that may result in loss or reduction of
  Figure 10 illustrates the importance of discouraging                          their income. Therefore, susceptible individuals may have
disease-magnifying behavior such as violating and break-                        different sensitivity to the socio-economic losses, and that
ing quarantine laws. Moreover, lower sensitivity to self-                       is why we assumed that the social learning rate κS for clo-
isolation (εI = 0.00001 in Fig. 10 compared to εI =                             sure support behavior is lower than that for self-isolating
0.00008 in Fig. 11 given in Appendix B) allows the self-                        behavior (κI ).
isolating behavior to persist for a longer period of time                          Figure 12 shows that increasing the support closure
(compare Fig. 10(b) with 11(b) and Fig. 10(d) with 11(d))                       behavior social learning rate κS produces oscillations in
thus effectively reducing the burden of the infection on                        the behavioral response and hence in the prevalence of
the susceptible part of the population (compare Fig. 10(a)                      the disease. For higher values (κS = 30, see Fig. 12(c)), we
with 11(a) and Fig. 10(c) with 11(c)). It is therefore impor-                   observe two waves of infections of similar magnitude. On
tant to encourage and incentivize such exemplary behav-                         the other hand, simultaneous increase in the self-isolation
ior by infected individuals.                                                    behavior social learning rate (κI = 650) coupled with low
                                                                                sensitivity to self-isolation (εI = 0.00001) allows the pop-
Multiple waves of infections                                                    ulation to overcome a second large wave of the pandemic
In this section, we demonstrate the possibility of multiple                     by responding quickly and decidedly to the first big wave
waves of infection as a consequence of modifying the rates                      (see dashed lines in all panes of Fig. 12). Still, increasing
of behavioral response to the emerging epidemic condi-                          the self-isolation social learning rate parameter does not
tions. The rates of behavioral response are controlled by                       prevent a second large wave of the pandemic if the popu-
the social learning rate parameters κS and κI for suscepti-                     lation sensitivity to self-isolation is higher (εI = 0.00008),
ble and symptomatically infected individuals, respectively,                     see Fig. 13 in Appendix C.
in the imitation dynamics model. Higher values of these                            Multiple waves of infection of similar magnitude may
parameters mean individuals imitate the behavior of other                       occur if the closure support social learning rate is low
individuals, who are more successful according to the                           (κS = 5) while the self-isolation social learning rate is
dynamic game payoffs, more eagerly. This effects quicker                        high (κI = 1350) and sensitivity to self-isolation is low
response to the evolving conditions, which may result in                        (εI = 0.00001); see Fig. 14. This may seem counter-
multiple oscillations of both the behavioral response and                       intuitive because higher willingness to self-isolate should
infections curves.                                                              ideally result in quick suppression of a spike in disease. At
  In general, we assumed that κS < κI because supporting                        the same time, with high sensitivity to the epidemiolog-
school and workplace closures usually carries bigger con-                       ical situation, individuals switch back to non-compliance
cessions than self-isolation. For example, individuals who                      as soon as the situation improves but well before the dis-
can continue working remotely are more likely to support                        ease prevalence is reduced to negligible numbers. This,

 Fig. 11 Simulations of the COVID-19 model with dynamic human behavior (16) showing the damping effect of increased quarantine (ωQ ) and
 hospitalization (ωH ) rates. Solid lines correspond to base values of ωQ and ωH , dashed lines correspond to a 5-fold increase in these values; fixed
 values κS = 5, κI = 1350, and εI = 0.00001. a Proportion of symptomatic infections I(t). b Proportion of susceptible (xS ) and symptomatic (xI )
 individuals adopting positive behavior
Agusto et al. BMC Public Health (2022) 22:138 Page 14 of 20 Fig. 12 Simulations of the COVID-19 model with dynamic human behavior (16) showing the devastating effect of increased quarantine violation (νQ ) and hospital discharge (νH ) rates. Solid lines correspond to base values of νQ and νH , dashed lines correspond to an 8-fold increase in these values; fixed values κS = 5, κI = 650, and εI = 0.00001. a Proportion of symptomatic infections I(t). b Proportion of susceptible (xS ) and symptomatic (xI ) individuals adopting positive behavior in turn, results in a new spike of infections. We note that sistent prevalence of the disease with regular spikes in the this phenomenon is amplified by the presence of quaran- number of cases. tine violation in our model because quarantine violation In summary, the simulations of the COVID-19 model often results in outbreaks [49]. When the quarantine vio- with dynamic human behavior (16) show that: lation rate νQ is set to zero, we no longer observe multiple epidemic waves of such magnitude. (i) Symptomatic individuals learning and mimicking Figures 12 and 14 show the possibility of multiple epi- self-isolating behavior reduces the disease burden in demic waves or an epidemic with several oscillations. We the population but can lead to multiple epidemic have seen that the persistence of these waves is due to waves if fewer susceptible individuals mimic and the high rate of social learning behavior of the susceptible learn closure support behavior. or symptomatically infected individuals in the commu- (ii) Quarantine violation and hospital discharge of nity or the violation of the quarantine rules. We will now symptomatic individuals amplifies the peaks of the explore in more detail the impact of increased quarantine infection waves and can lead to infection waves that and quarantine violation rates on the multiple epidemic persist in the community. waves. We will couple this with varying hospitalization (iii) Increasing quarantine and hospitalization rates can and hospital discharge rates. prevent multiple waves of infection. Figure 15 shows that increasing the quarantine and (iv) It is important to incentivize the cost and burden of hospitalization rates prevents future waves of infection. self-isolation to encourage more symptomatic This is achieved by dampening multiple oscillations in individuals to self-isolate because high sensitivity to the behavior of symptomatically infected individuals and self-isolation is not beneficial to the community as a prolonged support for lock-down measures. whole. Lastly, we investigate the impact of increased quarantine violation and hospital discharge rates on multiple waves of Discussion infection. We see from Fig. 16 that increasing quarantine We constructed a novel compartmental model of COVID- violation and hospital discharge rates produces multi- 19 transmission, which includes compartments for quar- ple epidemic peaks of larger magnitude. Higher initial antined and hospitalized individuals; see Fig. 1 and Eqs. 1. prevalence of the disease (Fig. 16(a) dashed line) causes We coupled this model with a game-theoretic model of multiple oscillations in self-isolating behavior (Fig. 16(b)) dynamically changing human behavior in Eqs. 16. The and hence future waves of infection. susceptible individuals choose to either support school The take home-message from the results presented in and workplace closures or not, and their strategic choices Figs. 15 and 16 is that increased hospitalization and quar- are driven by the perceived risk of getting infected versus antine rates can help diminish future infection waves and the sensitivity of possible socio-economic losses due to the could even lead to the disappearance of a second large (partial) lock-down. The symptomatically infected indi- wave. However, frequent quarantine violation and early viduals consider protecting the rest of the population by hospital discharge of those still infectious may lead to per- self-isolating from society; they base their decisions on the
Agusto et al. BMC Public Health   (2022) 22:138                                                                   Page 15 of 20

perceived burden of the disease versus the burden of social     isolating to not self-isolating while the prevalence of the
isolation.                                                      infection is still relatively high; this results in a next wave
   We also investigated the effects of quarantine violation     of infections. The population quickly recognizes this shift
due to social non-compliance and early hospital discharge       in the state of the pandemic, and starts to self-isolate more
due to shortage of resources. Increasing the rates of quar-     often, thus suppressing this wave and repeating the cycle
antine violation and hospital discharge results in a higher     several times. On the other hand, the effect of such sen-
peak of the pandemic, which occurs earlier (Fig. 7) and         sitive behavior can be mitigated by increasing quarantine
hence could be more devastating. At the height of the           and hospitalization rates (Fig. 15).
outbreak in Michigan and New York, hospitals were dis-             Our key findings further show that when the symp-
charging early the not-too-critically ill either to nursing     tomatic infectious population learn the positive behavior
homes or simply letting them go home because hospital           or are more willing to self-isolate, the community ben-
facilities were overwhelmed [50, 51]. This prompted leg-        efits, even though this change in behavior comes at a
islation in Michigan to protect the seniors and vulnerable      cost to them. Self-isolation often comes with financial
members of the community and prevent nursing homes              implications and distress; not very many people can bear
from admitting patients with COVID-19 [52]. In other            these burdens. Hence, it is important to incentivize self-
places like Arizona, some nursing homes are actually            isolation of the symptomatic infectious population as
taking COVID-19 patients with mild symptoms [53].               many infected people will rather stay home than go to
   To reduce the disease burden in the community, it is         work since staying at home will help the public good and
important to keep the infection rate β low (approximately       create an opportunity to help save more lives [62]. One
0.22). This can be achieved by maintaining proper hygiene       way to incentivize the symptomatic infectious is to pay
(frequently washing hands for 20 seconds), social distanc-      them to stay home, perhaps via direct government subsi-
ing, and wearing facial masks. Unfortunately, the use of        dies for sick leave for infected individuals [62]. Our result
facial masks has become a polarizing topic in the United        shows that infection in the community will reduce par-
States, resulting in shaming, and violence [54–57]. Never-      ticularly if the associated cost of self-isolation is cheap.
theless, the science behind the use of facial masks shows       If this cost is high and people keep violating quarantine
that the use of surgical masks prevent the dispersal and        rules, the infection could run away and become a persis-
transmission of COVID-19 droplets and aerosols [58–             tent recurrent infection in the community, as shown in
60], and hence using facial masks is one of the critical        Figs. 14–16.
measures in combating the pandemic.                                We assumed that sensitivity to societal isolation mea-
   Figures 8 and 9, which demonstrate the effect of             sures was constant. However, public perception of these
dynamic behavior by susceptible and symptomatically             measures as necessary for the common good may change
infected individuals respectively, show that preventing the     with time. For example, it may become a social norm to
symptomatic infectious from spreading the disease is as         self-isolate in the face of a pandemic, and in this case
important as preventing the susceptible population from         infected individuals are more willing to isolate themselves
getting the infection. When the behavior of susceptible         from the rest of the population. A future iteration of
and symptomatically infected individuals was analyzed           this model should consider the effect of evolving public
separately from each other, it turned out that the peak         perception of the social stigma for those who refuse to
of the epidemic curve generated by symptomatic infec-           self-isolate. We also considered the quarantine violation as
tions willing to self-isolate was lower than the peak of the    a static feature of the model. However, the quarantine vio-
epidemic curve generated by the susceptibles who are in         lation behavior may evolve with time just as self-isolating
support of the lock-down or closure measures. Thus, it          behavior. Constructing a dynamic game model of evolving
is essential to prevent people from violating quarantine        quarantine violation behavior could involve an adaptive
and social isolation rules especially as young people have      dynamic approach.
been throwing “coronavirus parties” [9]. These parties are         Additional concerns should be given to the ability to
hosted either to defy social distancing rules or to get         self-isolate. Proscriptive guidelines and current policies
infected in hope to possibly build up immunity against the      often fail to recognize that certain populations are less
virus or simply because some people still think the virus is    able or willing to stay at home due to compromised
a hoax [9, 61].                                                 living situations, financial limitations, or precarious eco-
   One of our key findings is the possibility of multiple       nomic opportunities. Further approaches should consider
waves of infections due to rational human behavior. We          how individual behaviors vary across key socioecomic and
saw in Fig. 14 that these waves can persist when the            demographic population characteristics.
rate of social learning of infected individuals is too high        While we have used this modeling work to gain
and their sensitivity to self-isolation is low. In this case,   insight into the impact of human behavior on the spread
the infected individuals switch their behavior from self-       of COVID-19 and the emergence of multiple wave of
You can also read