The Trump Vote and Covid-19 Vaccination Across US States, US Counties, and Connecticut Towns
←
→
Page content transcription
If your browser does not render page correctly, please read the page content below
The Trump Vote and Covid-19 Vaccination
     Across US States, US Counties, and Connecticut Towns

                                      January 6, 2023

                                    James W. McGuirea
a
    Department of Government, Wesleyan University, Middletown, CT, USA

Contact: James W. McGuire jmcguire@wesleyan.edu

The Version of Record of this manuscript was published January 23, 2023, in Regional and
Federal Studies. It is available at:
https://www.tandfonline.com/doi/full/10.1080/13597566.2023.2168268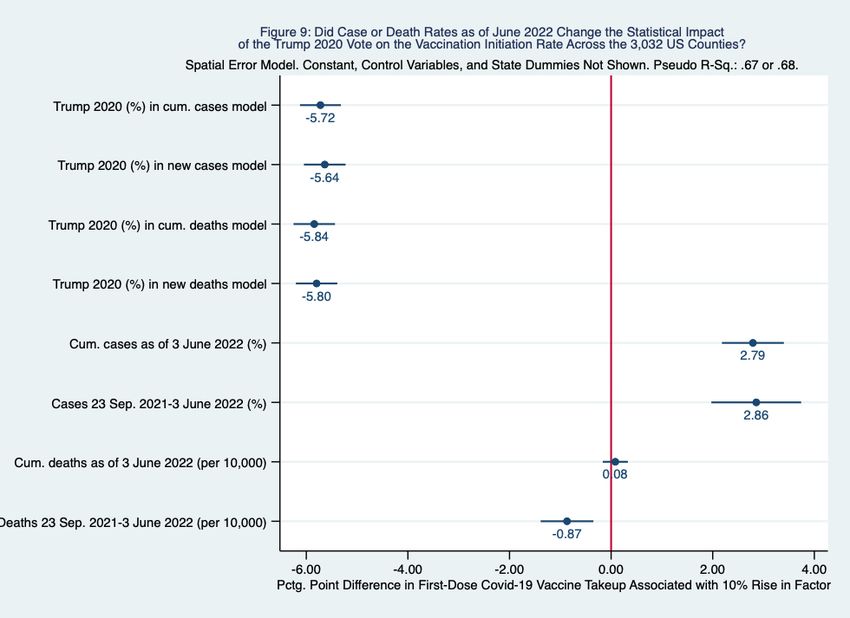
Abstract

In the United States over the past 40 years national issues and allegiances have increasingly

displaced state and local concerns and identities in shaping the preferences of voters and the

internal processes of political parties. This study finds that such nationalization has also

manifested itself in health-related behavior, specifically in the takeup of Covid-19 vaccines.

Despite the heterogeneities of US states, counties, and towns, the share of the vote that

Trump received in the 2020 US presidential election is found at each level to be a strong and

robust predictor of a lower June 2022 Covid-19 vaccination initiation rate, even after

adjusting for sociodemographic composition, spatial effects, and diverse provisioning- and

takeup-related factors. At each of the three subnational levels, the Trump 2020 vote share

was also correlated more closely than the Trump 2016 vote share or the Romney 2012 vote

share with the June 2022 Covid-19 vaccination initiation rate.

                                           Keywords

Covid-19; Vaccination; Voting; Donald Trump; Subnational; United States; Connecticut;

Spatial Autoregression; Nationalization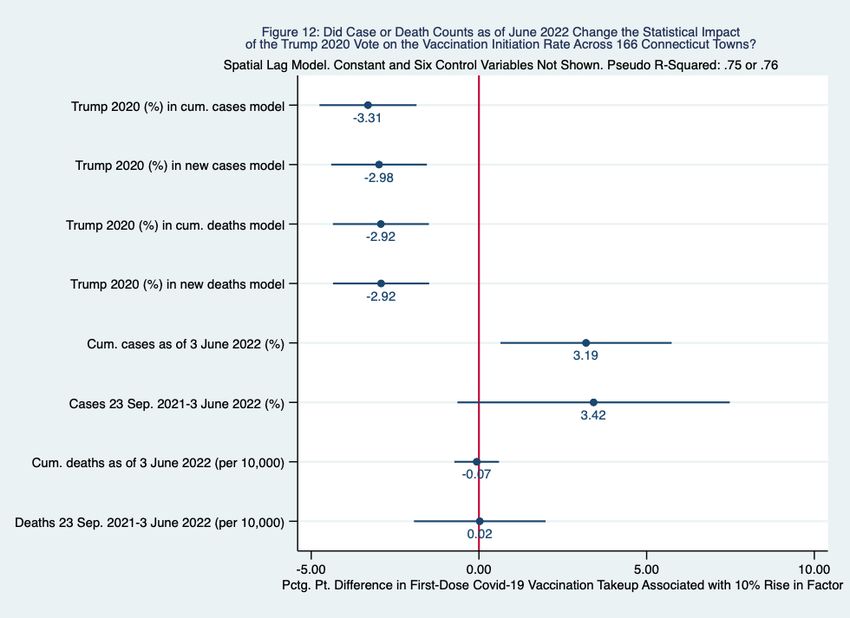
Acknowledgements

For useful comments the author is grateful to Fred Cohen, David Collier, Logan Dancey,

Kim Diver, Gary Greenberg, Imke Harbers, Daniel Hopkins, Ben Jann, Bill Johnston, John

Jost, Eunju Kang, Manolis Kaparakis, Bart Laws, Linda Schiwall, John Seery, Rich Snyder,

Frank Thompson, Christina Zuber, and two anonymous reviewers.

                                    Disclosure statement

No potential conflict of interest was reported by the author.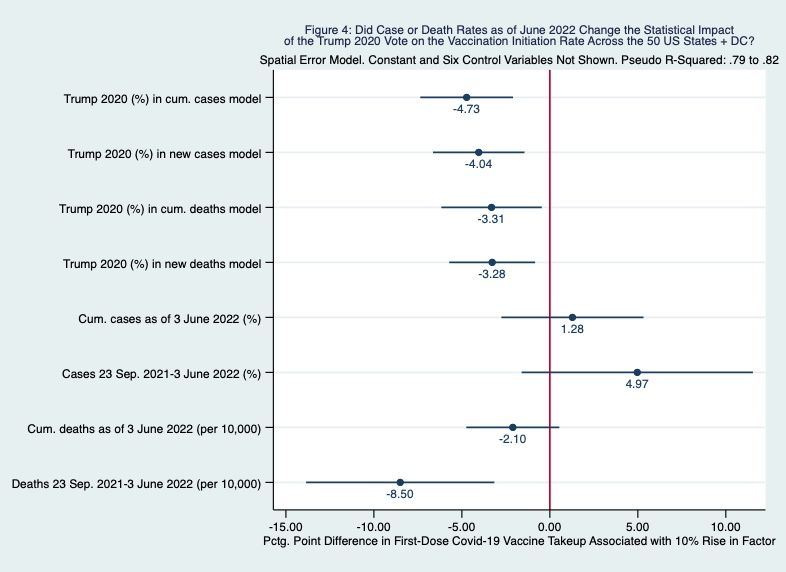
1

       For much of the 20th century the United States stood out among industrialized

democracies for the degree to which national voter choice was independent of subnational voter

choice (Hjorth and Hopkins 2020: 9). Since the early 1980s, however, voter preferences and

party processes have become increasingly nationalized. Nationalization of public opinion occurs

through ‘a multifaceted, mass-level process through which voters care less about state and local

politics and use the same criteria to pick candidates across the federal system’ (Hopkins 2018:

135). Nationalization of party processes means a rise in ‘the homogeneity of each party's

positioning across subnational units’ (Hopkins, Schickler, and Azizi 2022: 2).

       The political consequences of the nationalization of voter preferences and internal party

processes include diminished accountability of state and local incumbents to their electorates and

the conversion of certain states from ‘laboratories of democracy’ to ‘laboratories of democratic

backsliding’ as national parties ‘use the states that they control to rig the game in their favor by

limiting the ability of their political enemies to participate’ (Grumbach 2022: 10-12).

       Similar nationalization has taken place in health-related behavior, which is becoming

increasingly predictable by voter preference despite the remarkable territorial heterogeneity of

US states, counties, and towns. National leaders of the Republican Party and their allies in the

national media have disparaged Covid-19 vaccines, deriding them as ineffective or harmful. The

statements of these national party leaders and of their allies in the national mass media have, on

the one hand, encouraged Republican governors and Republican-controlled state legislatures to

limit the takeup of Covid-19 vaccines, notably by banning vaccine mandates, and, on the other,

persuaded Republican voters to reject available vaccines. As Sides et al. (2022: 252) note,

despite having approved federal subsidies for vaccine development and despite being vaccinated

himself, ‘Trump sowed distrust in the vaccine...citizens' views about the pandemic showed a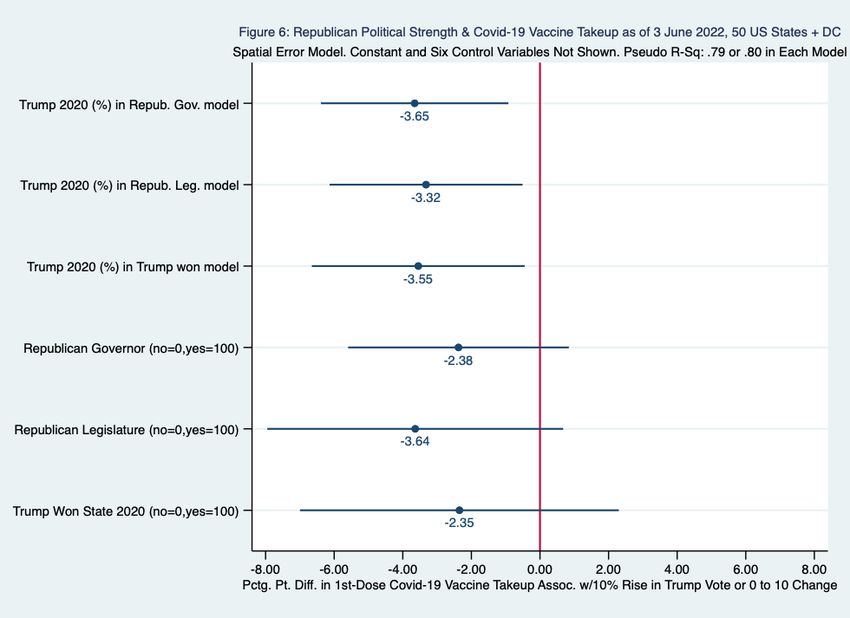
2

‘follow the leader' dynamic, whereby Democratic and Republican voters responded to what their

party’s leaders said about the risks of the virus and the measures needed to fight it.’

        In addition to confirming the findings of existing research on the nationalization of US

voter attitudes and party activity (Hopkins 2018, Grumbach 2022), the study of the takeup of

Covid-19 vaccines has important implications for public health. Between December 12, 2020,

when the CDC approved the Pfizer-BioNTech vaccine for adult usage, and November 30, 2022,

Covid-19 vaccines in the United States are estimated to have prevented 120 million infections,

18 million hospitalizations, and 3.26 million deaths (Fitzpatrick et al. 2022) -- more than four

times as many as the 0.78 million Covid-19 deaths actually recorded in the United States during

that period (CDC 2022a). In Florida and Ohio -- two states in which it is possible to link death

certificates to voter registration records -- the monthly rate of excess deaths between March 2020

and November 2021 was 76 percent higher for Republicans than for Democrats. After April 5,

2021, when Covid-19 vaccines were authorized for all adults, the figure rose to 153 percent

(Wallace et al. 2022: 3). Dr. Peter Hotez of the Baylor College of Medicine called the refusal of

Covid-19 vaccines ‘the greatest self-immolation in American history’ (Hiltzik 2022).

       The analyses reported below explore the statistical association between support for

Donald Trump and the Covid-19 vaccination initiation (first dose) rate. The findings support

both the nationalization thesis and the conjecture that demand rather than supply problems are

chiefly responsible for low Covid-19 vaccination takeup in the United States. Across US states,

US counties, and Connecticut towns alike, Trump's share of the vote in the 2020 presidential

election was associated in June 2022 with a lower Covid-19 vaccination initiation rate, even after

adjusting for population composition, the prevalence of Covid-19 cases and deaths, general

vaccine hesitancy, the quality of health care infrastructure, the political party in control of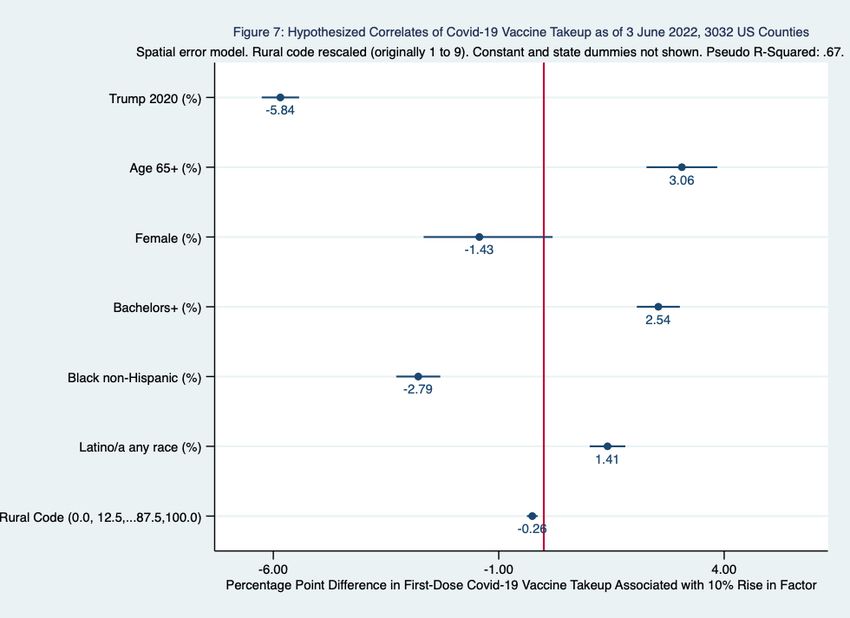
3

vaccination policy, and interactions with nearby subnational units. The low vaccination rate, in

turn, is one of the most important reasons why the United States has had higher Covid-19

infection and mortality rates than many other industrialized (and some developing) countries.

       A strong bivariate association is known to exist across US states and counties between a

higher Trump 2020 vote share and a lower Covid-19 vaccination rate, but few studies have

attempted to control for potential confounders, and fewer still have adjusted for interactions

among territorial units. Regression coefficients often change in magnitude, precision, and even

sign when the same association is tested at different levels of analysis, such as across countries,

provinces, or municipalities (Soifer 2019). If the findings hold at a variety of levels, our

confidence in their generalizability rises (Giraudy, Moncada, and Snyder 2019). This study finds

a strong and robust association between the Trump 2020 vote share and a low Covid-19

vaccination initiation rate across the 50 US states plus Washington DC, 3,032 US counties, and

166 Connecticut towns alike, adjusting for a wide range of confounders and for spatial effects.

1. The Trump Effect

       Vaccine takeup will be lower to the extent that the unvaccinated believe that a pathogen

is either unlikely to infect them or unlikely to harm them. US President Donald Trump and his

media and government allies began to encourage such beliefs about Covid-19 a few months after

the pandemic hit, apparently hoping that talking down the transmissibility of the virus and the

severity of the disease would help Trump get re-elected in November 2020. Trump and his allies

minimized the danger of Covid-19, discouraged testing, spread misinformation, opposed mask-

wearing and physical distancing, and organized superspreading events.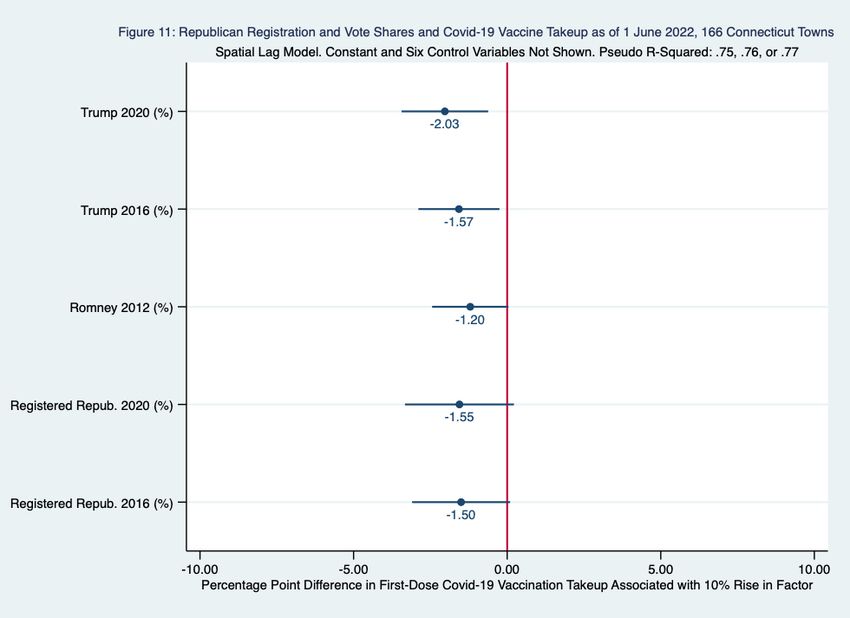
4

       By early 2021 Trump had lost the presidency, vaccines had become available, and pro-

Trump politicians and news celebrities had begun to tout refusal to get immunized against

Covid-19 as a signal of commitment to the freedom to do anything one wants, regardless of its

consequences for others. As with facemasks in 2020, ‘pro-Trump America...decided that vaccine

refusal is a statement of identity and a test of loyalty’ (Frum 2021). Republicans in the House of

Representatives accused the Biden administration of unleashing ‘Needle Nazis’ to force people

to get vaccinated, foreshadowing a campaign to confiscate peoples' guns and bibles (Lybrand

and Subramaniam 2021). In the summer and fall 2021 a dozen states with Republican-controlled

legislatures passed laws prohibiting vaccine mandates in various situations (KFF 2021). In

conservative areas of Missouri people pleaded with health workers to keep their vaccinations

quiet, or donned disguises to get vaccinated (Elamroussi 2021). In Alaska violence confronted

contact-tracers, led some pharmacies to stop offering Covid-19 vaccinations, and caused some

emergency-room personnel to stop asking about vaccination status (Berman and Krakow 2021).

       Skepticism of science and devotion to conspiracy theories have gained ground among

Republicans in recent years (Mooney 2005, Rosenblum and Muirhead 2020). In August 2021, 59

percent of Republicans surveyed by CNN/SSRS (2021) reported that ‘believing that Trump won

the 2020 election’ was either very important or somewhat important ‘to what being a Republican

means to you.’ The short-hand term used here to describe the set of processes that led to these

shifts in ‘what it means to be a Republican’ is the Trump effect. Represented here by the Trump

2020 vote share, the Trump effect is found to be associated with lower Covid-19 vaccine takeup.

       Like resistance to face masks, resistance to vaccination by Trump supporters has resulted

from both bottom-up and top-down processes. Trump and his collaborators chose to politicize the

pandemic, putting political advantage ahead of public health (Gadarian et al. 2022). The Trump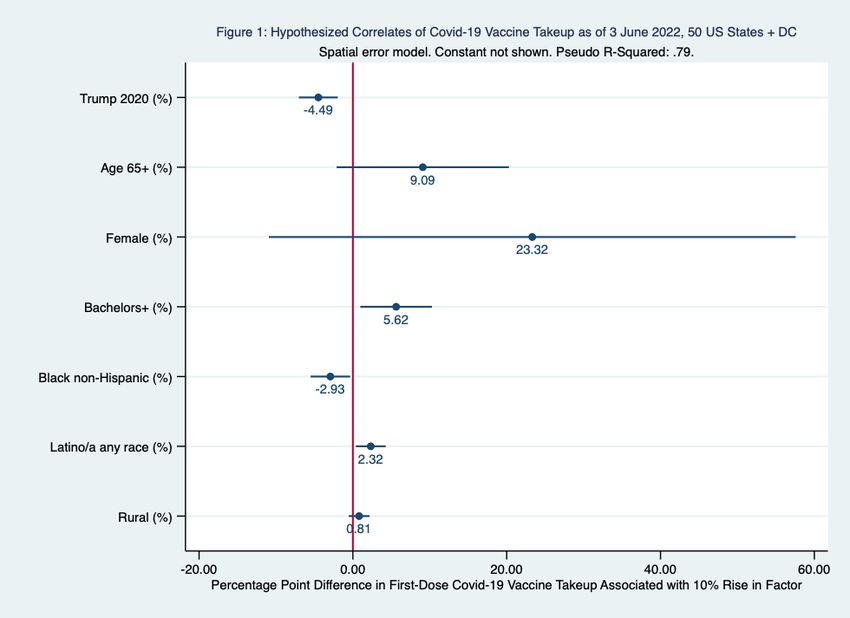
5

effect has a bottom-up dimension -- many Trump supporters proudly reject masks and Covid-19

vaccinations -- but pro-Trump politicians and media celebrities pander to and inflame such

rejection. Trump personally is not the only source of the processes behind the Trump effect: the

rightward drift of the Republican Party began in the 1990s (Hemmer 2022), and affective

polarization -- loathing for opposing partisans -- took hold even earlier (Iyengar et al. 2012).

However, fealty to Trump is a common denominator of most putatively principled resistance to

face masks and to Covid-19 vaccination in the United States.

        Experimental studies have found that the public pronouncements of US politicians can

affect attitudes toward Covid-19 vaccines (Hornsey et al. 2020, Kreps and Kriner 2021, Pink et

al. 2021). The analyses reported here corroborate these results and support the view that voter

preferences are becoming conditioned increasingly by national-level issues and diminishingly by

subnational heterogeneities (Hopkins 2018). To the extent that the latter are represented by

territorial sociodemographic characteristics such as age, gender, race, ethnicity, education, and

rurality, it is noteworthy, and consistent with the nationalization thesis, that across US states, US

counties, and Connecticut towns alike, controlling for sociodemographic factors did not perturb

the strong and robust association between the Trump 2020 vote share and the vaccination

initiation rate. Suggesting a rise in influence of national over state and local issues, at the state,

county, and town levels alike, the Trump 2020 vote share was correlated more closely than the

Trump 2016 or Romney 2012 vote shares with the June 2022 vaccination initiation rate.

2. Materials and Methods

        The Covid-19 vaccination initiation rate is the cumulative share of a population recorded

as having received at least one dose of a Covid-19 vaccine as of June 3, 2022 (June 1, 2022, for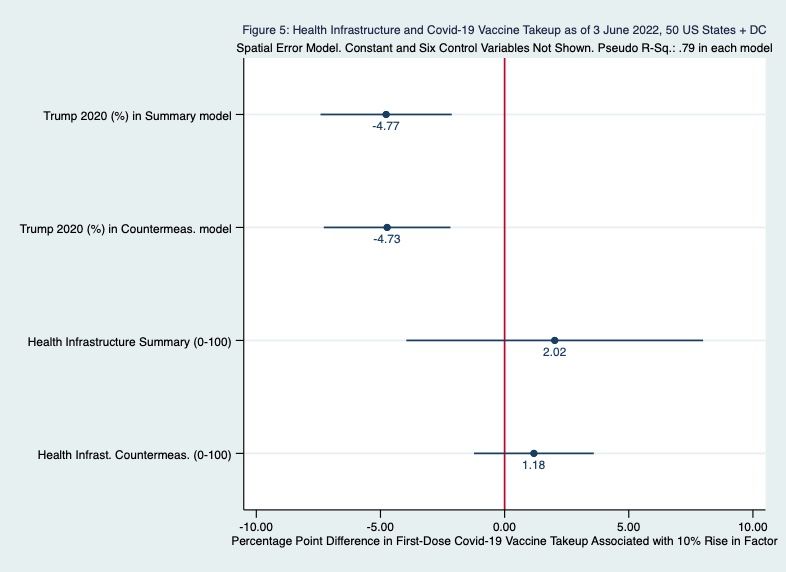
6

Connecticut towns). To identify the statistical impact of the Trump effect on this rate, its

influence must be isolated from the impact of confounders. In this study, such isolation is

approximated by adjusting for age, gender, race, ethnicity, education, and rural residence. These

six sociodemographic factors are used as control variables when testing the Trump effect

hypothesis, represented by the Trump 2020 vote share, against alternative hypotheses.

       A drawback of territorial comparisons is that individual behavior is tricky to infer from

territorial associations. This ecological inference problem diminishes, however, with the

quantity, smallness, and homogeneity of the units being compared (King 1997: 50; Morgenstern

1982: 1342; Robinson 1950: 356). Territorial studies provide a useful complement to surveys

and experiments. As Gadarian et al. (2022: 75) point out, ‘COVID-19 is a community disease

requiring community-level responses.’ Covid-19 vaccination campaigns are usually deployed

geographically, so territorial analysis is critical to fighting the pandemic. Spatial effects can be

taken into account only across territories, and some factors likely to influence the Covid-19

vaccination rate, like the political party in control of health care policy and the quality of health

care infrastructure, are typically measured at the territorial level. Accordingly, it useful to

observe how such factors have affected the Covid-19 vaccination rate across the territories that

the health care policies and health care infrastructure were designed to serve.

       The first analysis reported here investigates the association between the Trump 2020 vote

share and the vaccination initiation rate across the 50 US states plus Washington, DC. US states

are few in number, demographically heterogeneous, and have a median population of about

6,500,000. The second analysis observes the association across 3,032 US counties and county-

equivalents, which are numerous and usually more demographically homogeneous than states.

However, counties range in population from 86 (Kalawao, HI) to 10,039,107 (Los Angeles, CA),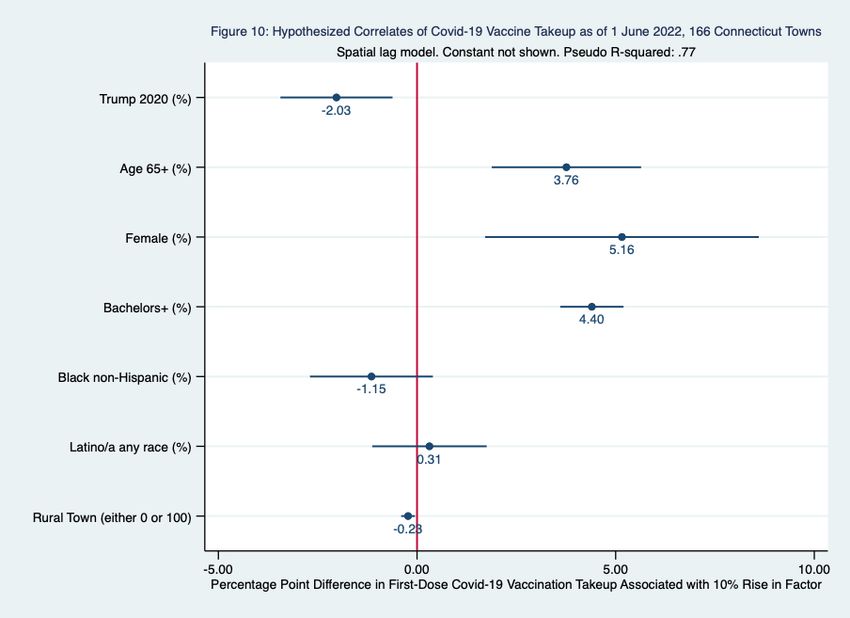
7

with a standard deviation thirteen times the median population of about 25,000, and some are

demographically quite diverse. The third analysis explores the association across the 169

Connecticut towns, which have a median population of about 15,000 and range from 839

(Union) to 144,399 (Bridgeport), with a standard deviation only twice the median (Census

Bureau 2021a, 2021c). Accordingly, ecological inference is most problematic for US states and

least problematic for Connecticut towns, with US counties occupying a middle position.

       To estimate the magnitude and significance of the association between the Trump effect

and Covid-19 vaccine takeup, the percentage of a state's, county's, or town's population that had

initiated vaccination as of June 3, 2022 (June 1 for Connecticut towns) was regressed on Trump's

2020 vote share, the six sociodemographic variables, another takeup- or provisioning-related

factor where data were available, and a spatial error or spatial lag term. Incorporating spatial

effects is crucial because ‘it is precisely in the subnational context where we might expect

territorial boundaries to be permeable and geographic units to be dependent – and therefore

spatial analysis to be especially relevant’ (Harbers and Ingram 2019: 68).

       Spatial autocorrelation operates like time series autocorrelation, but is generated by

observations' geographic rather than temporal proximity. To analyze spatial effects, weighting

matrices are designed to reflect how far spatial influence is thought to extend, and how steeply it

is thought to decay as territories are located farther apart. It is assumed that spatial influence

across states, counties, and towns is better represented by distance than by adjacency

(contiguity), so spatial autocorrelation is modeled using inverse distance matrices, which assume

that spatial effects are inversely proportional to the proximity of geographical centroids. When

spatial autocorrelation affects the dependent variable, a spatial lag model is appropriate. When

spatial autocorrelation affects the error term, a spatial error model is appropriate. Lagrange
8
multiplier and robust Lagrange multiplier tests were used to decide whether an ordinary least
squares, a spatial lag, or a spatial error model was appropriate, following Anselin and Rey's
(2014: 110) decision tree. Stata SE v17 was used for the state and town analyses; Stata MP v17
for the county analyses, and GeoDa 1.20.0.8 for most county robustness checks.
The spatdiag command (Pisati 2001) implemented in Stata/SE 17.0 for Mac and the
spatial regression commands in GeoDa 1.20.0.8 (Anselin 2022) were used to diagnose the
presence or absence of spatial autocorrelation, and to decide whether the spatial effects in the
data were best modeled by a spatial lag or spatial error approach. Spatial correlation was detected
at all three levels. A spatial error model was found to be appropriate for the states and counties
analysis; a spatial lag model was appropriate for the towns analysis. Except in some of the
county-level robustness checks, where GeoDa's diagnostics, weighting matrices, and maximum
likelihood estimates were used, the models were estimated using Stata's spregress command,
opting either for either a spatial lag or spatial error term, as Lagrange multiplier and robust
Lagrange multiplier tests recommended. The coefficients reported are based on total effects
(both direct and indirect), which are reported in the Stata diagnoses but not in the GeoDa
diagnoses, which report only direct effects. In the Stata analyses, the spatial generalized least
squares procedure (g2sls option) was chosen because it is more robust than a maximum
likelihood (ml) procedure (used in the GeoDa analyses) when the error term, representing
omitted variables, is other than normally distributed (StataCorp LLC 2021: 48).
3. Outcome
The outcome predicted is the Covid-19 vaccination initiation rate. The ‘at least one dose’
share is preferred to the fully vaccinated share because the Trump effect is conjectured to act9
mainly on the decision to initiate vaccination. A March 2021 CDC study found that only 3
percent of people who had gotten one shot of the two-dose Pfizer and Moderna vaccines did not
eventually receive a second shot, although 12 percent did not receive a second shot within the
prescribed time frame (3 and 4 weeks respectively) (Kriss et al. 2021: 393). Reasons for skipping
or delaying the second shot ranged from fear of side effects, to a belief that one shot would be
sufficiently protective, to providers running out of the right type of vaccine (Robbins 2021). The
Trump effect is not thought to have been directly involved in any of these deterrents.
To operationalize a Covid-19 vaccination initiation rate it is necessary to decide which
age groups belong in the denominator. US states staggered Covid-19 vaccine eligibility by age
on different timelines (Hubbard 2021), so the total population is the optimal denominator of the
vaccination initiation rate, eliminating a source of potential measurement error (age group
assignment) and homogenizing the denominator of the vaccination initiation rate with that of the
most widely-utilized Covid-19 infection and death rates. Sensitivity analyses reported in the
supplemental material for this article found that controlling for the under-12 share of the
population had no effect on the magnitude or significance of the coefficient of the Trump 2020
vote share. The over-65 share of a town's population is included as part of the baseline model.
4. Hypotheses
If the Trump effect matters for vaccine takeup, the Trump 2020 vote share should remain
robustly associated with a lower Covid-19 vaccination initiation rate even after controlling for
potentially confounding factors that might affect either the provisioning or takeup of a Covid-19
vaccine. On the provisioning side, states with high proportions of Trump voters might have
worse (or better) public health infrastructure, or have Republican governors or Republican-10
controlled legislatures, which have tended to be more reluctant than Democratic ones to facilitate
and encourage Covid-19 vaccination. On the takeup side, Trump voters could tend more than
Biden voters to belong to sociodemographic categories that tend to underutilize preventive health
services, or to be more averse to any kind of vaccine, or to reside in places with low case or
death rates, giving residents less incentive to get vaccinated. Also, if the Trump effect matters,
the statistical impact of a Republican presidential candidate's vote share on the Covid-19
vaccination initiation rate should be largest for Trump's 2020 vote share (after the pandemic
began), next-largest for Trump's 2016 vote share (before the pandemic began), and smallest for
Romney's 2012 vote share (before Trump entered electoral politics).
Multiple regression models with controls for spatial effects are used to compare the
plausibility of the Trump effect hypothesis to the plausibility of these alternative hypotheses.
Because of data constraints, the complete set of five provision- and takeup-related hypotheses is
tested only at the state level, but the sociodemographic and case and death rate hypotheses are
tested at the state, county, and town levels alike.
On the provisioning side, a first alternative to the Trump effect hypothesis is that Trump-
supporting states have lower vaccine takeup because they tend to have weaker public health
infrastructure, reducing the supply of vaccines. The strength of public health infrastructure in
each state is measured using two indicators from 2019 National Health Security Preparedness
Index: the overall index and ‘Countermeasure Management,’ a sub-index that includes the
storage and deployment of vaccines (NHSPI 2019). If health security preparedness were to
predict vaccine takeup as well as or better than Trump's share of the 2020 presidential vote, or if
the inclusion of health security preparedness in a regression model were to make Trump's vote11
share insignificant as a predictor of the vaccination initiation rate, then health care infrastructure
rather than the Trump effect might be the critical determinant of Covid-19 vaccine takeup.
The second alternative hypothesis on the provisioning side involves Republican control
of state vaccination policy. State governors and state legislatures have responsibility for most
public health policies, including policies related to vaccination. States with Republican
governors were slower than states with Democratic governors to implement movement
restrictions in response to the pandemic, and quicker to lift them (Adolph et al. 2021a,b). In
Florida and Texas Republican governors issued executive orders prohibiting local governments
and businesses that get state government funding from requiring their employees to show proof
of vaccination as a condition of employment. In May 2021 the Republican governor of Montana
signed a bill prohibiting the state's hospitals from requiring that their employees be vaccinated
against any diseases, not just Covid-19 (Montana 2021). As of mid-July 2021, Republican
legislators had introduced similar bills in some 40 other states (NASHP 2021).
To measure Republican control of state policy, dummy (0/1) variables indicate whether
Republicans as of February 1, 2022, controlled, respectively, the governorship and/or both state
legislative houses (NCSL 2022). If Republican control of governorships and state legislatures
were to make the Trump 2020 vote share insignificant as a predictor of the vaccination rate, then
Republican control of state government, rather than some aspect of the Trump effect (which is
thought to affect vaccine takeup more than vaccine provisioning), could be responsible for lower
vaccination rates in states with higher Trump 2020 vote shares.
On the takeup side, one alternative to the Trump effect hypothesis is the population
composition hypothesis. Age, education, gender, race, ethnicity, and rural residence influence12
Covid-19 vaccine takeup. These six sociodemographic factors have been featured in recent
surveys of Covid-19 vaccine takeup and hesitancy at the individual level (Beleche et al. 2021,
Hamel et al. 2021). The same six factors serve here both as control variables when assessing
other hypotheses, and as a ‘population composition’ alternative to the Trump effect hypothesis.
Age. In all states people aged 65 and older were among the first to be authorized to
receive Covid-19 vaccines. The longer one has been eligible for vaccination, the more likely one
is to be vaccinated. Being 65 or older is also a risk factor for Covid-19 hospitalization and death,
so the elderly have a special incentive to get vaccinated. Hence, the 65 and older share of a
state's, county's, or town's population is expected to be positively associated with its Covid-19
vaccination initiation rate. Individual-level data confirm that age is positively associated with the
vaccination initiation rate. A September 2021 survey found that 85 percent of US residents aged
65 and older had initiated Covid-19 vaccination, compared to 72 percent of 50-64 year-olds, 66
percent of 30-49 year-olds, and 68 percent of 18-29 year-olds (KFF 2021).
Education. College graduates tend to know more than non-graduates about virus
transmission and disease severity. More highly educated people are sometimes found to be more
susceptible to motivated reasoning (more skilled at mustering reasoned arguments for
interpreting information in a way consistent with their prior beliefs), but they are also more adept
at filtering out misinformation (Allcott and Gentzkow 2017). A September 2021 survey found
that 82 percent of respondents with a college degree had received at least one dose of a Covid-19
vaccine, compared to 67 percent of respondents without a college degree (KFF 2021). Higher
percentages of state, county, or town residents with a bachelor's degree are thus expected to be
associated with higher vaccination initiation rates.13
Gender. As of July 21, 2021, females outnumbered males by 51 to 46 percent among
those receiving at least one dose of a Covid-19 vaccine (calculated from CDC 2021 and Census
Bureau 2021b). In a September 2021 survey 74 percent of adult females, but only 69 percent of
adult males, reported having received at least one dose of a Covid-19 vaccine (KFF 2021). The
female share of the population is thus expected to be associated with a higher vaccination
initiation rate.
Race and Ethnicity. An analysis of data from 38 states reporting vaccination initiation
rates by race and ethnicity found that vaccination initiation rates in April 2022 were 65 percent
among Hispanics, 63 percent among Whites, and 57 percent among Blacks (Ndugga et al. 2022).
The territorial analyses are expected to reflect these racial and ethnic discrepancies.
Rural residence. Vaccination sites tend to be located in areas with dense populations.
Accordingly, the information and activity costs of vaccination against Covid-19 are higher in
sparsely-populated rural areas. As of May 22, 2021, 57 percent of residents of US metropolitan
counties, but only 44 percent of residents of micropolitan and noncore counties, had received at
least one dose of a Covid-19 vaccine (Diesel et al. 2021: 926). Hence, takeup of a Covid-19
vaccine is expected to be lower in states with a higher percentage of rural residents, in counties
scoring higher on an ordinal scale where 1 is most urban and 9 is most rural (USDA 2013), and
in towns designated ‘rural’ by the Connecticut Office of Rural Health (CORH 2021).
Alongside the sociodemographic composition of a territory's population, a second
alternative hypothesis on the takeup side involves general vaccine hesitancy. To explore whether
such hesitancy might outperform the Trump 2020 vote share in explaining state-to-state variation
in vaccination initiation, the share of a state's population that had by June 3, 2021 received at14
least one dose of a Covid-19 vaccine is regressed on the Trump 2020 vote share, the six
sociodemographic variables, and either the percentage of the state's population that had been
vaccinated against seasonal flu in 2019-20, or the percentage of the state's 13-17 year-olds who
had received at least one dose of the human papillomavirus (HPV) vaccine in 2019.
The third alternative hypothesis on the takeup side involves high cumulative and recent
levels of Covid-19 cases and deaths. The higher the number of cases and deaths, the more
frequently the unvaccinated will have a personal connection to someone suffering from Covid-
19, and the more media outlets will report on the prevalence and dangers of the disease. That
should give more unvaccinated people an incentive to get a Covid-19 vaccine.
5. Results from US States
State-level analyses face a ‘small-N’ problem (only 51 cases) as well as an ecological
inference problem, but state-level associations dominate news about ‘Red/Blue’ differences in
Covid-19 vaccination rates. Exploring hypotheses using multiple regression, even of a small
number of cases, beats observing the raw data, noting that Trump won almost all of the states
with low vaccination rates, and speculating about why this remarkable association might exist.
Across the 50 United States and Washington, DC, on June 3, 2022, a 10 percentage-point
higher Trump 2020 vote share was associated with a 4.49 percentage-point lower rate of Covid-
19 vaccination initiation, controlling for the six sociodemographic variables and for spatial
autocorrelation of the error term (Figure 1). Together, these factors explained 79 percent of the
cross-state variance in the vaccination initiation rate. The only socioeconomic variable that
outperformed the Trump vote as a predictor of the vaccination initiation rate was the percentage
of the population with a bachelor's degree, which as predicted was associated with a higher rate15
of Covid-19 vaccine takeup. The Black share of the population was associated with a slightly
lower vaccination initiation rate, and the Latino share, 65 and older share, and female share with
a higher rate. The latter two associations were statistically insignificant, however, and the rural
share of the state population had no significant association with the vaccination initiation rate.
[Figure 1]
The state-level association between the Republican share of the presidential vote and a
lower rate of vaccine initiation was strongest with the 2020 Trump vote share, next strongest
with the Trump 2016 vote share, and weakest with the Romney 2012 vote share (Figure 2). The
Trump 2020 vote share coefficient exceeded the Romney 2012 vote share coefficient by 44
percent, supporting the conjecture that the Trump effect grew stronger from 2012 to 2016 to
2020 and suggesting that health-related behaviors are becoming more and more nationalized.
[Figure 2]
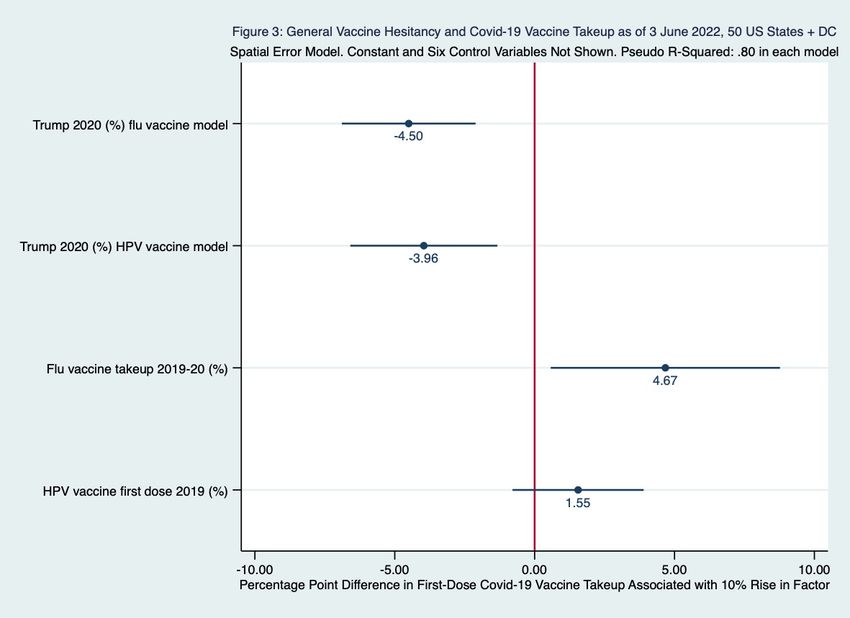
The takeup-related (demand-side) alternative hypotheses involve population composition
(discussed above), general vaccine hesitancy, and the cumulative and recent prevalence of
Covid-19 cases and deaths. Flu vaccine takeup was associated positively and significantly with
Covid-19 vaccine takeup after adjusting for the state's sociodemographic composition and for
spatial autocorrelation of the error term, but neither flu nor HPV vaccine takeup did much to
affect the association between the Trump 2020 vote and Covid-19 vaccine takeup (Figure 3).
[Figure 3]
To find out whether levels of Covid-19 infection or mortality could account for the strong
negative state-level association between the Trump 2020 vote share and the Covid-1916
vaccination initiation rate, controls for cumulative and recent (September 23, 2021 to June 3,
2022) Covid-19 case and death rates were added singly to the baseline model. Of the four case
and death rate variables, only recent Covid-19 deaths were associated significantly across states
with the vaccination initiation rate. The association was negative and strong: a 10 percentage-
point higher recent Covid-19 death rate yielded an 8.5 percentage-point lower Covid-19
vaccination initiation rate (Figure 4). A simple explanation for this finding is reverse causation:
states with low Covid-19 vaccination initiation rates in June 2022 had displayed similarly low
rates over the previous nine months, contributing to more Covid-19 deaths. In any case, adding
the recent Covid-19 death rate to the model weakened but did not eliminate the statistically
significant association between the Trump 2020 vote and Covid-19 vaccine takeup. No matter
which of the four case or death rates was added to the baseline model, the Trump 2020 vote
share remained associated with a 3.28-4.73 percentage-point lower vaccination initiation rate
(Figure 4).
[Figure 4]
The provisioning (supply-side) hypotheses that are juxtaposed here to the Trump effect
hypothesis involve health care infrastructure and Republican control of state governorships and
legislatures. As of early June 2022, no significant state-level association existed between health
care infrastructure and Covid-19 vaccine takeup, controlling for the Trump 2020 vote share, six
sociodemographic variables, and spatial autocorrelation of the error term (Figure 5). Nor did
adjusting for infrastructure quality do much to affect the association between the Trump 2020
vote share and the June 2022 vaccination initiation rate. After controlling for state health care
infrastructure quality, a 10 percentage-point higher Trump 2020 vote share was still associated
with an estimated 4.73-4.77 percentage-point lower vaccination initiation rate.17
[Figure 5]
Unadjusted for potential confounders, the Covid-19 vaccination initiation rate on June 3,
2022, averaged 88 percent of the population in the 17 states where, as of February 1, 2022,
Democrats controlled both state legislative houses (DC included), but only 70 percent in the 32
states where Republicans controlled both houses (Nebraska included). The average was 82
percent in the 23 states plus DC with a Democratic governor (mayor in DC), but only 73 percent
in the 32 states with a Republican governor (calculated from CDC 2022b and NCSL 2022).
Controlling for the Trump 2020 vote share and for the six sociodemographic variables,
Republican control of both houses of the state legislature was associated with a 3.64 percent
smaller share of the population initiating vaccination; having a Republican governor was
associated with a 2.38 percentage-point smaller share. Even after adjusting for Republican
control of state legislatures and governorships, however, the Trump 2020 vote share was still
associated significantly with a 3.32 to 3.65 percentage-point lower Covid-19 vaccination
initiation rate (Figure 6). The resilience of the Trump vote coefficient indicates the importance of
takeup regardless of provisioning, testifying to the nationalization of voter preferences.
[Figure 6]
To summarize, the state-level analyses found that the Trump 2020 vote share remained a
statistically and substantively significant predictor of a lower Covid-19 vaccination initiation rate
even after adjusting for a state's sociodemographic composition, general vaccine hesitancy,
Covid-19 cases and deaths, quality of health care infrastructure, and Republican control of the
state legislature and governorship, as well as for spatial autocorrelation of the error term. Among
the six sociodemographic factors, only the bachelor's degree share exerted a stronger statistical18
influence on the Covid-19 vaccination initiation rate than the Trump 2020 vote share. Also, the
Trump 2020 vote share had a stronger association with the state Covid-19 vaccination initiation
rate than either the Trump 2016 or Romney 2012 vote shares.
6. Results from US Counties
The United States has 3,142 counties and county equivalents, but conventional spatial
analysis requires matrices with no missing elements, and only 3,032 counties had complete data
on the vote shares of Romney 2012, Trump 2016, and Trump 2020, as well as on the June 3,
2022 vaccination initiation rate. Across these 3,032 counties, controlling for the six
sociodemographic variables and for spatial autocorrelation of the error term, a 10 percentage-
point higher Trump 2020 vote share was associated with a 5.84 percentage-point lower Covid-19
vaccination initiation rate (Figure 7).
[Figure 7]
Across counties the age 65 and older, bachelor's degree, and Latino population shares
predicted a higher Covid-19 vaccination initiation rate, whereas the Black non-Hispanic and
(unexpectedly) female shares, along with the county's degree of rurality, predicted a lower rate.
So did the Trump 2020 vote share, whose statistical influence on the Covid-19 vaccination
initiation rate was stronger than any of the sociodemographic variables.
Similar findings have emerged from six other county-level studies of the association
between the Trump 2020 vote share and the Covid-19 vaccination rate, although each of the six
used the "fully vaccinated" rate rather than, as in the present study, the first-dose rate. Both the
Trump 2020 vote share and the Covid-19 vaccination rate are measured in percentages, so as in19
the present analysis, the coefficient on the Trump variable multiplied by ten yields the estimated
percentage-point reduction in vaccine takeup generated by a ten percentage-point higher Trump
2020 vote share. In the present analysis a 10 percentage-point higher Trump county vote share
yielded a 5.84 percentage-point lower first-dose vaccination rate, near the upper end of the range
of the six studies' estimates for the fully-vaccinated rate, which ranged in percentage points from
-3.3 (Albrecht 2022: 8) to -4.3 (Jung and Lee 2021: 10) to -4.6 (Pepinsky 2021) to -5.1 (Chopra
and Wydick 2022: 29) to -6.3 (Sun and Monnat 2021: 3) to -6.8 (Morgan and Sul 2021: 5). The
homogeneity of findings across the six studies, and their similarity to the findings of the present
study, are consistent with Hopkins's (2018: 230) conclusion that political behavior in the United
States is becoming increasingly nationalized, such that ‘similar people are likely to respond to
similar information in similar ways, irrespective of their place of residence.’
In the state-level analysis reported in Figure 2, a 10 percentage-point higher Trump 2020
vote was associated with a 4.49 percentage-point lower vaccination initiation rate. The state-level
figures for the Trump 2016 and Romney 2012 vote shares were 3.79 and 3.11 percentage points
respectively. In the county-level analysis reported in Figure 8, a 10 percentage-point higher
Trump 2020 vote was associated with a 5.84 percentage-point lower vaccination initiation rate;
the figures for the Trump 2016 and Romney 2012 voter shares were 5.32 and 4.32 percentage
points respectively. In the county-level analysis the Trump 2020 vote share coefficient exceeded
the Romney 2012 coefficient by 35 percentage points -- less than in the state-level analysis (44
percentage points), but consistent with the Trump effect growing stronger from 2012 to 2016 to
2020. Studies by Jung and Lee (2021) and Morgan and Sul (2021) have found similarly.
[Figure 8]20
To find out whether Covid-19 infection or mortality could account for the strong negative
county-level association between the Trump 2020 vote share and the June 3, 2022 vaccination
initiation rate, controls for cumulative and recent (previous 9 months) Covid-19 case and death
rates were added singly to the baseline model. As in the US states analysis, Covid-19 case rates
were associated with higher levels of vaccination initiation, and Covid-19 death rates were
associated with lower levels. High case rates on balance seem to encourage people to get
vaccinated, whereas high death rates on balance seem simply transmit the effects of vulnerable
people having been previously unvaccinated. In any case, across US counties, no matter which
case or death rate was added to the baseline model, the Trump 2020 vote share was always
associated with a 5.64 to 5.84 percentage-point lower vaccination initiation rate (Figure 9).
[Figure 9]
Summarizing, the US county-level analysis found that the Trump 2020 vote share had a
stronger association with the June 3, 2022 vaccination initiation rate than any of the six
sociodemographic variables, and a stronger association with that rate than either the Trump 2016
or Romney 2012 vote shares. The quality of health care infrastructure, the political party heading
the local government, and takeup of other vaccines could not be measured across counties, but
neither cumulative nor recent Covid-19 case nor death rates had a significant impact on the
cross-county association between the Trump 2020 vote share and the vaccination initiation rate.
7. Results from Connecticut Towns
Connecticut is a small and densely populated state. Its 3.6 million residents live in 169
towns in a territory spanning 180 kilometers east to west and 110 kilometers north to south.
Some towns are governed by Democrats and others by Republicans, but vaccination policy is set21
almost entirely at the state level, leaving town officials little flexibility in policy design or
implementation. Some US county governments, such as those of Leon County, Florida and
Douglas County, Colorado, have defied state policies on vaccination mandates, but Connecticut
town governments have not (Brown 2021). Connecticut towns differ widely on health care
infrastructure, but no legal obstacles and few practical barriers prevent a resident of one town
from getting vaccinated in another town. In Connecticut in May 2021 about 25 percent of urban
dwellers and more than 50 percent of rural dwellers got their first dose of a Covid-19 vaccine in
another county, giving Connecticut one of the highest shares of residents crossing county
boundaries to get vaccinated (Murthy et al. 2021). Connecticut has 169 towns but only eight
counties. With Rhode Island, it is one of two states with no county government at all.
Covid-19 vaccination initiation rates in Connecticut towns were not expected to be
influenced by differences in town health infrastructure, such as having a hospital. Nor were they
expected to be influenced by differences in town vaccination policies, such as offering gift cards
or amusement park tickets to get vaccinated (anyone who got vaccinated at a site offering such
incentives received the benefit, regardless of town of residence). Relative homogeneity on the
provisioning side yields a largely unobstructed view of takeup-related factors influencing Covid-
19 vaccination, making Connecticut towns a largely provisioning-purged ‘universe’ within
which to examine whether the Trump 2020 vote share remained associated strongly and robustly
with the vaccination initiation rate, even after taking into account health care infrastructure
(effectively the same in all Connecticut towns), public health policy (effectively the same in all
towns), and population composition (represented by the six sociodemographic variables).
On the other side of the identification ledger Connecticut ranks fourth among the 50
states in population density, making it especially prone to spillovers from town to town. No legal22
barrier keeps a resident of one town from getting vaccinated in another town, and most towns
blend imperceptibly into others. States and counties are interdependent in many of these ways as
well, but not as much as Connecticut's densely-packed towns. Town-to-town spillovers can
potentially influence both the dependent variable (the vaccination rate) and the error term (which
picks up unmeasured but possibly causal attributes like attitudes and values). Spatial
autocorrelation was expected not only in the dependent variable, because people often get
vaccinated away from their town of residence and not infrequently get their residence
misreported (see the supplemental material for this article), but also in the error term, because
people are influenced by unmeasured attributes of the town in which they work, the towns in
which they grew up, the towns in which their relatives live, and so on. Lagrange Multiplier and
Robust Lagrange Multiplier tests showed nonetheless that a spatial lag model was most
appropriate for the Connecticut towns data, so that was the model used. In a robustness check
reported in the supplemental material for this article, adjusting for spatial autocorrelation in the
error term as well as in the dependent variable had little effect on the magnitude or significance
of the negative coefficient on the Trump 2020 vote share.
Predictions for the six sociodemographic variables in the Connecticut towns analysis
were the same as such predictions in the US states and US counties analyses. To measure
rurality, however, each town was identified with an indicator variable. Towns that the
Connecticut Office of Rural Health (CORH 2021) designated ‘rural’ got a ‘1’ (rescaled to 100 to
facilitate comparison to the variables expressed in percentage points); other towns got a ‘0’.
Statistical artifacts exaggerated vaccination initiation rates in Canaan and Derby and understated
them in Mansfield (see the supplemental material for this article), so those three towns were
dropped from the analysis.23
Figure 10 summarizes the statistical associations across 166 Connecticut towns between
the Covid-19 vaccination initiation rate, the Trump 2020 vote share, the six sociodemographic
variables, and a spatial lag term. A higher share of females, of bachelor's degree recipients, and
of over-65 year-olds were each associated with a higher town Covid-19 vaccination initiation
rate, but the Black and Latino shares and the rural designation had no statistically significant
association with the outcome. The female, bachelor's degree, and over-65 shares raised the
Covid-19 vaccination initiation rate more than the Trump 2020 vote share reduced it, but even
taking these sociodemographic factors into account, a town with a 10 percent higher Trump 2020
vote share still had an estimated 2.03 percentage-point lower vaccination initiation rate.
[Figure 10]
If a Trump effect operated in Connecticut towns as well as in US counties and states, a
lower town vaccination initiation rate would be associated, in descending order of predictive
power, with the vote shares of Trump in 2020, Trump in 2016, and Romney in 2012. The Trump
2020 vote share would also be expected to outperform a town's Republican voter registration
percentage. That is what the Connecticut towns data show (Figure 11). Only 31 states register
voters by party, so no analogous comparison is possible among a full set of US states or counties.
[Figure 11]
As in the US states and US counties analyses, higher Covid-19 case rates, but not death
rates, were associated across Connecticut towns with higher vaccination initiation rates,
adjusting for the six sociodemographic variables, the Trump 2020 vote share, and spatial effects.
This finding is consistent with the conjecture that high case rates on balance encourage
vaccination, whereas high death rates on balance mostly reflect previously low vaccination rates.24
Controlling for cumulative and recent case and death rates raised the magnitude of the estimated
statistical impact of the Trump 2020 vote share on the Covid-19 vaccination initiation rate, from
-2.03 percentage points in the baseline analysis (Figure 10) to -2.92 to -3.31 percentage points in
the models with the cumulative and new case and death counts (Figure 12).
[Figure 12]
The analysis of Connecticut towns found that the Trump 2020 vote share statistically
lowered the June 3, 2022 vaccination initiation rate more than the Trump 2016 vote share, the
Romney 2012 vote share, the 2016 Republican voter registration share, or the 2020 Republican
voter registration share (Figure 11). Controlling for cumulative and recent Covid-19 case and
death rates only strengthened the association between the Trump 2020 vote share and the
vaccination initiation rate (Figure 12), by about 30 percent relative to the baseline analysis
(Figure 10). Across Connecticut towns age, gender, and education outperformed the Trump vote,
but race and ethnicity did not. More importantly from the standpoint of the present inquiry, the
Trump 2020 vote share remained robustly significant in the presence of six sociodemographic
control variables, cumulative and recent case and death counts, and a spatial lag effect.
8. Conclusion
This study has found that the Trump 2020 vote share retained a statistically significant
and substantively important association with the Covid-19 vaccination initiation rate across US
states, US counties, and Connecticut towns alike. After adjusting for age, gender, education,
race, ethnicity, and rurality, as well as for spatial effects, a 10 percentage-point higher Trump
2020 vote share was associated with a 4.5 percentage-point lower Covid-19 vaccination initiation
rate across 50 US states plus DC, a 5.8 percentage-point lower vaccination rate across 3,032 US25
counties, and a 2.0 percentage-point lower vaccination rate across 166 Connecticut towns. Each
finding withstood sensitivity checks involving universe of cases, statistical technique, dependent
variable, and independent variables (see the supplemental material for this article). One such
check involved replacing the share of the population with a bachelor's degree with the share of
the population in poverty. Had the poverty share replaced the bachelor's degree share, the Trump
2020 vote would have depressed the vaccination initiation rate by 5.7 percentage points across
US states, 6.9 percentage points across US counties, and 7.3 percentage points across
Connecticut towns.
Most previous work on the statistical association between the Trump 2020 vote share and
the Covid-19 vaccination rate has been carried out at the US county level using ordinary least
squares (OLS) multiple regression. When the units of analysis are spatially correlated, however,
OLS is inefficient at generating point estimates and is biased and inconsistent in estimating
standard errors. Spatial autocorrelation was detected at each of the three subnational levels (US
states, US counties, and Connecticut towns). The present analysis is among the first to include
spatial terms that control for the specific types of spatial autocorrelation detected.
Also confirmed across US states, US counties, and Connecticut towns alike is that the
Covid-19 vaccination initiation rate was depressed most by the Trump 2020 vote share, next-
most by the Trump 2016 vote share, and least by the 2012 Romney vote share. Across
Connecticut towns, the vaccination initiation rate was also more closely associated with the
Trump 2020 vote share than with the Republican share of voter registrations in either 2016 or
2020.26
Gadarian et al. (2022: 255) used six national surveys from March 2020 to April 2021,
each with from 1,871 to 3,000 respondents, to find out ‘whether levels of vaccine hesitancy varied
by party, race, income, or education.’ Their conclusion was that ‘partisanship matters more than any
other variable we have measured.’ The evidence reported in this study suggests that the same is
true across the subnational units for which most public health interventions are programmed. In
terms of the statistical effect on the vaccination initiation rate, the bachelor's degree share
outperformed the Trump 2020 vote share across the US states plus DC, as well as across
Connecticut towns, but the Trump 2020 vote share outperformed the bachelor's degree share
across US counties, and also outperformed race, ethnicity, and rurality across US states and
Connecticut towns. The study's findings are consistent with the claim that national rather than
local issues are increasingly shaping US political behavior (Hopkins 2018).
From a policy standpoint, it is important to know whether the main challenge to higher
Covid-19 vaccination rates lies more with provisioning (pro-Trump politicians restricting
vaccine availability) or with takeup (pro-Trump voters refusing available vaccines). Provision
and takeup influence each other, but understanding how, and how much, can help to identify
critical points at which politicians and the public can intervene to reduce the spread of Covid-19.
Citizens rather than politicians appear to be mainly responsible for lower Covid-19 vaccination
rates. It might be viewed as ‘simplistic’ to argue that ‘people who voted for former President
Donald Trump just won’t get the vaccine. But...the vote is just a proxy. The underlying policies
in these states are also to blame’ (Ranney 2021). This study has found that even when public
health policies and health care provision infrastructure were held roughly constant, as was
effectively the case across Connecticut towns, and even after adjusting for sociodemographic27
composition and Covid-19 case and death rates, as was done at all three territorial levels, the
Trump 2020 vote share remained stubbornly associated with a lower Covid-19 vaccination rate.
Lerner et al. (2017) found that across 852 US counties and county-equivalents, a 10
percent lower share of the presidential vote going to Obama in 2012 was associated with a 2
percent lower takeup of Affordable Care Act (ACA) health insurance subsidies, adjusting for
other factors pertinent to ACA takeup. A decade later, across 3,032 US counties, a 10 percent
higher share of the presidential vote going to Trump in 2020 was associated with a nearly 6
percent lower July 2022 Covid-19 vaccination rate, controlling for diverse sociodemographic
factors (Figure 10). These estimates show that the displacement of subnational by national issues
as determinants of voter preference persists. Even after controlling for sociodemographic,
infrastructural, and other factors specific to states, counties, and towns, health-related behavior is
being influenced significantly, and increasingly, by national-level issues and concerns -- in the
case of Covid-19 vaccination initiation, by the receptivity of Republican voters to disinformation
and misinformation about Covid-19 vaccines emitted by Republican politicians with national
followings and by right-wing media outlets with national reach.
Improving vaccine delivery and health infrastructure has a role to play in raising
vaccination rates, but in places where Trump had strong electoral support in 2020, the demand
side of the effort will remain crucial. Strategically, culturally-appropriate strategies have raised
vaccination rates in certain hard-hit localities (Foxworth et al. 2021). Tactically, Lerner et al.
(2017) suggested that framing Affordable Care Act health insurance subsidies as private sector-
friendly might attract Republicans, but it is hard to see how Covid-19 vaccines could be similarly
framed. Another tactical approach could be for public officials and media outlets to do more to
'prebunk' false or misleading claims by exposing people, immunization-style, to weakened28 versions of misinformation and disinformation, allowing them to build up resistance in their own ways (McGuire 1961, Roozenbeek et al. 2022). Although not a magic bullet, prebunking could be a useful component of a broader strategy to raise demand for life-saving Covid-19 vaccines.
29

                                          References

Adolph, Christopher, et al. (2021a). ‘Pandemic Politics: Timing State-Level Social Distancing
Responses to COVID-19.’ Journal of Health Politics, Policy and Law 46, 211–233.

Adolph, Christopher, et al. (2021b). ‘The Pandemic Policy U-Turn: Partisanship, Public Health,
and Race in Decisions to Ease COVID-19 Social Distancing Policies in the United States.’
Perspectives on Politics online before print, 1-23.

Albrecht, Don (2022). ‘Vaccination, Politics, and COVID-19 Impacts.’ BMC Public Health 22,
1-12.

Allcott, Hunt, and Matthew Gentzkow (2017). ‘Social Media and Fake News in the 2016
Election.’ Journal of Economic Perspectives 31, 211–236.

Anselin, Luc (2022). GeoDa Workbook. https://geodacenter.github.io/documentation.html

Anselin, Luc, and Sergio J. Rey (2014). Modern Spatial Econometrics in Practice: A Guide to
GeoDa, GeoDaSpace and PySAL. Chicago: GeoDa Press.

Beleche, Trinidad, et al. (2021). ‘COVID-19 Vaccine Hesitancy: Demographic Factors,
Geographic Patterns, and Changes Over Time.’ US Department of Health and Human Services,
Issue Brief May 2021.

Berman, Annie, and Morgan Krakow (2021). ‘Alaska Health Workers Face Anger and Threats
from COVID Patients and Public, Chief Medical Officer Says.’ Anchorage Daily News,
September 23. https://www.adn.com/alaska-news/2021/09/23/alaska-reports-7-new-covid-
deaths-and-a-daily-record-1300-infections/

Brown, Andrew (2021). ‘Mask Mandates in Town Buildings? Yes. Vaccine Mandates?
Unlikely.’ CT Mirror August 4, 2021. https://ctmirror.org/2021/08/04/as-the-covid-delta-variant-
spreads-some-ct-town-leaders-revive-some-lockdown-era-practices/

CDC [U. S. Centers for Disease Control and Prevention] (2021). COVID Data Tracker.
‘Demographic Characteristics of People Receiving COVID-19 Vaccinations in the United
States.’ https://covid.cdc.gov/covid-data-tracker/#vaccination-demographic

CDC [U. S. Centers for Disease Control and Prevention] (2022a). ‘Trends in Number of
COVID-19 Cases and Deaths in the US Reported to CDC.’ https://covid.cdc.gov/covid-data-
tracker/#trends_totaldeaths_select_00

CDC [U. S. Centers for Disease Control and Prevention] (2022b). ‘COVID-19 Vaccinations in
the United States.’ https://covid.cdc.gov/covid-data-tracker/#vaccinations

Census Bureau [United States Bureau of the Census] (2021a). 2015-2019 American Community
Survey 5-Year Estimates.
You can also read