THE THREE NEEDS AND THREE RISKS FOR RETIREES CHAD PADOWITZ CFA - CIO TALARIA - FSITV

Page created by Charlie Erickson
 
CONTINUE READING
THE THREE NEEDS AND THREE RISKS FOR RETIREES CHAD PADOWITZ CFA - CIO TALARIA - FSITV
The three needs and three risks for retirees
       Chad Padowitz CFA – CIO Talaria
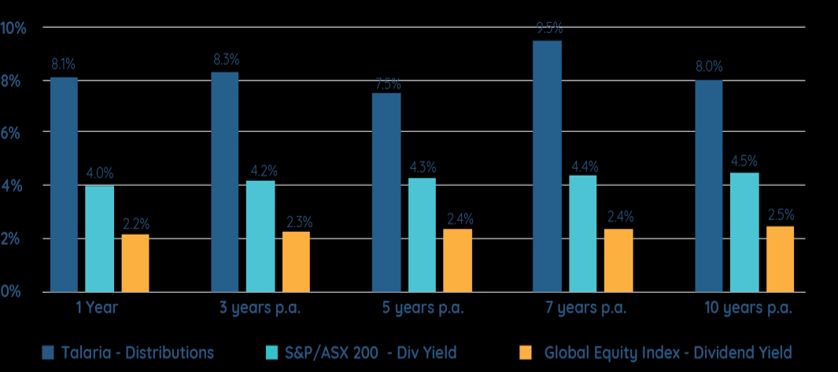
THE THREE NEEDS AND THREE RISKS FOR RETIREES CHAD PADOWITZ CFA - CIO TALARIA - FSITV
Contents

•   Retirement investing is different
•   How income is impacted by needs and risks
•   A unique solution to the income problem

                                                2
Important information
Wholesale Clients Only. The information contained in this presentation is made available onlyfor persons who are wholesale clients or sophisticatedinvestors within the meaning
oftheCorporationsAct2001(Cth).Itmaynotbedistributedorreplicated in any form, to anyone who is not a wholesale client or sophisticated investor in Australia.

No Reliance. This document is produced by Talaria Asset Management Pty Limited (Talaria) ACN 130 534 342, AFS Licence No 333732 and based on information available at
the time of the presentation. The information herein is factualand believed to be accurate as at the time of the presentation.

Illustrative information only. This presentation is not, and is not intended to be, an offer or invitation for subscription or sale, or a recommendation, with respect to any
financial product discussed herein, nor is it to form the basis of any contract or commitment. Such an offer would only be made by distribution of an offering memorandum
relating to any such financial products offering recipients of this presentation should therefore place no reliance on the content of this presentation when making any
decision to invest. Any examples or information provided in this document are for illustrative and discussion purposes only and do not represent a recommendation or
Talaria’s view on future events and in no way bind Talaria. The presentation and this document do not purport to be a complete statement or summary. The Talaria Global
Equity strategy is available through the Talaria Global Equity Fund (Fund) Wholesale Units ARSN 132 393 705. The Fund is issued by Australian Unity Funds Management
Limited ABN 60 071 497 115 AFS Licence No. 234454. In deciding whether to acquire, hold or dispose of the product you should obtain a copy of the Fund’s Product Disclosure
Statement (PDS) and consider whether the product is appropriate. A copy of the PDS is available at the website australianunity.com.au or by calling the Client Services team
on 13 29 39.

This presentation is confidential and should not be distributed by the recipient in whole or in part to any other person without obtaining the prior written consent of Talaria
Asset Management Pty Limited.

 © 2020 Talaria Asset Management Pty Limited

                                                                                                                                                                                  3
Markets and economies have shifted

   FAANMGs bigger than entire Japanese Stock Market

   Apple’s market cap greater than FTSE100

   US 10-year Treasury Rate 0.74% v long term average of 4.43%

   Company dividends down 20-40%

   Australian GDP – 7% for the June quarter

   AU Gov’t Stimulus $289bn+ …

                                                                 Sources: Bloomberg, Fairfax

                                                                                         4
Retirement investing is different
                                  To achieve the 3 big retirement needs...

                                            Retirement Needs

                          Income                 Growth                 Certainty

                                   The 3 key risks need to be avoided

              Income level risk               Inflation risk                   Volatility risk

                  Longevity               Above inflation growth                    Sequencing

                                                                                                 6
Adviser conundrum
•   Advisers face a structural mismatch
                                          Change In Importance of Investment Outcome Risk Over Time
•   Clients seek income but industry
    offers capital solutions

•   Accumulation products vs.

                                           Relative Importance
    Retirement products

      o As investors transition to
        retirement capital protection
        becomes more important

                                                                 Accumulation       Late Stage Accumulation       Retirement

                                                                                            Age
                                                                      Relative / Opportunity Cost             Absolute

                                                                                                                               7
Income adequacy
                                             ASFA Standard Comfortable Annual Spending Needs
•   Is the ASFA standard
    enough?                $80,000
                                       Retirement Needs

                           $60,000
•   What level of
    savings do you need    $40,000
    to achieve it?
                           $20,000

                                 $0
                                                     Single                          Couple
                           ($20,000)

                           ($40,000)
                                                 ASFA Standard     Pension    Shortfall
                                                                                          Sources: Google, ASFA, ATO

                                                                                                                 8
Dividends (income) have played the key role in total returns

                                 Retirement Needs

                                                               Source: Bloomberg

                                                                                   9
So retirees require

▪ Capturing the market’s gains, less of its
  declines

▪ Lower volatility – smoother journey

▪ Consistent income generation - a buffer
  against loss

                                              10
How income is impacted by needs and risks
Risks: Inflation, concentration and duration

                                 Retirement Needs

                                                    Source: Bloomberg, As at 25.9.20

                                                                                   12
Valuation (duration) risk
                                                                                                               Top 10 Index                       P/E
                  1 Year Performance - July 2020                                                               Performers*​                      Ratio​
                                                              Retirement Needs                                       Apple​                        35x​
                                                                                                               Amazon.com​                         71x​
        Top 10 Index   Other 1,529 Index   Total MSCI World                       TALARIA                         Microsoft​                       34x​
         Performers       Members           (ex Aus) Index     MSCI VALUE        (pre-fees)
 10%                                                                                                                 Tesla​                       192x​
           6.4%
                                                                                                                    NVIDIA​                        55x​
  5%                                            3.4%
                                                                                                                  Alphabet​                        29x​
  0%                                                                                                              Facebook​                        30x​
                                                                                  -2.1%
 -5%                        -2.9%                                                                            PayPal Holdings​                      56x​

 -10%                                                                                                               Shopify​                      547x​
                                                                                                                    Adobe​                         48x​
                                                                 -12.3%
 -15%
                                                                                                              Avg. P/E Ratio​                      49x​
                                                                                                      Based on 12 month return to 31 July 2020. Source: Bloomberg,
                                                                                              *Index as at September 2020, Avg. P/E Ratio based on harmonic mean​

                                                                                                                                                               13
Traditional portfolio construction (60/40) is broken

Traditional income
sources are no longer
offering the same
returns…

There are more cuts to
come.

The result: Ongoing
uncertainty ahead!

                                                                                                                                     Source: Bloomberg, Talaria
                                       Talaria Yield based on 12-month Distribution Return as at 31 March 2020 for Talaria Global Equity Fund – Wholesale Units

                                                                                                                                                                  15
Lower returns ahead, new tools needed

 The Dividend Swap Market shows an anticipated further decline in dividends is
 being priced for 2021 v 2019 levels

0%

-10%
                      USA                            Europe
                     –20%                             –20%                       Australia
                                                                                   -30%
-20%

-30%

-40%
                                                                                             Source: Bloomberg, As at 25.9.2020
How much do you need?

                        ▪ Massive problem for
                          retirees today.

                        ▪ US$1 million no longer
                          generates a US$50,000
                          income for
                          retirement.

                        ▪ Today, it is just
                          US$6,900 p.a
How much do you need?

                        ▪ Need closer
                          to US$
                          8million
A unique solution to the income problem
What are the other income sources?

Genuinely uncorrelated, persistent proven income

•   Banking / Shadow banking

•   Catastrophe insurance

•   Equity insurance
                                                   20
Getting paid for taking risk – An Insurance Mindset

                               A different approach to buying shares

                                                                                                                     Typical insurance premiums
    Turn ‘theoretical’ return into ‘real’
    return
                                                                                                                Life

    o
                                                                                                                Insurance
         Consumers pay to protect
         homes, lives, cars
                                                                                                                0.1% p.a .
    o    Insurers receive the premium for                                                                                                             0.3% p.a .

         accepting risk

    So, what about investors?
                                                                                                                2.5% p.a .                           Sha res???

                                            Insurance premium costs based on estimates provided by insurers. Share market insurance defined as annualized return on near the money American put options.
                                                                                                                                        Past performance is not a reliable indicator of future performance.
Getting paid for taking risk – An Insurance Mindset

                                    A different approach to buying shares

    Investors pay 15-20%+ p.a. to protect                                                                                 Typical insurance premiums

    shares.
                                                                                                                     Life

    o     Generates income                                                                                           Insurance

    o     Diversifies sources of return
                                                                                                                     0.1% p.a .                            0.3% p.a .
    o     Creates buffer against loss

        Selling Put Options = Selling Insurance on
                          Shares
                                                                                                                     2.5% p.a .                      15-20% p.a.

                                                 Insurance premium costs based on estimates provided by insurers. Share market insurance defined as annualized return on near the money American put options.
                                                                                                                                             Past performance is not a reliable indicator of future performance.
EQUITY INSURANCE EXAMPLE
                                                Trade on offer: Sell August 2020 Put
Available Trades:
                                                      Maturity date Oct 2020

      Date:                                                      August 2020
 Share Price ($):                                                       68.13

 Strike Price ($):                                                      62.50

                                                                                                              Source: Talaria, Bloomberg
                                                   For illustrative purposes only and not a recommendation to buy or sell a particular stock

                                                                                                                                               23
EQUITY INSURANCE EXAMPLE
                                                               Trade on offer: Sell August 2020 Put
        Available Trades:
                                                                     Maturity date Oct 2020

              Date:                                                             August 2020
         Share Price ($):                                                              68.13

         Strike Price ($):                                                             62.50

    Option Price (Premium $):                                                           2.17

Annualised Option Premium Return:                                                    22.17%

                                                                                                                             Source: Talaria, Bloomberg
                                                                  For illustrative purposes only and not a recommendation to buy or sell a particular stock

                                                                                                                                                              24
EQUITY INSURANCE EXAMPLE
                                                               Trade on offer: Sell August 2020 Put
         Available Trade:
                                                                     Maturity date Oct 2020

              Date:                                                             August 2020
         Share Price ($):                                                              68.13

         Strike Price ($):                                                             62.50

    Option Price (Premium $):                                                           2.17

Annualised Option Premium Return:                                                    22.17%

     Total Buffer To Loss ($):                                                          7.80

     Total Buffer To Loss (%):                                                        11.5%

         Dividend Yield:                                                              6.20%

      Price / Earnings Ratio:                                                            5.7

                                                                                                                             Source: Talaria, Bloomberg
                                                                  For illustrative purposes only and not a recommendation to buy or sell a particular stock

                                                                                                                                                              25
Consistent income from diversified sources
  We generate consistent income as part of the total fund return.
  This comes from a variety of sources creating more stable returns to investors.

 16.0%

 14.0%

 12.0%

 10.0%

  8.0%

  6.0%

  4.0%

  2.0%

  0.0%
          2009       2010      2011      2012       2013      2014       2015           2016             2017              2018             2019             2020
  -2.0%

                                            Option Premium   Interest   Dividends       Annualised

                                                                                                            Source: Talaria, 2020 reflects calendar year to September 2020
                                                                                    Option premium generated is on capital account and is therefore not always distributable.
                                                                                                                                                                         26
Consistent income from diversified sources
  Historically higher distributions than both domestic and foreign industries.

                             Talaria Global Equity Fund distribution calculations based on the distributions paid in each financial year, using financial year starting values to determine annual distribution yield to June 2020
                                                                                                                         S&P/ASX 200 and MSCI World (ex Aus) Index (MXWO) Dividend Yields = 12mth DY. Source: Bloomberg
                                                                                                                                                                                             Sources: Bloomberg, FactSet,Talaria
                                                                                             Numbers may not sum due to geometric compounding and rounding​. Past performance is not an indicator of future performance

                                                                                                                                                                                                                             27
Consistent income from diversified sources
  Enjoy a smoother ride to the end result, less volatility is always better

                                               Standard Deviation
                                  (Rolling 3 year, annualised quarterly returns)
    14%

    12%

    10%
                                                                                                                                               Structurally lower
     8%                                                                                                                                        volatility than
                                                                                                                                               broader market
     6%

     4%
                            Benchmark                 Talaria
     2%

     0%
       Jan-15   Jul-15   Jan-16   Jul-16   Jan-17   Jul-17   Jan-18   Jul-18   Jan-19      Jul-19      Jan-20      Jul-20

                                                                                                                                                                    Source: Talaria, Bloomberg
                                                                           Based on quarterly returns of Talaria Global Equity Strategy (Foundation Units) (pre-fees) January 2015 – July 2020
                                                                                                                                     Past performance is not an indicator of futureperformance

                                                                                                                                                                                          28
So retirees require

   Retirees need an alternative and more stable source of income
   generation now.

   Retirees need less volatility to enjoy their retirement.

   Retirees need to diversify their sources of return.

   There is a solution that creates greater retirement certainty.

                                                                    1
                                                                    2
You can also read