The State of Britain's Hedgehogs 2022
←
→
Page content transcription
If your browser does not render page correctly, please read the page content below
The State of Britain’s
                Hedgehogs 2022
                David Wembridge, Grace Johnson, Nida Al-Fulaij & Steve Langton

                 ►  Hedgehogs in Britain have undergone a long historic decline, but differences
                    between urban and rural populations are becoming increasingly apparent.
                 ►  In urban areas, the picture is of a stable population that might be recovering,
                    highlighting the importance of gardens and green spaces, and local action, in
                    ensuring a future for hedgehogs.
                 ►  In stark contrast, rural populations remain low and, in the last two decades, have
                    continued to decline by between a third and three-quarters nationally. The largest
                    declines are seen in the eastern half of England.

                 Introduction
                 In 2011, the first State of Britain’s Hedgehogs report highlighted the findings
                 of several surveys that pointed to a widespread loss of hedgehogs (Erinaceus
                 europaeus) over the previous ten years. In 2020, hedgehogs were put on the IUCN
                 Red List as vulnerable to extinction in Great Britain. A decade on from the original
                 report, the current State of Britain’s Hedgehogs assesses how the hedgehog
                 population has changed since.

                 Distribution
                 Hedgehogs occur widely across mainland Great Britain, but show regional
                 variations, being most abundant in the north and east of England and Scotland.
© Cate Barrow

                 The map shows distribution based on records from the British Trust for
                 Ornithology’s (BTO) Garden BirdWatch (2007-20), the darker the square, the
                 greater the likelihood of recording hedgehogs. White squares had too few data to
                 estimate a likelihood.

                                                                                                          01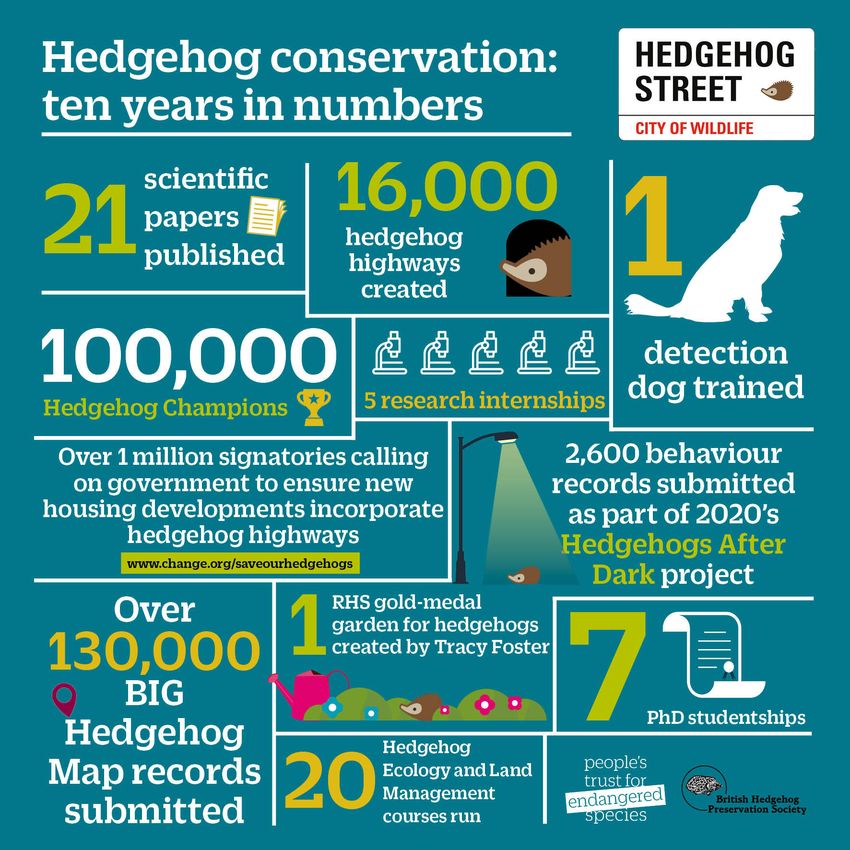
How many hedgehogs are there in our towns                 Population size
                                   and cities?                                 Estimating the number of hedgehogs nationally with a high
                                                                               level of certainty is not easy. Hedgehogs are widespread
 A handful of estimates of hedgehog density in urban
                                                                               but scarce, presenting practical challenges in finding them.
 areas have been made. These include sites such as
                                                                               So few might be encountered in a night-time survey, for
 amenity grassland and playing fields, and more broadly
                                                                               example, that estimates of density (the number in a given
 defined areas identified as ‘urban’ or ‘greater than 25
                                                                               area) are often imprecise.
 per cent of built land cover’, for example. Nine studies,
 in very different locations (from northeast London to
                                                                               If the number per hectare or per km2 in a particular
 the edge of a village) estimated densities from 7.4 to 176
                                                                               habitat (such as amenity grassland or arable farmland) is
 hedgehogs per km2, with most between 20-50 per km2.
                                                                               determined, then the population size can be estimated by
                                                                               multiplying density by total area, for a given habitat, and
 Information about green space in urban areas is
                                                                               adding together the values for each habitat-type to obtain
 published as part of the UK natural capital accounts
                                                                               an overall total. In 2018, The Mammal Society estimated
 developed by Defra and the ONS. They estimate urban
                                                                               the population to be 879,000, but there is considerable
 areas in England, Scotland and Wales cover 17,686 km2,
                                                                               uncertainty in this figure.
 of which 60.2 per cent (10,657 km2) is either gardens or
 natural land cover.
                                                                               Most counts of hedgehogs are from urban areas, often on
                                                                               amenity grassland, such as playing fields. The population of
 If the average density of hedgehogs in these green
                                                                               hedgehogs in gardens and other urban green spaces may be
 spaces is taken to be 25 per km2, the total number of
                                                                               around 200,000-250,000. This is derived from estimates of
 urban hedgehogs is around 266,000. If a lower density
                                                                               the extent of urban green space published as part of the UK
 of 10 per km2 is applied to the whole urban area (17,686
                                                                               natural capital accounts developed by the Office for National
 km2), the number is 177,000.
                                                                               Statistics (ONS) and Defra, and a consensus value for density
                                                                               from several studies.

     Population change estimated from the proportion
                                                                               Evidence that numbers are changing
     of sites recording hedgehogs in gardens and urban                         Records of hedgehogs accidentally killed by gamekeepers,
                         green spaces                                          analysed thirty years ago, show a long-term decline, going
                                                                               back to the early 1960s. Between 1995 and 2009, gamebag
                                     120
                                                                               records fell by 28 per cent and, over a similar period, the five
                                                                               surveys reviewed in the first State of Britain’s Hedgehogs
                                                                               report showed annual declines of between 2.2 and 7.9 per
       population index (2003=100)

                                     100                                       cent. Since 1990, counts of hedgehog road casualties have
                                                                               fallen by perhaps as much as three-quarters.
                                      80
                                                                               For this report, data from five surveys, collected between
                                                                               1981 and 2020, were looked at and new analyses of four of
                                      60
                                                                               the surveys carried out. Two surveys covered predominantly
                                                                               urban areas, and three surveys, sites in rural areas (see p8).
                                      40
                                        2000      2005    2010   2015   2020   Hedgehogs in urban areas
     (a) PTES Living with Mammals
                                                                               Urban areas (mixtures of gardens, amenity grassland and
                                     140
                                                                               other green space) are thought to be a refuge for hedgehogs
                                     120
                                                                               from pressures in the wider landscape and can support
       population index (2009=100)

                                                                               high numbers of hedgehogs. However, road mortality is
                                     100
                                                                               highest around towns, where there is a mix of urban and
                                                                               grassland habitats, and the loss of amenity grassland, and
                                      80
                                                                               more enclosed gardens threaten populations in urban
                                                                               environments. Nevertheless, the picture emerging of
                                      60
                                                                               hedgehogs in urban areas is encouraging.

                                      40                                       The first State of Britain’s Hedgehogs estimated that a
                                           2000    2005   2010   2015   2020   quarter of the population in urban areas had been lost in the
     (b) BTO Garden BirdWatch                                                  first decade of the century. The most recent data show no
                                                                               indication that that decline is continuing. The picture is of
     Figure 1. Solid lines show the smoothed trends for estimates              a stable population that might be recovering. It should be
     of the proportion of sites each year recording hedgehogs,
     from sightings or signs, in (a) Living with Mammals and                   remembered, however, that any recovery starts from a low
     (b) Garden BirdWatch. The proportion is expressed as an                   baseline at the end of a long period of decline.
     ‘index’ relative to that in a baseline year (=100). Broken lines
     show 95% confidence limits.

02
Two surveys, People’s Trust for Engangered Species’ (PTES)         Population change estimated from average weekly
Living with Mammals survey and BTO’s Garden BirdWatch,              counts of hedgehogs in gardens and urban green
collect records of hedgehogs in urban areas (mostly domestic
                                                                              spaces where they were found
gardens). Trendlines estimating the proportion of sites that
recorded hedgehogs (from either sightings or signs) differ
                                                                                                   140
slightly between the two surveys.
                                                                                                   120
The trend from Living with Mammals decreases until 2013

                                                                     population index (2004=100)
and then stays more or less flat (1a), 25% below its value in
                                                                                                   100
2003. The proportion of sites recording hedgehogs in Garden
BirdWatch similarly falls until 2013 but then increases sharply
                                                                                                    80
(1b). The proportion of sites is estimated as an ‘index’ (on
the vertical axis on the graph) relative to baseline year. The
                                                                                                    60
baseline is given an arbitrary value (100) and is different in
the two surveys. Values for individual years, therefore, are not                                    40
directly comparable between the surveys, but the shape of                                             2000   2005   2010   2015   2020

the trendlines, showing how the population is changing, can        (a) PTES Living with Mammals
be compared.
                                                                                                   140

        In urban areas, the                                                                        120

                                                                     population index (2009=100)
        picture is of a stable                                                                     100

          population that                                                                           80

        might be recovering                                                                         60

                                                                                                    40
                                                                                                      2000   2005   2010   2015   2020

Differences in the shape of the trendlines may be due to the       (b) BTO Garden BirdWatch
different survey methodologies. In particular, mammals are
only recorded optionally in Garden BirdWatch. To identify          Figure 2. Solid lines show the smoothed trends for average
                                                                   weekly maximum counts (the largest group of hedgehogs
those weeks when participants looked for mammals, only
                                                                   seen together each week) in (a) Living with Mammals and
those weeks when a mammal species was recorded were                (b) Garden BirdWatch. Average counts are expressed as an
used in the analysis. This ensured null records (when              ‘index’ relative to that in a baseline year (=100). Broken lines
hedgehogs were taken to be absent) occurred because no             show 95% confidence limit.
hedgehogs had been seen rather than because mammals
weren’t looked for that week. However, this means that weeks
when participants did look for mammals, but didn’t see any,
were omitted.

Looking at the proportion of sites recording hedgehogs
shows presence or absence and not necessarily abundance;
fewer hedgehogs may occupy the same number of sites, or
the same number of hedgehogs, squeeze into fewer sites. The
proportion of suitable sites might change independently of
hedgehog numbers. The average weekly maximum count,
when hedgehogs were seen, is more indicative of abundance
at sites where hedgehogs are present. The smoothed trends
for these are shown below.

Average weekly counts fall until about 2010/11, after which
they increase, and both surveys show a similar pattern.
This doesn’t tell us anything about where hedgehogs
occur - whether they’re present at fewer or more sites - only
that numbers are increasing at sites where they are found.
Regionally, Garden BirdWatch data suggest the initial decline
was most marked in the eastern half of England.
                                                                                                                                              © Alison Austwick

An increase in counts might also occur, however, if
hedgehogs are increasingly ‘detectable’. There is some
evidence to suggest that the use of trail cameras in Living
with Mammals has increased in the last ten years and, if this

                                                                                                                                         03
is the case, larger counts of hedgehogs might be more likely.           landscape is likely to be falling. The trend (Fig. 3) is the most
Neither proportion of sites nor maximum counts indicates an             recent statistical analysis, but a crude comparison of counts
ongoing decline of hedgehogs in urban areas. Instead, they              in the table below tells the same story and, as circumstantial
show a more stable population might be recovering.                      evidence at least, supports the finding of a large decline in
                                                                        rural areas.
Hedgehogs in rural areas
Three surveys show a loss of hedgehogs in rural areas                                   hedgehog          billion vehicle-kms
nationally of between a third and three-quarters of the                                 casualties /100km (GB) /year
population in the last two decades. The largest declines                 1990-93        2.16                  412
are in the eastern half of England.
                                                                         2001-04        1.45                  484
Data from three surveys, covering sites in rural areas, were             2011-14        0.62                  503
analysed. Each shows a falling population trend and,
                                                                         2015-18        0.69                  548
although there are difficulties unpicking the data, and
uncertainty in all of them, the common picture is strong                Counts of hedgehog road casualties (per 100km) collected
evidence that the population has undergone a substantial                in similar surveys in the 1990s, run by Pat Morris at Royal
decline.                                                                Holloway, University of London, and since 2000, as part of PTES’
                                                                        Mammals on Roads. Traffic volume has steadily increased, and
Between 1981 and 2019, the population index estimated                   the average collective distance travelled by road vehicles each
from records of hedgehogs in the Game and Wildlife                      year in England, Scotland and Wales is also shown (data from the
Conservation Trust’s National Gamebag Census, fell by a half.           Department for Transport).
In recent years, the decline is less (statistically) clear, but the
population estimate fell by 35 per cent in the last 25 years and        Comparing evidence
by 16 per cent in the last decade (2009-19).                            Differences in survey design and in the type of data
                                                                        collected (quantitative counts or presence data) make it
The Breeding Bird Survey, shown below, in red, shows a                  difficult to directly compare trends. Records of presence or
steeper decline: between 2002 and 2019, the trend, estimated            absence (largely from either field signs or local knowledge)
from either sightings of live animals or other evidence that            don’t necessarily say anything about abundance. In a
hedgehogs were present, fell by 77 per cent. Over much of               daylight survey, however, such as the Breeding Bird Survey,
the last two decades, the population has decreased by an                hedgehogs are unlikely to be active and too few seen for
average of 8.3 per cent each year. The trend does, however,             counts to give a reliable trend. Difficulties with the data also
level off and the population has remained at about a fifth of           come about because of small changes in the protocol from
its 2002 value since 2015.                                              year to year and the fact that the Breeding Bird Survey is not
                                                                        primarily intended to record hedgehogs, so there is some
                                   140
                                                                        uncertainty in the size of the decline. It is not unprecedented,
                                   120                                  however. In seven years, between the late 1980s and mid-
                                                                        1990s, the water vole population decreased by 88 per cent, to
     population index (2002=100)

                                   100
                                                                        fewer than a million individuals. The picture for hedgehogs is
                                   80                                   alarmingly similar.
                                   60
                                                                        Regional variation
                                   40
                                                                        Where there were sufficient data, regional trends were
                                   20                                   estimated from the National Gamebag Census. Since 1994,
                                                                        the largest declines have been in the East Midlands and
                                    0
                                     2000   2005   2010   2015   2020   East of England regions, with declines of 74 and 35 per cent
                                                                        respectively. In the last decade, the loss has been a third and a
 Figure 3. Smoothed population trends (solid lines) estimated           quarter of their respective populations.
 from presence or absence records in the BTO/RSPB/JNCC
 Breeding Bird Survey (red) and PTES Mammals on Roads                   Like the count analyses of Living with Mammals or Garden
 (blue) surveys. The population index is expressed relative             BirdWatch count data, those of the National Gamebag
 to the baseline year, 2002 (=100) and broken lines show 95%            Census data don’t include records when no hedgehogs were
 confidence limits.
                                                                        recorded. Hence, the change in gamebag records reflects a
                                                                        fall in the number of hedgehogs where they were present,
A similar rate of decline to that indicated by the Breeding
                                                                        rather than a change in the percentage of positive sites
Bird Survey is seen in counts of hedgehog road casualties
                                                                        (those where hedgehogs were recorded). The latter also fell,
in PTES’ Mammals on Roads survey, despite very different
                                                                        from about a fifth in 1981 to less than one in twenty, in 2019.
survey methodologies.
                                                                        The regional pattern seen in the National Gamebag Census,
Counts of hedgehog road casualties have been recorded                   showing steeper declines in the east, was not apparent in
since the early 1990s, and are used as an indication of                 either the Breeding Bird Survey or Mammals on Roads data.
changes in the wider population. If counts fall (despite
a steady increase in traffic volume), abundance in the

04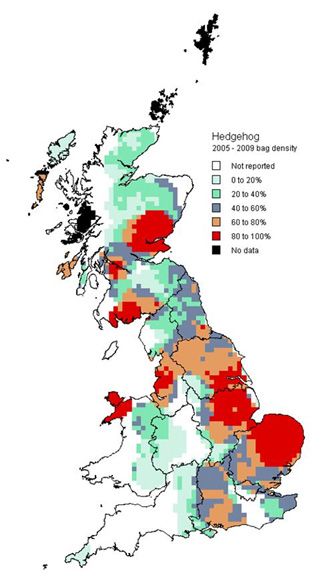
Geographical change over time                                             Percentage change in rural population estimates
If the relative abundance of hedgehogs across the country                 from the National Gamebag Census 1994 to 2019
is calculated for different periods, using records from the
National Gamebag Census, a pattern of decline over time
                                                                                                                        Yorkshire &
becomes apparent.                                                             East Midlands   East of      South East   the Humber
                                                                                   (27)     England (89)      (48)          (46)    England (287) Scotland (123)
                                                                         0
Relative spatial abundance was calculated for four periods:
1985-89, 1995-99, 2005-09 and 2015-19, and shown on the
                                                                        -10
maps as a coloured scale.
                                                                        -20
Many sites in southwest England and Wales that reported
hedgehogs in the 1980s, had stopped reporting them by
                                                                        -30
the 1990s. In the following decade, areas of relative high
abundance had shrunk further, while areas with no records                                                                                 *
of hedgehogs expanded. The earliest declines are in the west            -40
                                                                                                 *
and occur later further eastward, but by the end of the 2010s,
declines are widespread. By 2015-19, areas of high abundance            -50

were restricted to south-east Scotland, north Wales and
eastern England. Hedgehogs were not reported in most of                 -60

western and northern Scotland and much of England.
                                                                        -70

Some caution should be taken interpreting the data from the
National Gamebag Census. It isn’t known how much trapping               -80        *
effort has changed over the period—the number of traps or
the length of time they’re set - or whether the willingness            Figure 4. Values were calculated from smoothed estimates
to report hedgehogs has changed. In addition, the use of               (of the number of hedgehogs in a given area) for the first
                                                                       and most recent year (for the East Midlands, the change is
excluders on tunnel traps, which reduce the number of
                                                                       for 1981 to 2018). The change is statistically significant in the
hedgehogs caught, may have increased over time. The extent
                                                                       East Midlands and East of England regions, and in England
of these isn’t known, but the spread of the decline, from west         (indicated by a ‘*’). The number of participating sites is shown
to east, doesn’t support the idea that it is due to changes in         in parentheses. There were too few sites in other regions and
trapping effort or reporting.                                          in Wales over the period to estimate a change.

1985-89                        1995-99                         2005-09                                      2015-19
                                                                                                                                                      Hedgehog
                                                                                                                                                      density
                                                                                                                                                      Not reported
                                                                                                                                                      0 to 20%
                                                                                                                                                      20 to 40%
                                                                                                                                                      40 to 60%
                                                                                                                                                      60 to 80%
                                                                                                                                                      80 to 100%
                                                                                                                                                      No data

Figure 5. Maps show the relative density of hedgehogs reported in the GWCT National Gamebag Census between 1985 and 2019. Annual
numbers of hedgehogs at each site and year were divided by site area and averaged over the five-year period. An average value for each
10-km Ordnance Survey grid square was calculated and is shown as a relative abundance. Pale blue indicates the lowest abundance and
dark red, the highest. White areas are those in which no hedgehogs were reported. Data from 619 sites were including in the mapping
for the period 1985-89 , whilst 788 sites were included in the mapping for 2015-19.

                                                                                                                                                               05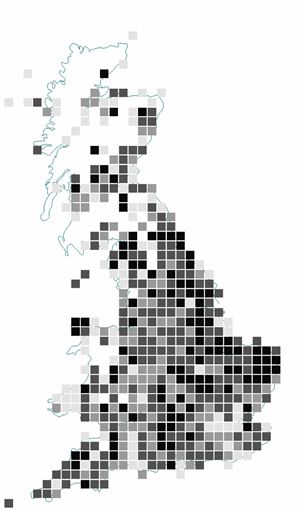
Are badgers responsible for the hedgehog decline?

 Badgers are most abundant in lowland pastoral
 landscapes (over half the population is in the south-
 west of England and south Wales), areas where
 hedgehogs are comparatively scarce. The two species
 compete for food, such as earthworms and beetle
 larvae, and badgers will also eat hedgehogs. When they
 are foraging, hedgehogs tend to avoid areas where
 badgers have recently been active.

 But while competition, predation, and avoidance are

                                                                                                                              © Helen Errington
 likely to reduce hedgehog numbers in areas with lots of
 badgers, the two species can co-exist and, moreover, in a
 national survey, hedgehogs weren’t found in 71% of rural
 sites where there are no badger setts.

 Researchers at Nottingham Trent University are trying            Hedgehog conservation:
 to understand the interaction between badgers and
                                                                  Hedgehog Street ten years on
 hedgehogs more fully and the extent of competition
 between the two species.
                                                                  Tackling the urban decline
                                                                  In 2011 Hedgehog Street was launched by BHPS and
                                                                  PTES to raise awareness and build community action
Why are hedgehog numbers falling?
                                                                  to support hedgehog populations. The campaign aims
Hedgehogs have existed here for at least half a million years.    to improve habitats for hedgehogs and to join up green
But they might not survive in our natural environment             spaces at a neighbourhood scale. Small holes at the base
for many more. Britain is one of the most nature-depleted         of fences to give access to gardens, known as ‘hedgehog
nations in the world and wildlife continues to be lost. The       highways’, are a cornerstone of the campaign and one of
reasons for the decline in hedgehog populations, apparent         its Top Tips for encouraging hedgehogs in urban areas.
in the last twenty or more years, aren’t fully understood yet.    Other tips include eliminating the use of chemicals,
Pointing the finger at a single cause, such as predation by       such as slug pellets, leaving a small area to grow wild,
badgers or road casualties, likely misses the bigger, more        dealing with hazards, such as discarded netting and
complex picture.                                                  steep-sided ponds, and providing ‘hedgehog houses’
                                                                  and supplementary food.
Research funded by PTES, the British Hedgehog Preservation
Society (BHPS) and others in the last decade has improved         Hedgehog Champions
understanding of rural hedgehogs. They prefer villages            Simple, practical guidance for the public, and tailored
to open farmland, particularly arable land, and follow field      advice for housing developers and land managers, is
margins and hedgerows. Badgers and major roads have a             provided online, distributed through leaflets, training
negative impact and might threaten populations locally, but       courses and at events. Over 100,000 people have signed
even where badgers are absent, hedgehogs choose areas in          up to be Hedgehog Champions, adding hedgehog-
villages rather than farmland habitats.                           friendly features to their gardens and raising awareness
                                                                  of the ways local communities can help improve urban
Foremost of the pressures that hedgehogs face is an               environments.
impoverished environment. The loss of landscape features
such as hedgerows is responsible in part but isn’t the whole      An important element of Hedgehog Street is the BIG
story. An estimated half of Britain’s hedgerows were lost in      Hedgehog Map, mapping sightings of hedgehogs
the second half of the last century, but in the last twenty       submitted by the public. These records, of live and dead
years efforts have been made to restore and improve them.         hedgehogs, improve our understanding of hedgehog
A lot more can be done, but we also need to look at other         distribution across the UK and how this changes over
aspects of the countryside: at the management of field            time. The interactive map can highlight local records, so
margins and soils, and the number and abundance of                that community projects can focus conservation efforts.
invertebrate species; at connectivity in the landscape, linking   To date, the map shows over 120,000 sightings and the
habitats and populations; at climate change; and at the           data are shared with local and national record centres.
interaction of species in a changing environment.
The continuing loss of a generalist species such as               Hedgehog Street has also run several citizen science
hedgehogs, like that of farmland songbirds, is the ‘canary in     projects involving the Hedgehog Champions. The
the coal mine’. To stop it, we need to recognise the essential    Hedgehog Housing Census explored hedgehog nesting
value of biodiversity, our dependence on the tapestry of          habits; Hedgehogs After Dark recorded nocturnal
natural habitats and species. That tapestry is becoming           behaviour; and the Hedgehog Hibernation Survey
threadbare. Even if you care little about hedgehogs, we           looked at winter activity patterns.
should all care about the nature that supports them and us.
06
Tackling the rural decline
Greater awareness of the need for
conservation, and individual and
community actions such as hedgehog
highways, may have turned the decline
of hedgehog populations in urban areas.
To do the same for rural populations, we
need greater understanding, awareness,
and action. We know that:
► wide, grassy field margins support
more earthworms and ground beetles,
increasing the availability of prey
► increasing the complexity of the
habitat – with more and denser
hedgerows, for example, that offer
greater shelter – may reduce the
impact of predators
► hedgehogs occupy only about a fifth
of the rural landscape. Their presence
is inversely related to the density of
badger setts, but hedgehogs are also
absent from 71% of sites that had no
badger setts
► hedgehogs follow linear features in the
environment and do so more where
there are badgers. We don’t yet know
the extent to which the loss of hedgerows or poorer quality
hedgerows increases the risk of predation by badgers
As well as:
► in arable areas, hedgehogs preferentially seek out gardens
and built environments to forage ► helping farmers manage their land for hedgehogs
► hedgehog density is lowest in arable areas and highest in ► regularly updating land management advice to reflect the
gardens and on amenity grassland in rural areas. Although latest research
new research is addressing the problem, estimates of
► training green space managers to create hedgehog
hedgehog density in different habitat types are still few,
and population estimates, uncertain friendly amenities
► developing improved tools and methodologies for
► nationally, road casualties might account for around 10-
20% of the population each year, but it’s unclear whether hedgehog surveying
road mortality itself is responsible for the decline ► working to increase the legal protection of hedgehogs.
► the risk of road mortality is highest in urban and suburban
areas, with a mix of grassland and urban habitats PTES and BHPS remain committed to hedgehog
conservation. Our future priorities are to:
► hedgehogs will use road underpasses, but it isn’t known
► continue to extend the reach of Hedgehog Street and its
how effective these are in reducing road mortality at the
population level. amazing Hedgehog Champions
► reach new audiences through farming clusters, events and
PTES and BHPS are currently funding and supporting
research into rural hedgehogs and their decline, looking at: publications and assist farmers with new ELM schemes to
benefit hedgehogs
► nest site selection and over-winter survival ► promote the importance of hedgerows and hedgerow
► garden use in urban areas and the impact of connecting
management for hedgehogs and other wildlife through
them PTES’ Great British Hedgerow Survey
► engage with government consultations about sustainable
► prey availability, habitat quality and predation in relation
to abundance farming, local nature and landscape recovery, and planning
► set up a national monitoring programme to understand
► road mortality and its impact on populations
factors affecting distribution, especially in the rural
► use of tunnels under roads, and the effectiveness of tunnels landscape.
in reducing the risk of casualties.
07As we learn more, practical conservation efforts will be put PTES Mammals on Roads (2001-18) The survey collects records
in place. Current research at Nottingham Trent, Reading, and of hedgehog road casualties outside urban areas, together with
Hartpury Universities and at the Institute of Zoology, will also information about the length and location of the route. The analysis
increase our understanding of the factors driving the decline of of data up to 2017 was presented in the State of Britain’s Hedgehogs
2018, More recent data, up to 2018, are compared here without a
rural hedgehogs. Working with farmers and conservationists,
statistical analysis.
we continue to push for practices that benefit biodiversity and
a countryside where hedgehogs are not pushed to extinction. Other key references
But until the natural environment improves, the trend in rural State of Britain’s Hedgehogs 2011,
hedgehog numbers is unlikely to change. https://ptes.org/wp-content/uploads/2014/06/SOBH2011lowres.pdf
Key references and resources Hedgehog Street, https://www.hedgehogstreet.org/
Data used in this report Review of the Population and Conservation Status of British
PTES Living with Mammals (2003-20): maximum counts (the Mammals (Mathews et al., 2018), https://www.mammal.org.uk/
largest number of animals seen at one time) and signs of hedgehogs science-research/mammal-review-2018-technical-summary/
recorded weekly through April, May and June. Around 1300 gardens
and green spaces in the built environment (predominantly urban Trends and Distribution of Hedgehogs Reported to GWCT’s National
areas), surveyed in two or more years, were used in the analysis. Gamebag Census from 1981 to 2019 (Aebischer & Ewald, 2021) https://
www.gwct.org.uk/media/1245072/NGC_Hedgehog_Report_to_
BTO Garden BirdWatch (2007-20): mammals are recorded PTES_2021.pdf
optionally in the survey, either as a count or as present in a given
week. For the analysis, only those weeks that recorded at least ‘Hedgehog Highways’ petition, https://www.change.org/
one mammal species were used (to identify those weeks when saveourhedgehogs
participants were looking for mammals) and only sites that had
surveyed in two or more years (up to 3591 sites). Week numbers 20 Scientific publications from PTES/BHPS-funded work in 2020
to 35 (roughly corresponding to the survey period in Living with Gazzard, A, & Baker, PJ (2020) Patterns of feeding by householders
Mammals) were used in the analysis. affect activity of hedgehogs (Erinaceus europaeus) during the
hibernation period. Animals, 10(8): 1344
BTO/JNCC/RSPB Breeding Bird Survey (2000-19). The Breeding
Bird Survey is a partnership jointly funded by the British Trust for Yarnell, RW, & Pettett, CE (2020) Beneficial Land Management for
Ornithology (BTO), Royal Society for the Protection of Birds (RSPB) Hedgehogs (Erinaceus europaeus) in the United Kingdom. Animals,
and the Joint Nature Conservation Committee (JNCC), with fieldwork 10(9): 1566
undertaken by volunteers. Transect surveys are walked each year at
randomly selected OS grid-squares, optionally recording mammals, Bearman-Brown, LE, Wilson, LE, Evans, LC, & Baker, PJ (2020)
including live animals, field signs, dead animals, and local knowledge Comparing non-invasive surveying techniques for elusive,
of presence. The number of surveys has increased over time (in 2019, nocturnal mammals: A case study of the West European hedgehog
3,605 squares were surveyed for mammals). The daytime survey, (Erinaceus europaeus). Journal of Vertebrate Biology, 69(3): 20075-1
however, is not primarily suited to recording nocturnal species such
as hedgehogs. Since 2010, in any single year, hedgehogs have been Bearman-Brown, LE, Baker, PJ, Scott, D, Uzal, A, Evans, L, & Yarnell,
recorded in between 34 and 91 squares. RW (2020) Over-winter survival and nest site selection of the west-
European hedgehog (Erinaceus europaeus) in arable dominated
GWCT National Gamebag Census (1981-2019) The National landscapes. Animals, 10(9): 1449
Gamebag Census is a voluntary survey run by the Game and Wildlife
Conservation Trust, collecting annual records from shooting Moore, LJ, Petrovan, SO, Baker, PJ, Bates, AJ, Hicks, HL, Perkins, SE,
estates in England, Scotland and Wales of animals killed. It collects & Yarnell, RW (2020) Impacts and potential mitigation of road
data on 20 mammal species that are either game or pest species. mortality for hedgehogs in Europe. Animals, 10(9): 1523
The analysis used data from 418 sites and. An average of 90 sites
returned records of hedgehogs each year.
Acknowledgements
Steve Langton and, separately, Nicholas Aebischer
and June Ewald (GWCT), produced the most recent people’s
estimates of trends reported here and we thank BTO, trust for
GWCT and RSPB for sharing their data. In particular, we endangered
thank David Noble (BTO) and Richard Yarnell (NTU) for
species
helpful discussions. Thanks also to the many survey www.ptes.org www.britishhedgehogs.org.uk
volunteers, without whom this report couldn’t be enquiries@ptes.org info@britishhedgehogs.org.uk
produced, and to each and every Hedgehog Champion 020 7498 4533 01584 890 801
making a difference for hedgehogs.
registered charity no. 274206 registered charity no. 1164542
08You can also read