The public health benefits of reducing air pollution in the Barcelona metropolitan area
←
→
Page content transcription
If your browser does not render page correctly, please read the page content below
The public health benefits
   of reducing air pollution
       in the Barcelona
       metropolitan area

                            Nino Künzli
                         ICREA Research Professor
Institut Municipal d’Investigació Mèdica (IMIM-Hospital del Mar), Barcelona
      Centre de Recerca en Epidemiologia Ambiental, Barcelona, Spain

                            Laura Perez
     Centre de Recerca en Epidemiologia Ambiental, Barcelona, Spain

                          Prepared for:
        Departament de Salut de la Generalitat de Catalunya
                                and
Departament de Medi Ambient i Habitatge de la Generalitat de Catalunya

                      September 2007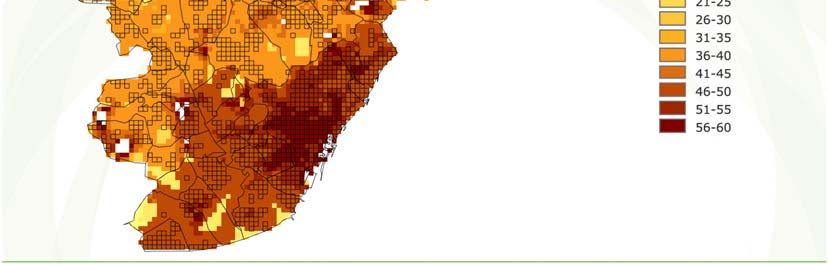
The public health benefits of reducing air pollution in the Barcelona metropolitan area

Nino Künzli
ICREA Research Professor
Centre de Recerca en Epidemiologia Ambiental, Barcelona, Spain
Institució Catalana de Recerca i Estudis Avançats, Barcelona, Spain

Laura Perez
Centre de Recerca en Epidemiologia Ambiental, Barcelona, Spain

Internal collaborators and reviewers
Jordi Sunyer, co-director, Centre de Recerca en Epidemiologia
Ambiental, Barcelona, Spain
Fintan Hurley, Scientific Director, Institut of Occupational Medecine,
Edinburg. UK
Aaron Cohen, Principal Scientist, The Health Effects Institut, Boston, USA
Guillem López i Casanovas, Professor in applied economics, Universitat
Pompeu Fabra, Barcelona, Spain (Chapter 6)
Brian Miller, Principal Epidemiologist, Institut of Occupational Medecine,
Edinburg. UK (Chapter 6, calculation life years)
Xavier Querol, investigator, Instituto de Ciencias de la Tierra "Jaume
Almera”, Consejo Superior de Investigaciones Científicas, Barcelona,
Spain.

Extended project group
The following persons participated in one or more project meetings.
Agència de Salut Pública de Barcelona: Manel Cabré-González and
Natalia Valero
Enric Duran of PAMEM and principal investigator from “Estudio sobre la
Salut Respiratoria en la Infancia” (SARI) project.
Departament de Salut, Generalitat de Catalunya: Neus Cardeñosa,
vigilància epidemiològica; Nuria Juliachs i Annabel Pedrol, serveis
territorials a Barcelona; Xavier Llebaría, agència protecció de la salut;
Rosa Monterde, sanitat ambiental; and Oriol Ribas and Angel Teixido,
protecció de la salut.
Departament de Medi Ambient i Habitatge, Generalitat de Catalunya:
Isabel Hernández, Xavier Guinart, Maria Comellas, vigilància i control
de l'aire; and LLuís Guitard, and Cristina Jové, gabinet tècnic.
Enric Rovira, Observatori Mediambient Camp Tarragona.
CREAL: Inmaculada Aguilera , Josep Maria Antó, Laura Bouso,
Bénédicte Jacquemin, Laura Fernandez, Nino Künzli, Jordi Sunyer, and
Laura Perez.

Acknowledgments:
The authors thank Josep Maria Antó, director of the Centre de Recerca
en Epidemiologia Ambiental, Antoni Plasència, general director of the
Departament de Salut de la Generalitat de Catalunya and Maria
Comellas, general director of Qualitat Ambiental and of the
Departament of Medi Ambient i Habitatge of the Generalitat de
Catalunya for supporting this study.
The authors thank Isabel Hernández, general subdirector of the
Prevenció i Control de la Contaminació Atmosfèrica of the Departament
of Medi Ambient i Habitatge de la Generalitat de Catalunya and her
staff for facilitating access to environmental data.
The authors thank Elvira Torné and Josep Benet of the Registre del
Conjunt Mínim Bàsic de Dades de l’Alta Hospitalària (CMBDAH) of the
Consorci Sanitari de Barcelona (CSB), for providing access to data on
respiratory and cardiovascular hospital admissions.
The authors thank Estel Plana, Raquel Garcia, and Inmaculada Aguilera
of the Centre de Recerca en Epidemiologia Ambiental (CREAL) for
support with access to data from the European Community
Respiratory Health Survey and support with GIS maps

Centre de Recerca en Epidemiologia Ambiental                                                            2
Doctor Aiguader, 88 l E-08003 Barcelona l Tel +34 93 316 04 00 l Fax +34 93 316 06 35 l www.creal.cat
The public health benefits of reducing air pollution in the Barcelona metropolitan area

Table of contents
                                                    List of acronyms

                                                    Executive summary

                                             1.     Introduction
                                             1.1    Air pollution and health
                                             1.2    Air pollution in Barcelona and
                                                    surrounding areas
                                             1.3    Evaluating the public health impact
                                                    of air pollution

                                             2.     Objectives

                                             3.     Methods
                                             3.1    General framework
                                             3.2    Study area
                                             3.3    Population exposure
                                             3.4    Health outcomes
                                             3.5    Scenario of interest
                                             3.6    Measure of health benefits
                                             3.7    Expression of uncertainty

                                             4.     Results
                                             4.1    Mortality
                                             4.2    Hospital admissions
                                             4.3    Morbidity

                                             5.     Discussion and sensitivity analysis
                                             5.1    General comments
                                             5.2    Concentration-response function
                                             5.3    Health outcomes
                                             5.4    Population exposure
                                             5.5    Sensitivity analysis
                                             5.6    Time between air quality improvement
                                                    and public health benefits
                                             5.7    Comparison with other risk factors

                                             6.     Monetary valuation of health
                                                    benefits
                                             6.1    Introduction
                                             6.2    Monetary measures-VSL approach
                                             6.3    Results based on VSL approach
                                             6.4    Discussion of the monetary valuation

                                             7.     General conclusions

                                                    References

Centre de Recerca en Epidemiologia Ambiental                                                            3
Doctor Aiguader, 88 l E-08003 Barcelona l Tel +34 93 316 04 00 l Fax +34 93 316 06 35 l www.creal.cat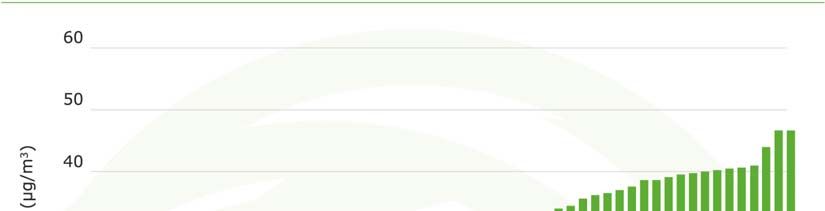
The public health benefits of reducing air pollution in the Barcelona metropolitan area

List of acronyms

     µg/m3        micrograms per cubic meter
    95%CI         95% Confidence Interval
           BS     Black Smoke
CAFE-CBA          Clean Air For Europe cost-benefit analysis
           CB     Chronic bronchitis
         COI      Cost of Illness
         CRF      Concentration-Response Function
     ECRHS        European Community Respiratory Health
                  Survey
           EU     European Union
         EPA      Environmental Protection Agency
         HIA      Health Impact Assessments
           LE     Life Expectancy
           LY     Life years
         NO2      Nitrogen Dioxide
          PM      Particulate Matter
        PM10      Particulate Matter with diameter inferior
                  to 10 micrometers
       PM2.5      Particulate Matter with diameter inferior
                  to 2.5 micrometers
       QALY       Quality Adjusted Life Years
         TSP      Total Suspended Particles
           US     United States
       VOLY       Value of Life Years
         VSL      Value of Statistical Life
       WHO        World Health Organization
        WTP       Willingness-To-Pay

Centre de Recerca en Epidemiologia Ambiental                                                            4
Doctor Aiguader, 88 l E-08003 Barcelona l Tel +34 93 316 04 00 l Fax +34 93 316 06 35 l www.creal.cat
The public health benefits of reducing air pollution in the Barcelona metropolitan area Executive Summary In the last decade, numerous studies conducted in animal and human populations have confirmed that exposure to current levels of ambient anthropogenic air pollution lead to a wide range of adverse health effects, including disease and death. More recent research suggests that pollutants emitted by cars and trucks are of particular health concern. A few studies even show that morbidity and mortality promptly decreased in areas where air quality improved. Despite open research questions, the amount of information has become large enough to approximately quantify the burden of health problems that can be attributed to ambient air pollution in a given region, country, or city. Such risk assessment – or the translation of research findings into a quantifiable public health burden - is an important tool to inform policy makers and the public about the size of the current problem and, thus, about the potential public health benefits of air pollution regulations. Air quality measurements in recent years revealed high levels of pollution in many urban areas of the world. Research shows that current levels of air pollution in Barcelona and adjacent municipalities is particularly high and constitutes a health hazard. For example, inhalable particulate matter (PM10), tiny particles of solid or liquid origin suspended in the air with a diameter of up to 10 micrometres (µm), and the gas nitrogen dioxide (NO2) – a marker of traffic related pollution - regularly exceed current standards set by the World Health Organization (WHO) to protect health. Strategies are being prepared by the Generalitat de Catalunya to improve air quality in those areas of Catalonia with the highest concentrations of pollution. The first step is the implementation of a mitigation plan for the Barcelona metropolitan area. The short-term goal of this plan is to reduce air pollution to comply by 2010 with the current standards legislated in the European Union (EU).The objective of this study was to estimate the health benefit that is expected to result from a reduction of air pollution in the Barcelona metropolitan area. Methods The method used to estimate the health benefits is based on standard approaches to derive the number of adverse effects that are attributable to some established risk factor. These methods are needed as it is not possible to directly observe or count the number of health problems due to risk factors such as smoking, diet, or air pollution. The calculation requires three basic pieces of information, namely 1) the current total frequency or occurrence of a health problem in the population, 2) the current level of pollution and the expected future level to derive the change in the concentrations that people are exposed to, and 3) the quantitative information about the association between exposure to air pollution and the occurrence of health outcomes. Selected health problems: This study focused on the evaluation of three main types of health outcomes relevant for individuals and health authorities in terms of severity and burden that they represent: all-cause mortality, including deaths due to acute and long-term exposure to air pollution, morbidity, including chronic bronchitis and asthma related symptoms, and health care use represented by hospital admissions for cardiovascular and respiratory diseases. Centre de Recerca en Epidemiologia Ambiental 5 Doctor Aiguader, 88 l E-08003 Barcelona l Tel +34 93 316 04 00 l Fax +34 93 316 06 35 l www.creal.cat
The public health benefits of reducing air pollution in the Barcelona metropolitan area

Selected pollution: While air pollution consists of a complex mixture of hundreds
of toxic constituents, risk assessments cannot be conducted for each substance
one by one. The most useful approach is to use a marker of urban air pollution,
and most risk assessments use ambient particulate matter (PM) to describe the
burden of pollution and the benefits of regulations. This project is also based on
PM, namely on PM10. Benefits were obtained comparing levels of PM10 to which the
population is currently exposed to the expected levels after reduction of pollution.
The current average population exposure to PM10 was estimated to be
approximately 50 µg/m3 for 57 contiguous municipalities around the municipality
of Barcelona and totaling a population of nearly 4 millions inhabitants.

Scenario of interest: Research existing worldwide suggests that adverse effects of
ambient pollution occur already at very low levels with no evidence for a threshold
below which no effects exist. As a consequence, any improvement of air quality
leads to health benefits, and – vice versa – a further deterioration of air quality in
the Barcelona area will further increase the current health burden attributable to
pollution. Thus, quantification of benefits was done by comparing the current
burden with the one expected if air quality was at some lower levels.
This project chose two lower levels to quantify the health impact of air pollution.
One set of calculations estimate the health benefit of the air pollution mitigation
plan of the Generalitat de Catalunya to achieve the current EU air quality
standards. Thus, this scenario quantifies the benefit of the current PM10 population
mean exposure concentration being decreased by approximately 10 µg/m3 to
meet the current EU PM10 standard of 40μg/m3 annual mean. As shown in many
regions and countries, sustained mitigation plans result in sustained air quality
improvements. Thus, a second set of calculations was developed to quantify the
annual health benefit assuming pollution is further decreased to comply with the
annual mean level proposed by the World Health Organization (WHO) to protect
the health of people. This second scenario quantifies the benefit of the current
PM10 population mean exposure concentration being decreased by approximately
30 µg/m3 to meet with the recommended WHO standard of 20 µg/m3 annual
mean for PM10.

Monetary value of the benefits: Given that societies have limited resources to
allocate to projects and policies, a transformation of health benefits into monetary
values is often welcomed by policy makers and the public. These costs may then
be directly compared to costs of mitigation investments. Based on such
evaluations, the United States Environmental Protection Agency concluded few
years ago that one of the most efficient regulations they ever proposed was the
one targeting air quality. The total investments to improve air quality were
estimated to be far smaller than the benefit for the society. However, there are
ongoing discussions and debates about the most appropriate methods to derive
costs of morbidity and mortality, with some methods used more often in air
pollution cost-benefit assessments than others, but with no definitive agreement
reached on the subject yet. This study provides the range of costs (Euro’s per
year) using one approach commonly used in the past, and a more recent
approach proposed by European projects, and discusses limitations around these
estimates.

Benefits
Health benefits of complying with the PM10 standard proposed by WHO
The study found that reducing current levels of air pollution to the WHO standards
would result in about 3,500 fewer annual deaths (about 12% of all deaths among
people 30 years and older), estimate that includes 520 deaths due to short-term

Centre de Recerca en Epidemiologia Ambiental                                                            6
Doctor Aiguader, 88 l E-08003 Barcelona l Tel +34 93 316 04 00 l Fax +34 93 316 06 35 l www.creal.cat
The public health benefits of reducing air pollution in the Barcelona metropolitan area

exposure to air pollution. This decrease in mortality risk would represent about 14
months increased in life expectancy. In addition to the reduction in death rates, it
was estimated that this reduction in air pollution could result per year in a total of
1,800 fewer hospitalizations for cardio-respiratory diseases, a total of 5,100 fewer
cases of chronic bronchitis symptoms among adults, a total of 31,100 fewer cases
of acute bronchitis among children, and a total 54,000 fewer asthma attacks
every year among children and adults.

Health benefits of complying with the current EU air quality standard
Meeting with EU regulated levels by 2010 is a first step in a long-term strategy
required to meet the more stringent WHO standards. The study found that
reducing current levels of air pollution to the EU standards would already result in
substantial health benefits, reaching approximately a third of those listed for the
WHO scenario. For example, under this scenario, the annual death toll in the
Barcelona metropolitan area could be lowered, on average, by approximately
1,200 deaths per year (about 4% of all natural deaths among people 30 years and
older), representing a five months increase of the life expectancy. This reduction
in air pollution could also result in a total of 600 fewer hospitalizations for cardio-
respiratory diseases per year, a total of 1,900 fewer cases of chronic bronchitis
symptoms among adults, a total of 12,100 fewer cases of acute bronchitis among
children, and a total 18,700 fewer asthma attacks every year among children and
adults.

Monetary benefits
The monetary valuation shows that the health benefits for the WHO scenario could
translate approximately to an average cost of 700 Euros per person per year
based on a revised method proposed by the Clean Air For Europe (CAFE)
program, and 1,600 Euros based on the approach most commonly used so far in
these types of evaluations, or an average total of 3,000 and 6,400 million Euros
per year, respectively. For the scenario assuming a reduction of PM10 to EU
regulated levels, the study found that the health burden listed above could
translate to average costs of 300 Euros per person per year for the CAFE
approach and 600 Euros per person per year for the “common” approach, or an
average total of 1,100 and 2,300 million Euros per year, respectively. Estimates
obtained by the two methods present uncertainty ranges around the central
values that largely overlap.

Discussion and conclusions
Evidence of the role of air pollution in causing adverse health effects and death is
very strong with hundreds of epidemiological studies conducted all over the world
including many studies in Barcelona. This CREAL risk assessment study also
demonstrates the strong impact of air pollution on public health, in line with other
estimations in Europe.
In contrast to events such as deaths due to traffic accidents, the air pollution
impact cannot be directly counted and the quantification of this impact could only
be roughly approximated. In fact, the assumptions and approach used for this
estimation are likely to have underestimated the total benefits that could actually
be obtained by reducing air pollution. The most important neglected burden are
the following:
     •    The list of health effects associated with air pollution is far larger than
          those presented in the risk assessment. The study did not separately
          assess effects of pollution on myocardial infarction, arrhythmia, and

Centre de Recerca en Epidemiologia Ambiental                                                            7
Doctor Aiguader, 88 l E-08003 Barcelona l Tel +34 93 316 04 00 l Fax +34 93 316 06 35 l www.creal.cat
The public health benefits of reducing air pollution in the Barcelona metropolitan area
stroke as they may be included to a large extent – but not completely - in
the hospitalization and mortality estimates. The study did not include less
severe adverse health effects known to be caused by air pollution, such
has eye irritation, cough and other respiratory symptoms, nor
consequences of ailments such as increased self-medication, and school
or work absences, as there are no population based data detailed enough
to quantify this burden in Barcelona.
• The study did not quantify the total burden of air pollution but only the
benefit of a reduction from current levels of PM10 to 40 µg/m3 and 20
µg/m3, respectively. As there is no evidence of the existence of a
threshold below which no health effects may occur, further reductions
below 20 µg/m3 PM10 are expected to lead to additional health benefits.
• The study only used PM10 to quantify the problem, while pollution is far
more complex. Some other pollutants may have independent effects –
such as ozone – or may interact with PM and thus enhance the effects of
PM. Availability of pollution data and/or respective epidemiological studies
is not sufficient to use in this local risk assessment. Other studies, e.g. in
the United Kingdom or the United States, have included pollutants such
as ozone demonstrating additional burden.
• Barcelona has an extremely high traffic density coupled with one of the
highest population densities in Europe. In other words, many people live,
work, and spend their time very close to street traffic. More recent
research suggests a detrimental role of those pollutants that occur in very
high concentrations within the first 50-100 meters along streets. Traffic
proximity distributions are currently not available for Barcelona, thus, this
new evidence could not be used in this risk assessment. The health
burden due to traffic is, however, expected to be clearly underestimated
by this assessment. Also, a few studies measuring PM directly on persons
while they walk, bike, and drive in a city similar to Barcelona lead to the
conclusion that personal exposure to PM10 is even higher for many people
than what is measured at the monitors, while those form the basis of the
estimated concentrations used.
The results obtained in this study are estimates that come with uncertainties
intrinsic to this type of evaluation. The uncertainty range presented in this study
includes the one observed in the quantitative association between PM10 and health
and, when considering all outcomes, averages approximately 50% around the
estimates. Although not as large and more difficult to quantify, due to lack of
information, other data used in the calculations come with inherent uncertainties,
such as the distribution of PM10 concentrations across the region or the frequency
of health outcomes (e.g. symptoms) which are estimates based on surveys.
This study shows that decreasing PM10 levels in the Barcelona metropolitan area
would lead to substantial health benefits. Some strategies to abate pollution lead
to very immediate and sustained improvements in air quality, but the question
remains whether health benefits will be immediate as well. A recent intervention
study showed immediate and sustained reductions in mortality rates following the
ban of coal use in the city of Dublin. Similarly, symptoms in children have been
shown to improve if air pollution declines. However, it is reasonable to expect that
not all benefits of improved air quality will be detectable in the first year. In
general, acute effects of pollution (e.g. hospitalizations) are expected to be
reduced in parallel to the improvements of air quality, but a reduction of chronic
effects (e.g. decrease in the rates of new cases of lung cancer, asthma, or chronic
obstructive pulmonary diseases) of air pollution may take longer to materialize.
Based on theoretical models conducted elsewhere, it has been estimated that one
could expect 40% of the total annual death benefits to materialize in the first
year.
Centre de Recerca en Epidemiologia Ambiental 8
Doctor Aiguader, 88 l E-08003 Barcelona l Tel +34 93 316 04 00 l Fax +34 93 316 06 35 l www.creal.catThe public health benefits of reducing air pollution in the Barcelona metropolitan area As further elaborated in the discussion, the concept of ‘attributable death’, while a useful approximation in the short term of a couple of years, is not appropriate to express the long-term benefits of pollution reduction simply by multiplying the results of this study by the number of future years. This is due to the fact that death is ultimately not ‘preventable’ but can only be postponed through prevention of morbidities. Thus, change of the life expectancy and the estimation of years of life lost due to pollution are more appropriate to quantify the long- term benefits of interventions. This is especially relevant to estimate long-term monetary benefits of air pollution reduction strategies. In summary, the study shows that improvement of air quality in the Barcelona metropolitan area to comply with current EU standards or with the more stringent standards recently proposed by WHO is expected to have substantial immediate as well as long-term health benefits for the people living in Barcelona area. Centre de Recerca en Epidemiologia Ambiental 9 Doctor Aiguader, 88 l E-08003 Barcelona l Tel +34 93 316 04 00 l Fax +34 93 316 06 35 l www.creal.cat
The public health benefits of reducing air pollution in the Barcelona metropolitan area

1. Introduction

1.1 Air pollution and health
Experimental studies conducted in cellular systems, animals, as well as humans
and a large number of epidemiological studies have shown that the current levels
of ambient anthropogenic air pollution lead to morbidity and mortality in humans
[1]. The acute effects of air pollution, i.e. effects that occur within hours or days
of exposure, are particularly well investigated with several studies conducted in
Spain [2, 3]. Depending on the frailty and susceptibility of subjects, the acute
effects of current levels of ambient pollution range from minor annoyance,
reduction of pulmonary function, or mild respiratory symptoms to more severe
respiratory as well as cardiovascular effects such as the exacerbations of asthma
attacks or chronic bronchitis, or the triggering of arrythmias, myocardial infarction
and strokes. Due to these more severe effects it has been shown that doctors
visits, emergency room visits and hospital admissions all increase on days with
higher pollution. The most severe effects of air pollution relate to death. Mortality
rates gradually increase as air quality deteriorates. Because these effects occur
not only during severe air pollution episodes but at all levels of pollution, there is
no evidence for ‘safe levels’ of air pollution. The every-day long-term exposure to
air pollution also contributes to chronic pathophysiologic changes and chronic
diseases which ultimately lead to reduced life expectancy. Several cohort studies,
both from the United States (US) and Europe confirm that current levels of air
pollution reduce life expectancy and effects are particularly strong for
cardiovascular mortality and lung cancer [4]. An increasing number of studies also
suggest that people living very close to busy streets experience additional adverse
health effects, including asthma, and death [5, 6].
Open questions remain and are subject to intense international research. These
include investigations of the mechanisms that cause the observed health effects
and the characterization of the toxicologically most relevant constituents and
sources. However, numerous experimental studies already confirm a role of
several pathophysiologic pathways that ultimately cause the observed effects [7].
Thus, evidence for a causal adverse role of air pollution has substantially
increased in the past years and the use of evidentiary data in risk assessments
has become increasingly prevalent.

1.2 Air pollution in Barcelona and surrounding areas
Air quality, namely particulate matter (PM) and nitrogen dioxide (NO2), in
Barcelona and surrounding areas is poor. Trends in the recent years show a
degradation of the situation [8]. The concentrations of these pollutants largely
exceed standards developed to protect public health and adopted in other regions
such as the US, the State of California, and several European countries. Pollution
levels also regularly exceed the air quality guidelines recommended by the World
Health Organization (WHO) to protect public health [9]. For example, in the city of
Barcelona, in 2004, the annual mean concentration of particulate matter with a
diameter below 10 µm (PM10) was 49 µg/m3 (average of six existing fixed
monitors), 45 µg/m3 in 2005, and 50 µg/m3 in 2006, when the recommended
WHO annual mean air quality guideline is 20 µg/m3. The annual mean at each of
the six monitors exceeded this value as well. To put this in context, Table 1.1
presents the annual mean PM10 for Barcelona compared to levels in other cities
around the world as provided in the WHO air quality guideline report [9].
Several epidemiological studies have shown evidence of the adverse effects of air
pollution on the population of Barcelona. For example, short-term exposure to
high levels of air pollution increased the risk of mortality in populations with pre-

Centre de Recerca en Epidemiologia Ambiental                                                            10
Doctor Aiguader, 88 l E-08003 Barcelona l Tel +34 93 316 04 00 l Fax +34 93 316 06 35 l www.creal.cat
The public health benefits of reducing air pollution in the Barcelona metropolitan area

existing chronic diseases [10]. The very high traffic density coupled with an
unusually high density of inhabitants and street canyons suggests that the health
impact of air pollution and specifically traffic related pollution may be a
particularly serious problem in the area.
There is currently a large effort conducted by regulatory authorities in Barcelona
and surroundings to reduce air pollution. A first step in this effort is the
development of a mitigation plan to reduce air quality levels to standards
legislated in the European Union (EU), specifically directive 1999/30/CE that
regulates limit values for NO2 and PM10 in ambient air that are regularly exceeded.
The annual mean limits for NO2 and PM10 are currently set to 40 µg/m3. While this
limit is far less stringent than the standards recommended by the scientific
community and the recently published air quality guidelines of WHO to protect
public health, reduction to these levels is a very important first step for all those
European cities with severe problems of air quality. Under the EU directive,
member states shall take the measures necessary to ensure that NO2 limit value
of 40 µg/m3 (annual mean) is not exceeded by 2010. The limit values for PM10 of
40 µg/m3 (annual mean) should have been met since the 1st of January 2005. In
October 2006, the Council of the EU agreed on a new draft directive on ambient
air quality and cleaner air for Europe that has been sent to the European
Parliament for second lecture. The new draft maintains a mean annual limit value
of 40 µg/m3 for PM10 with a maximum of 35 daily exceedances per year of 50
µg/m3. The draft also introduces PM2.5, particles with diameter inferior to 2.5
micrometers, in the legislation with a mean annual limit of 25 µg/m3 to be met in
2015 with a reduction of 20% PM2.5 annual levels from the means 2008-2010 to
2018-2020. The new WHO guidelines recommend a PM2.5 annual mean of 10
µg/m3, while the US National Air Quality Standards is set at 15 µg/m3 and the
California standard to 12 µg/m3. In 2005, all the new draft limit and target values
were exceeded in Barcelona. For example PM2.5 daily levels ranged from 25 to 35
µg/m3 at three locations (L’Hospitalet, Sagrera, Diagonal avenue) from 1999-
2006. [11-13]. PM2.5 is not yet regularly monitored in the Barcelona metropolitan
area.

Table 1.1. Annual average PM10 concentrations observed in selected cities worldwide
 Continent                City                      Annual average PM10 concentrations (µg/m3)
 Asia                     New Delhi                                        160
                          Seoul                                            60
                          Tokyo                                             30
 Latin America            Lima                                             110
                          Mexico City                                      55
                          Sao Paulo                                         49
 Africa                   Cairo                                            150
                          Cape town                                        25
 Europe                   Prague                                           60
                          Barcelona                                        55
                          Roma                                             55
                          Oslo                                             45
                          London                                           25
                          Stockholm                                         20
 North America            San Diego                                        50
                          Los Angeles                                      48
                          New York city                                     25
Source: [9] WHO. Air quality guidelines. Global update 2005.

Centre de Recerca en Epidemiologia Ambiental                                                            11
Doctor Aiguader, 88 l E-08003 Barcelona l Tel +34 93 316 04 00 l Fax +34 93 316 06 35 l www.creal.cat
The public health benefits of reducing air pollution in the Barcelona metropolitan area 1.3 Evaluating the public health impact of air pollution Scientists and public health agencies have increasingly engaged in the assessment of the public health impact of ambient air pollution. Such assessments consist of the translation of research findings into a rough quantification of the total health problem in a given region, country, or city that may be attributable to air pollution. They can also serve as a rough quantification of the likely benefits to public health of policies to reduce air pollution. Such translational work is very effective to inform the policy makers and the public about the approximate size of the problem. Although individual effects of air pollution are in general rather small –i.e. smaller than the effects of active smoking– the public health impact of air pollution can be rather substantial. The reason for this paradox stems from the fact that the whole population is exposed to air pollution, at least to some degree, whereas only a minority of the population are active smokers. Moreover, air pollution is often high in the most densely populated areas, thus the overall health burden is further increased. The methods of the air pollution impact assessment have been developed during the last 15 years [14]. The methods have been discussed in WHO committees leading to recommendations by experts. Governmental agencies in the United Kingdom and other European countries as well the US and Californian Environmental Protection Agency (EPA) employ these methods regularly, and a committee of the US National Academy of Science approved the general approaches. Health Impact Assessments (HIA) for air pollution have been applied to various geographic scales ranging from rough global assessments to more sophisticated international, national or local studies. Several HIAs have recently been conducted in Europe for which different estimates of the burden of air pollution were provided for Spain and/or for the city of Barcelona. All of these studies show that the overall health burden attributable to air pollution arises principally from effects on mortality in adults of long-term exposure to particulate matter. One of the first HIA conducted in Europe was the “trinational study” [15]. This study estimated the impact of outdoor and traffic-related air pollution on public health in Austria, France, and Switzerland. The study found that air pollution caused 6% of total mortality or more than 40,000 attributable cases per year. About half of all mortality caused by air pollution was attributed to motorized traffic, accounting also for: more than 25000 new cases of chronic bronchitis (adults), more than 290,000 episodes of bronchitis (children), more than 0.5 million asthma attacks, and more than 16 million person-days of restricted activities. Another HIA is the Air Pollution and Health: A European Information System (APHEIS) [16-18]. APHEIS was created in 1999 to provide policy and decision makers, environmental and health professionals, the general public and the media with resources on air pollution. The city of Barcelona is one of the city from the APHEIS network. The last evaluation of APHEIS, APHEIS-3, estimated that 11,000 premature deaths in Europe could be prevented annually if long-term exposure to PM2.5 was reduced to 20 µg/m3. The evaluation was based on a total population of almost 39 million inhabitants. Also it estimated that on average, life expectancy of a 30-year-old person could be prolonged, depending on the geographic area, by 2 to 13 months if PM2.5 concentrations did not exceed 15 µg/m3. a third HIA is the European Network of Health Information System (ENHIS) [19]. ENHIS is a methodological package dealing with the feasibility of HIAs for different environmental risk factors. For outdoor air pollution, the HIA aims to derive the number of health events that could be prevented from air pollution (PM10 and ozone) in different target populations (children, adults, elderly and general population) for different cities in Europe. For Barcelona, results were centered on death and hospital admissions due to ozone for the general population and infant Centre de Recerca en Epidemiologia Ambiental 12 Doctor Aiguader, 88 l E-08003 Barcelona l Tel +34 93 316 04 00 l Fax +34 93 316 06 35 l www.creal.cat
The public health benefits of reducing air pollution in the Barcelona metropolitan area

mortality due to PM10. In Barcelona, the HIA showed that each reduction by 10
µg/m3 of the daily 8-hour moving average concentrations of ozone would prevent
22 deaths per year in the general population, 11 from cardiovascular diseases,
and 9 from respiratory causes. In terms of hospital admissions, this decrease
would represent avoiding one respiratory admission in the adult population (15 to
64 years) and 21 in the population over 64 years. All other things being equal, the
reduction of the annual average levels of PM10 to 20 µg/m3 would prevent 0.45
total post neonatal deaths. Reducing PM10 daily mean values to 20 µg/m3 would
prevent 10 hospital respiratory admissions among children 15 or less. The
relatively small numbers of prevented cases obtained in this evaluation is due to
low ozone levels in Barcelona as well as very low infant mortality.
A fourth HIA is the Clean Air for Europe Cost-Benefit Analysis (CAFE-CBA) [20].
The aim of CAFE-CBA was to develop a long-term, strategic and integrated policy
advice to protect against significant negative effects of air pollution on human
health and the environment. CAFE-CBA estimated the health burden of outdoor air
pollution based on level of emissions projected to 2020 for all of Europe and by
member states with respect to different legislation policies. This HIA also provides
a cost-benefit analysis for change in emissions in Europe. CAFE-CBA estimated
that based on year 2000 levels and compared with current legislation, air pollution
caused about 22,000 premature deaths in Spain as well as other morbidity
diseases, which could represent per capita a total cost between 400 euros to
1,000 euros per year, depending on the method of calculation selected.
Following its Global Burden of Disease project, the WHO has recently provided
environmental burden of disease estimates by country for selected risk factors
including outdoor air pollution [21]. For Spain, the burden due to air pollution was
estimated to 5,800 deaths per year. This estimate assumed a reduction of the
levels of PM10 from a mean urban level of 30 µg/m3 to 20 µg/m3, the recent
recommended WHO limit value for PM10. This estimate only took into account
cities greater than 100,000 inhabitants, which represented in this estimate 42%
of a total population of 43.1 millions.
Although the health burden of air pollution in Spain and Barcelona has been
roughly estimated through these European studies, a detailed assessment has yet
to be conducted.

Centre de Recerca en Epidemiologia Ambiental                                                            13
Doctor Aiguader, 88 l E-08003 Barcelona l Tel +34 93 316 04 00 l Fax +34 93 316 06 35 l www.creal.cat
The public health benefits of reducing air pollution in the Barcelona metropolitan area

2. Objectives

This project conducts a health impact assessment (HIA) of air pollution for the
Barcelona metropolitan area.
The main objective of this study is to provide a first estimate of the
potential health benefit that would result from a stepwise improvement
of the air quality for the residents of this area. This study also presents
an estimate of the translation of some of these benefits into monetary
values.
The results of the study are expected to provide useful information to policy
makers and the public.

Centre de Recerca en Epidemiologia Ambiental                                                            14
Doctor Aiguader, 88 l E-08003 Barcelona l Tel +34 93 316 04 00 l Fax +34 93 316 06 35 l www.creal.cat
The public health benefits of reducing air pollution in the Barcelona metropolitan area

3. Methods

3.1 General framework
The general methodological framework of air pollution HIA has been described in
several reports and papers [14, 15, 22, 23]. It consists in the application of
methods used for decades to derive the risk attributable to specific risk factors
such as smoking. The attributable fraction is the fraction of a health problem that
can be attributed to a specific exposure (compared to a baseline exposure) or to a
change in exposure. If the total occurrence of a health problem is known in a
specific target population, attributable cases can then be derived for this
population. Under the assumption that none of the attributable cases would occur
in the absence of exposure, the attributable fraction is often referred to as the
“preventable burden”.
The main information required to estimate attributable cases consists of three
quantities, (1) the frequency of a health problem in the population, in other words
the number of events per year for that specific health problem (2) the level of
exposure to the risk factor in the population, and (3) the quantitative association
between exposure and the health outcome (the concentration-response function
or CRF).
In addition to these         quantities, the assessment of the health burden of air
pollution depends on         the definition of the study area, the choice of exposure
metrics, the selection        of health outcomes included in the assessment, and the
selection of “reference      levels”.

The following paragraphs detail the specific data and methodology used in this
evaluation in relation to these central issues.

3.2 Study area
The city of Barcelona is located on the central coast of Catalonia in the Northeast
of Spain but is part of a larger urban and industrial area extending several
kilometers to the north, west and south of the city. This extended area is
commonly referred to as the Barcelona metropolitan area. However, the precise
geographic extension of the Barcelona metropolitan area is not clearly established
and varies depending on local entities that refer to it. For this project, a
continuous geographic area constituted by 57 municipalities was selected as the
area of study. This area was selected for its geographical continuity and expected
similarity in terms of air pollution exposure. This area will be referred as the
Barcelona metropolitan area throughout the text, and refers to a wider definition
than defined by other entities. The municipality level reflects the smallest unit for
which data was available.

Figure 3.1 present the study area in relation to its regional geographic location.
Table 3.1 presents the distribution of the population for the 57 municipalities
included in the area of study.

Centre de Recerca en Epidemiologia Ambiental                                                            15
Doctor Aiguader, 88 l E-08003 Barcelona l Tel +34 93 316 04 00 l Fax +34 93 316 06 35 l www.creal.cat
The public health benefits of reducing air pollution in the Barcelona metropolitan area

Table 3.1. Population distribution in the 57 municipalities of the study area, year 2004
                                                                                            Population
                                                                Total        % of total
 Municipality                               Zip code                                           density
                                                           population        population
                                                                                             (hab/km2)
 Abrera                                      80018               9,422               0.24          471
 Badalona                                    80155             214,874               5.55        9,767
 Badia del Vallès                            89045              14,313               0.37       14,313
 Barberà del Vallès                          82520              27,202               0.70        3,400
 Barcelona                                   80193           1,578,546              40.80       15,785
 Canovelles                                  80410              14,001               0.36        2,000
 Castellar del Vallès                        80517              19,475               0.50          433
 Castellbisbal                               80543              10,352               0.27          334
 Castelldefels                               80569              53,964               1.39        4,497
 Cerdenyola del Vallès                       82665              56,065               1.45        1,809
 Cervelló                                    80689               6,980               0.18          233
 Corbera de Llobregat                        80728              11,278               0.29          627
 Cornellà de Llobregat                       80734              83,327               2.15       11,904
 El Papiol                                   81580               3,628               0.09          403
 El Prat de Llobregat                        81691              63,148               1.63        2,037
 Esplugues de Llobregat                      80771              45,915               1.19        9,183
 Gavà                                        80898              43,242               1.12        1,395
 Granollers                                  80961              56,456               1.46        3,764
 Hospitalet de Llobregat                     81017             250,536               6.48       20,878
 La Llagosta                                 81056              12,944               0.33        4,315
 Lliçà d'Amunt                               81075              12,009               0.31          546
 Lliçà de Vall                               81081               5,696               0.15          518
 Martorell                                   81141              25,010               0.65        1,924
 Martorelles                                 81154               4,912               0.13        1,228
 Molins de Rei                               81234              22,496               0.58        1,406
 Mollet del Vallès                           81249              50,691               1.31        4,608
 Montcada i Reixac                           81252              30,953               0.80        1,346
 Montmeló                                    81350               8,724               0.23        2,181
 Montornès del Vallès                        81363              14,065               0.36        1,407
 Olesa de Montserrat                         81477              20,294               0.52        1,194
 Palau Solità i Plegamans                    81568              12,499               0.32          833
 Palma de Cervelló                           89058               2,881               0.07          524
 Parets del Vallès                           81593              15,912               0.41        1,768
 Pallejà                                     81574               9,746               0.25        1,218
 Polinyà                                     81672               5,855               0.15          651
 Ripollet                                    81803              33,605               0.87        8,401
 Rubí                                        81846              66,425               1.72        2,076
 Sabadell                                    81878             193,338               5.00        5,371
 Sant Adrià de Besos                         81944              32,921               0.85        8,230
 Sant Cugat del Vallès                       82055              65,061               1.68        1,355
 Sant Fost de Campsentelles                  82093               7,039               0.18          541
 Sant Quirze del Vallès                      82384              15,729               0.41          605
 Sant Viçenç dels Horts                      82634              26,477               0.68        2,942
 Santa Coloma de Cervelló                    82444               6,652               0.17          832
 Santa Coloma de Gramanet                    82457             116,503               3.01       16,643
 Santa Perpètua de Mogoda                    82606              20,844               0.54        1,303
 Sentmenat                                   82671               6,628               0.17          237
 Sant Andreu de la Barca                     81960              23,675               0.61        3,946
 Sant Boi de Llobregat                       82009              80,636               2.08        3,665
 Sant Climent                                82042               3,366               0.09          306
 Sant Feliu de Llobregat                     82114              41,954               1.08        3,496
 Sant Joan Despí                             82172              30,242               0.78        5,040
 Sant Just Desvern                           82212              14,910               0.39        1,864
 Terrassa                                    82798             189.212               4.89        2,703
 Torrelles de Llobregat                      82896               4.324               0.11          309
 Vallirana                                   82956              11,678               0.30          487
 Viladecans                                  83015              60,033               1.55        3,002
 TOTAL AREA                                    --           3,868,663                100        3,5481
Source: Institut d’Estadística de Catalunya, year 2004; 1. average population density.

Centre de Recerca en Epidemiologia Ambiental                                                             16
Doctor Aiguader, 88 l E-08003 Barcelona l Tel +34 93 316 04 00 l Fax +34 93 316 06 35 l www.creal.cat
The public health benefits of reducing air pollution in the Barcelona metropolitan area Figure 3.1. Geographical location in Catalonia (Spain) of the 57 municipalities included in the study area and referred to as the Barcelona metropolitan area throughout the text. 3.3 Population exposure 3.3.1 Marker of air pollution used in this project Air pollution is a complex mixture of often highly correlated constituents and pollutants. Epidemiological studies cannot disentangle the specific contribution of each component to health problems, and toxicological studies do not provide clear quantitative information about the dose-response of all pollutants and their interactions. Thus, health impact assessments of air pollution rely on epidemiological studies, using markers of air quality. It is not appropriate to separately assess the risk for several correlated pollutants and sum them up, as the total burden would be largely overestimated. It is widely recognized that adverse health effects of air pollution are associated with particulate matter (PM) especially. This study used PM10 as marker of air pollution because most studies reporting effects and used in this evaluation were based on PM10 exposure. although one study quantified the risk using the finer fraction of PM, namely PM2.5, and another used Total Suspended Particles (TSP), usually corresponding to particles up to a diameter of 30 or more micrometers. In the absence of complete epidemiological data for each and every size fraction of PM it is usually required to convert across the different size fractions. This project used - where needed - a conversion factor of 0.6, i.e. assuming that PM2.5 would reflect 60% of PM10 as used in previous studies [15]. This factor is similar to the ratio observed at monitoring stations in Barcelona [11-13]. There is strong evidence suggesting that ozone causes additional established health effects that are most likely independent from or synergistic with other pollutants, especially in summer. However, because the effects of ozone are acute and rather small at the prevailing concentrations of this urban area, the contribution of ozone to the total burden of urban air pollution is expected to be relatively non significant compared to the effect of PM10 and thus was not included in this evaluation. Effects of ozone on health for the city of Barcelona can be Centre de Recerca en Epidemiologia Ambiental 17 Doctor Aiguader, 88 l E-08003 Barcelona l Tel +34 93 316 04 00 l Fax +34 93 316 06 35 l www.creal.cat
The public health benefits of reducing air pollution in the Barcelona metropolitan area

found in the Barcelona local city report of ENHIS HIA [19]. Results show that a
decrease of the daily maximum 8-hour moving average concentrations of ozone of
10 µg/m3 would prevent about 20 deaths (95%CI: 10-40), and about 20 hospital
admissions for cardiovascular and respiratory diseases, per year. In this report,
24-hours ozone concentrations in Barcelona ranged most frequently during
summer between 30 and 50 µg/m3. The 8-hour mean WHO 2006 guideline value
for protecting human health is set to 100 µg/m3.
We emphasize that the use of a single marker of urban air pollution most likely
leads to an underestimation of benefits of air management plans because these
plans may reduce concentrations of several pollutants including NO2, NOx,
benzene and others with partly independent or synergistic effects on health.

3.3.2. Determination of population exposure
To derive attributable cases for a specific change in concentration it is necessary
to determine the level of exposure of the population before change occurs. In this
context, by “exposure” we mean background concentrations of PM10
representative of people’s residence. We consider the current levels as the point
of reference for future changes. Several approaches are available to determine
population exposures depending on the level of detail of the data available. The
crudest approach consists of the use of the annual mean value(s) as measured at
one monitor (selected as being ‘representative’ of a study area). A more
sophisticated approach consists of the use of modeled pollution surfaces, overlaid
to the population distributions, to derive the detailed estimates of the population
exposure distributions. Depending on the availability of the data, some studies
use intermediate methods.
In this evaluation, the population exposure was represented by an average
concentration that took into account the population of each municipality
(population-weighted average concentrations). Average concentrations were
obtained for specific age-groups. The baseline year for the assessment of ambient
concentrations was 2004, thus consistent with the year for which air quality data
and health outcome data were available. The age groups matched those used in
the guidelines studies that provide the concentration-response relationships
chosen in the evaluation (see section 3.4) and include all ages, 0-1 year, 0-15
years, ≥15 years, ≥25 years, and ≥30 years.

The PM10 average population-weighted concentrations were derived as follows.
First, an average concentration for the urbanized areas within each municipality
was calculated. The concentrations were extracted from a modeled PM10 surface
concentration map developed by the Catalonia department for the environment
(Departament de Medi Ambient i Habitatge de la Generalitat de Catalunya) [24].
This map was developed by applying different air dispersion models to predict
concentrations in the study area for different sources of PM10 emissions for 2004.
The surface map was validated with monitoring site locations. The concentration
surface map was constituted of a grid of 500mx500m (total 6095 cells). In total
we discarded 31 cells in the grid that presented concentrations at least twice as
high as concentrations in neighboring cells. Those concentrations were ignored in
the derivation of the population-weighted mean ambient concentration, thus
people living in these cells are assumed to be exposed to the population mean
level. The risk assessment is based on the total population, including these 31
cells. The concentration of cells located within an urbanized area of each
municipality was averaged to obtain a mean concentration for each municipality.
The map of urbanized areas was also developed by the Catalonia department of
environment (Departament de Medi Ambient i Habitatge de la Generalitat de
Catalunya) [8]. Grid-cells of the urbanized map that fell within two or more

Centre de Recerca en Epidemiologia Ambiental                                                            18
Doctor Aiguader, 88 l E-08003 Barcelona l Tel +34 93 316 04 00 l Fax +34 93 316 06 35 l www.creal.cat
The public health benefits of reducing air pollution in the Barcelona metropolitan area
municipalities were split. Finally, the age-specific population-weighted average
was obtained by multiplying the age-specific population of each municipality by
the municipality mean concentration divided by the total age-specific population
of the study area.
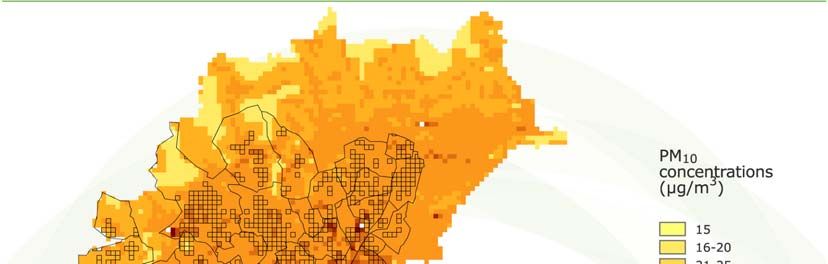
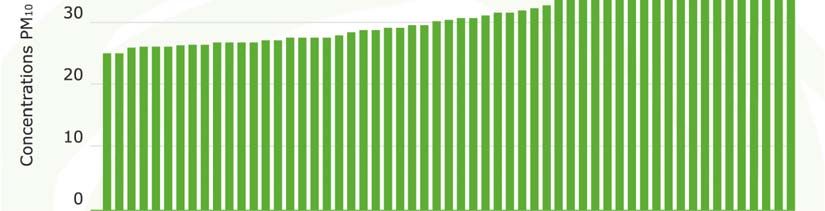
Table 3.2 shows the population weighted average used as representative exposure
concentration for the area under study. Figure 3.2 presents the superposition of
the concentration surface map on the urbanized areas. Graphic 3.1 presents the
average PM10 concentration for each municipality prior to weighting. It is
important to note that surface maps are the current basis for the evaluation of
clean air policies in the Barcelona area, supporting their use in this assessment.
Table 3.2. Population weighted exposure concentration used in HIA. Presented for
specific and partly overlapping age ranges that match the age groups used for the
different health outcomes (see section 3.4)
PM10 exposure
Population % of total concentration µg/m3
Age
(2004) population (population weighted
average)
0-1 38,630 0.999 49.0
0-15 520,850 13.5 49.2
≥15 3,347,813 86.5 50.3
≥25 2,897,272 74.9 50.4
≥30 2,532,824 65.4 50.4
ALL 3,868,663 100 50.1
Figure 3.2.
Modeled surface of the concentration of PM10 in the Barcelona metropolitan area for year 2004 [24].
Squares represent urbanized areas. The 57 municipalities contours are superposed to the surface map.
Centre de Recerca en Epidemiologia Ambiental 19
Doctor Aiguader, 88 l E-08003 Barcelona l Tel +34 93 316 04 00 l Fax +34 93 316 06 35 l www.creal.catThe public health benefits of reducing air pollution in the Barcelona metropolitan area Graphic 3.1. Average PM10 concentrations in urbanized areas of the 57 municipalities included in the study area 3.4 Health outcomes 3.4.1 Selection of outcomes Although the impact assessment attempts to reflect the total burden of air pollution on health, the assessment was restricted to those effects with the strongest or ‘best accepted’ evidence for a causal role of air pollution and for which there is availability of input data, such as existence of concentration- response function (CRF) and of prevalence or incidence data of the outcome among the target population. Moreover, the assessment is restricted to health outcomes that have been used in previous risk assessments in Europe and the US. For this evaluation, three main families of health outcomes were evaluated to represent the burden on health of air pollution in the Barcelona metropolitan area. These outcomes are mortality, morbidity including chronic diseases and asthma related symptoms, and health care use. The impact of air pollution on mortality is a combination of acute and cumulative effects [25]. For example, air pollution of a specific day may trigger myocardial infarction, stroke or deaths within the next few days or weeks (acute or sub-acute effects due to a short-term exposure). On the other hand, air pollution may support chronic disease processes leading to morbidities that contribute to the shortening of life. Studies investigating the effects on mortality of air pollution over long periods of time have shown that these cumulative effects are larger than those assigned to acute effects [26, 27]. This assessment provides estimates for both the acute effects on mortality due to short-term exposure and the chronic effects due to long-term exposure. We assume the long-term effects to reflect the total burden including the cumulated effects of acute insults. Thus, the estimates Centre de Recerca en Epidemiologia Ambiental 20 Doctor Aiguader, 88 l E-08003 Barcelona l Tel +34 93 316 04 00 l Fax +34 93 316 06 35 l www.creal.cat
The public health benefits of reducing air pollution in the Barcelona metropolitan area

for the acute effects will be expressed as a portion of the total. The outcome of
infant mortality (
The public health benefits of reducing air pollution in the Barcelona metropolitan area

Table 3.3. Baseline frequencies or number and concentration-response functions used
in Health Impact Assessment for the Barcelona Metropolitan Area.
                                             Population baseline                 PM10 Concentration-
                                             frequency/number                     Response function
 Outcome                          Age                                             Mean
                                           Number or
                                                                Source          (95%CI)           Source1
                                            percent
                                                                              per 10 µg/m3
 Mortality
                                                                                               Pooled
                                                              Catalonian
                                                                                               estimate
 Infant death                                                 mortality           1.048
The public health benefits of reducing air pollution in the Barcelona metropolitan area 3.4.2.1 Mortality and life expectancy Infant death The CRF used for infant mortality was based on a joint estimate derived from studies over the possible impact of ambient air pollution on the fetus and infants (less than 1 year) published between 1994-2003 [28]. A CRF estimate of 4.8% (95%CI: 2.2, 7.5) change in infant mortality per 10 µg/m3 change of PM10 has thus been used similarly as in the recent ENHIS HIA. Short-term effects on mortality As mentioned, the impact of air pollution on mortality is a combination of acute and cumulative effects. We present estimates for acute effects and consider them being part of the total cumulative effects described below, thus acute and long- term effects should not be summed. The CRF used for acute effects on mortality due to daily fluctuations in ambient concentrations of pollutants was derived from a quantitative meta-analysis of peer reviewed studies developed by the WHO on health effects and short-term exposure to particulate matter [27] derived from studies of 33 separate European cities and regions. Most of the estimates were taken from Air pollution and health: A European approach 2 (APHEA 2) study [31, 32] with Barcelona being one of the cities included. The meta-analysis provided estimate for total, cardiovascular and respiratory causes of deaths. For total effects, the CRF represents a 0.6% (95%CI: 0.4, 0.8) change in deaths per 10 µg/m3 change of PM10. We present estimates for all three outcomes but it should be emphasized that the cause-specific acute deaths are contained in the total. Long-term effects on mortality (adults≥30 years) For comparability purposes with other HIA in Europe (APHEIS-3), we selected a CRF derived from two US studies as proposed in the trinational HIA of Austria, France, and Switzerland [15]. These studies are known as the American Cancer Society (ACS) study [33] and the Harvard Six studies [34]. Both were based on cohorts that were broadly representative of the US population. The ACS study was based on PM2.5 metric, thus the CRF had to be converted to PM10 using the conversion factor discussed above. The combination of the results of both studies result in a CRF of 4.3% (95%CI: 2.6, 6.1) change in death per 10 µg/m3 change of PM10.The ACS study was recently re-analyzed by an expert panel [35] and analyses were extended [36] confirming the results previously obtained. To date, five European studies have investigated long-term effects of urban air pollution on mortality [37-41]. All five studies found positive associations between mortality and long-term exposure to traffic-related air pollution and confirmed estimates obtained from the two US cohort studies. The European studies used, however, partly different metrics of exposure, and a direct use of these estimates or meta- analytic pooling with the US studies was not considered for this phase of the project. Population frequencies The data for total mortality were obtained from the Catalonian mortality registry of the department of health (Departament de Salut de la Generalitat de Catalunya). Data was provided for each municipality for year 2004. Deaths related to violence and accidents were excluded. Gain in life expectancy Many risk assessments provide estimates of attributable deaths which is a very common approach used for other exposures, in particular to express the burden due to smoking. If we assume that a policy decreases air pollution as of January Centre de Recerca en Epidemiologia Ambiental 23 Doctor Aiguader, 88 l E-08003 Barcelona l Tel +34 93 316 04 00 l Fax +34 93 316 06 35 l www.creal.cat
You can also read