THE EFFECT OF SOIL AND CLIMATE ON THE CHARACTER OF SAUVIGNON BLANC WINE
←
→
Page content transcription
If your browser does not render page correctly, please read the page content below
THE EFFECT OF SOIL AND CLIMATE
ON THE CHARACTER OF SAUVIGNON BLANC WINE
KOBUS CONRADIE

ARC Fruit, Vine and Wine Research Institute, Nietvoorbij Centre for Vine and Wine.
Private Bag X5026, 7599 Stellenbosch, South Africa

Summary
* Substantial climatic différences occur between localities in the districts of Stellenbosch and
  Durbanville.
* In général, wines from coolest localities score the highestfor intensity and quality of aroma.
* In some cases wines from warmer localities score better than expected (adequate soil
  préparation, good canopy management).
* Wine from soils at the same locality show major différences.
* During dry summers wines from soils with higher water supplying capacities show highest
  aroma intensity, while the situation may be reversed during milder summers.
* Harmony exist between the textural nature/water regime of a soil and climate experienced
  during a spécifié season.

Résumé
Un projet multidisciplinaire sur l'effet du sol et du climat sur la qualité du vin a débuté en
Afrique du Sud il y a 5 ans. Des mesures sont effectuées sous culture sèche dans des vignes de
Sauvignon Blanc dans six localités différentes,     cinq dans le district de Stellenbosch et une à
Durbanville. Au moins deux types de sol différents sont présents dans chaque localité. Les
températures maximales moyennes en été varient de 28°C pour la localité la plus chaude à
25°C pour la plus froide. En général, les vins issus des localités les plus froides enregistrent
des résultats les plus élevés pour l'intensité et la qualité des arômes. Quelques fois des vins
issus de localités plus chaudes enregistrent cependant des résultats meilleurs que prévus.
Ceci est attribué à des pratiques adéquates de préparation des sols qui résultent dans une
bonne distribution des racines et une bonne gestion de la ramure. L'état hydrique des sols à la
même localité montre des différences majeures malgré des sites d'expérimentation souvent
éloignés de moins de 50 m l'un de l'autre. Ceci résulte dans de forts stress hydriques pour les
vignes situées sur des sols qui ont une faible capacité hydrique. Les profils aromatiques des
vins issus de différents sols à la même localité montrent aussi par conséquent des différences
majeures. Les résultats mettent en évidence l'harmonie entre la nature de la texture/régime
hydrique du sol et le climat de la saison. Une performance suSpérieure au cours d'une saison
n est pas nécessairement répétée la saison suivante.

                                             1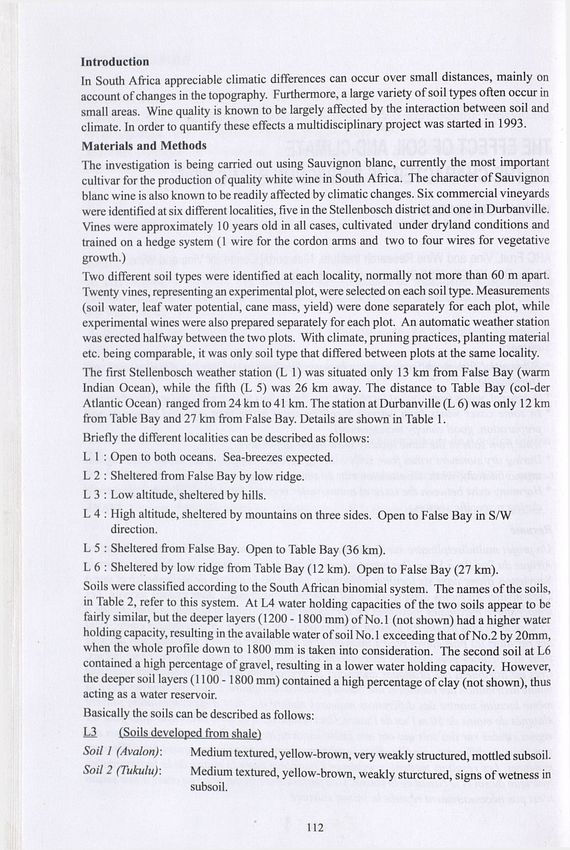
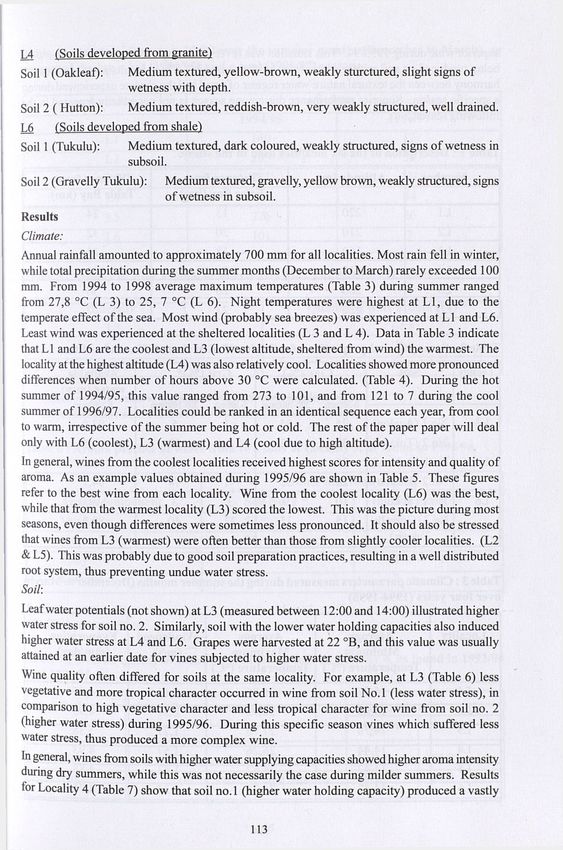
Introduction
In South Africa appréciable climatic différences can occur over small distances, mainly on
account of changes in the topography. Furthermore, a large variety of soil types ofïten occur in
small areas. Wine quality is known to be largely affected by the interaction between soil and
climate. In order to quantify these effects a multidisciplinary project was started in 1993.
Materials and Methods
The investigation is being carried out using Sauvignon blanc, currently the most important
cultivar for the production of quality white wine in South Africa. The character of Sauvignon
blanc wine is also known to be readily affected by climatic changes. Six commercial vineyards
were identified at six différent localities,five in the Stellenbosch district and one in Durbanville.
Vines were approximately 10 years old in ail cases, cultivated under dryland conditions and
trained on a hedge system (1 wire for the cordon arms and two to four wires for vegetative
growth.)
Two différent soil types were identified at each locality, normally not more than 60 m apart.
Twenty vines, representing an experimental plot, were selected on each soil type. Measurements
(soil water, leaf water potential, cane mass, yield) were done separately for each plot, while
experimental wines were also prepared separately for each plot. An automatic weather station
was erected halfway between the two plots. With climate, pruning practices, planting material
etc. being comparable, it was only soil type that differed between plots at the same locality.
The first Stellenbosch weather station (L 1) was situated only 13 km from False Bay (warm
Indian Océan), while the fifth (L 5) was 26 km away. The distance to Table Bay (col-der
Atlantic Océan) ranged from 24 km lo 41 km. The station at Durbanville (L 6) was only 12 km
from Table Bay and 27 km from False Bay. Détails are shown in Table 1.
 Briefly the différent localities can be described as follows:
 L 1 : Open to both océans. Sea-breezes expected.
L 2 : Shelteredfrom False Bay by low ridge.
 L 3 : Low altitude, sheltered by hills.
L 4 : High altitude, sheltered by mountains on three sides. Open to False Bay in S/W
      direction.
L 5 : Shelteredfrom False Bay. Open to Table Bay (36 km).
L 6 : Sheltered by low ridgefrom Table Bay (12 km). Open to False Bay (27 km).
Soils were classified according to the South African binomial system. The names of the soils,
in Table 2, refer to this system. At L4 water holding capacities of the two soils appear to be
fairly similar, but the deeper layers (1200 - 1800 mm) ofNo.l (not shown) had a higher water
holding capacity, resulting in the available water ofsoil No.l exceeding that ofNo.2 by 20mm,
when the whole profile down to 1800 mm is taken into considération. The second soil at L6
contained a high percentage of gravel, resulting in a lower water holding capacity. However,
the deeper soil layers ( 1100 -1800 mm) contained a high percentage of clay (not shown), thus
acting as a water reservoir.
Basically the soils can be described as follows:
L3     (Soils developedfrom shale-)
Soil 1 (Avalon) :        Médium textured, yellow-brown, very weakly structured, mottled subsoil.
Soil 2 (Tukulu):        Médium textured, yellow-brown, weakly sturctured, signs of wetness in
                       subsoil.

                                                1
L4     (Soils developed from granité)
Soil 1 (Oakleaf):     Médium textured, yellow-brown, weakly sturctured, slight signs of
                     wetness with depth.
Soil 2 ( Hutton):    Médium textured, reddish-brown, very weakly structured, well drained.
L6      (Soils developedfrom shale)
Soil 1 (Tukulu):       Médium textured, dark coloured, weakly structured, signs of wetness in
                      subsoil.
Soil 2 (Gravelly Tukulu): Médium textured, gravelly, yellow brown, weakly structured, signs
                              of wetness in subsoil.
Results
Climate:
Annual rainfall amounted to approximately 700 mm for ail localities. Most rain fell in winter,
while total précipitation during the summer months (December to March) rarely exceeded 100
mm. From 1994 to 1998 average maximum températures (Table 3) during summer ranged
from 27,8 °C (L 3) to 25, 7 °C (L 6). Night températures were highest at Ll, due to the
temperate effect of the sea. Most wind (probably sea breezes) was experienced at Ll and L6.
Least wind was experienced at the sheltered localities (L 3 and L 4). Data in Table 3 indicate
that Ll and L6 are the coolest and L3 (lowest altitude, shelteredfrom wind) the warmest. The
locality at the highest altitude (L4) was also relatively cool. Localities showed more pronounced
différences when number of hours above 30 °C were calculated. (Table 4). During the hot
summer of 1994/95, this value ranged from 273 to 101, and from 121 to 7 during the cool
summer of 1996/97. Localities could be ranked in an identical sequence each year,from cool
to warm, irrespective of the summer being hot or cold. The rest of the paper paper will deal
only with L6 (coolest), L3 (warmest) and L4 (cool due to high altitude).
In général, winesfrom the coolest localities received highest scores for intensity and quality of
aroma. As an example values obtained during 1995/96 are shown in Table 5. These figures
refer to the best wine from each locality. Wine from the coolest locality (L6) was the best,
while thatfrom the warmest locality (L3) scored the lowest. This was the picture during most
seasons, even though différences were sometimes less pronounced. It should also be stressed
that winesfrom L3 (warmest) were often better than thosefrom slightly cooler localities. (L2
& L5). This was probably due to good soil préparation practices, resulting in a well distributed
root system, thus preventing undue water stress.
Soil:
Leaf water potentials (not shown) at L3 (measured between 12:00 and 14:00) illustrated higher
water stress for soil no. 2. Similarly, soil with the lower water holding capacities also induced
higher water stress at L4 and L6. Grapes were harvested at 22 °B, and this value was usually
attained at an earlier date for vines subjected to higher water stress.
Wine quality often differed for soils at the same locality. For example, at L3 (Table 6) less
vegetative and more tropical character occurred in wine from soil No. 1 (less water stress), in
comparison to high vegetative character and less tropical character for wine from soil no. 2
(higher water stress) during 1995/96. During this spécifié season vines which suffered less
water stress, thus produced a more complex wine.
In général, winesfrom soils with higher water supplying capacities showed higher aroma intensity
during dry summers, while this was not necessarily the case during milder summers. Results
for Locality 4 (Table 7) show that soil no. 1 (higher water holding capacity) produced a vastly

                                              1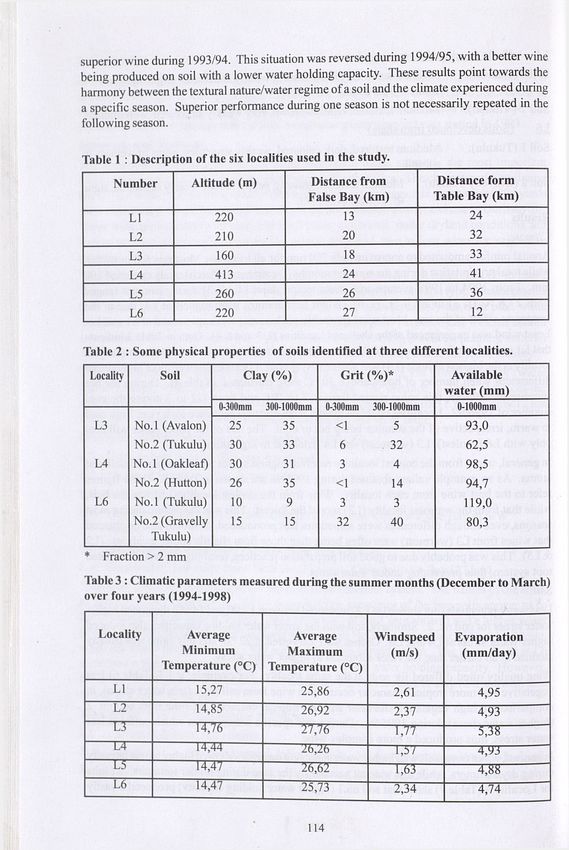
superior wine during 1993/94. This situation was reversed during 1994/95, with a better wine
being produced on soil with a lower water holding capacity. These results point towards the
harmony between the textural nature/water regime of a soil and the climate experienced during
a spécifié season. Superior performance during one season is not necessarily repeated in the
following season.

Table 1 : Description of the six localities used in the study.
         Number           Altitude (m)             Distance from               Distance form
                                                   False Bay (km)             Table Bay (km)
              L1               220                       13                          24
              L2               210                       20                          32
              L3               160                        18                        33
              L4               413                       24                         41
              L5               260                         26                       36
              L6               220                         27                       12

Table 2 : Some physical properties of soils identified at three différent localities.
 Locality          Soil                Clay (%)           Grit (%)*             Available
                                                                               water (mm)
                               0-300mm    300-1000mm   0-300mm   300-1000mm      O-lOOOmm
    L3        No.l (Avalon)       25         35
Table 4 : Number of hours > 30 °C over the summer months (December to March), as
measured during a hot (1994/95) and a cool (1996/97) season.
Locality Season
1994/95 1996/97
L1 140 17
L2 205 53
L3 273 121
L4 228 44
L5 226 60
L6 101 7
Table 5 : Quality of wine aroma, as affected by différent localities (1995/96)*
Locality Quality of wine aroma (%) **
L3 64,8
L4 72,2
L6 79,5
* Values in Table refer to the best wine from each locality.
** Expérimental wines evaluated by a panel of at least 14 judges.
Table 6 : Aroma profiles of wines from two soils at Locality 3, as found in 1995/96.
Aroma distribution (%)
Aroma component Soil No. 1 * Soil No. 2 **
Vegetative 52 68
Tropical 32 19
Spicy 2 2
Caramel 7 3
* Lower water stress
** Higher water stress
Table 7 : Overall quality of wines form différent soils at Locality 4, as found in 1993/94
and 1994/95.
Soil Description Wine quality (%)
1993/94 1994/95
No.l Highest water holding capacity 62,2 59,0
No.2 Lowest water holding capacity 48,9 64,4
115You can also read