The effect of Co substitution on the Raman spectra of pyrite: potential as an assaying tool
←
→
Page content transcription
If your browser does not render page correctly, please read the page content below
Eur. J. Mineral., 34, 259–274, 2022
https://doi.org/10.5194/ejm-34-259-2022
© Author(s) 2022. This work is distributed under
the Creative Commons Attribution 4.0 License.
The effect of Co substitution on the Raman spectra of pyrite:
potential as an assaying tool
Khulan Berkh and Dieter Rammlmair
Federal Institute for Geosciences and Natural Resources, Stilleweg 2, 30655 Hanover, Germany
Correspondence: Khulan Berkh (khulan.berkh@bgr.de)
Received: 2 December 2021 – Revised: 4 March 2022 – Accepted: 21 March 2022 – Published: 14 April 2022
Abstract. The textural appearance of Co-bearing pyrite was visualized by a mapping method using a Raman
microprobe. Two out of five Raman active modes (Eg and Ag ) of pyrite were evaluated here. The obtained
Raman map tightly correlates with a Co distribution map revealed by electron microprobe. Both Eg and Ag
modes gradually downshift and broaden with increasing Co concentration. The broadening and shifting of the
Ag mode is stronger compared to the Eg mode. Especially the intensity of the Ag mode drastically drops and
diminishes in comparison to the Eg mode. Both 532 and 633 nm lasers revealed the same variation in position
and width of the Eg and Ag modes. Only the intensity ratio of the modes differed because of an energy-dependent
resonance scattering from the Ag mode. The 1064 nm laser was unsuitable since the Raman scattering intensity
is inversely proportional to wavelength. Furthermore, highly broadened Raman modes at upshifted frequencies
caused by the standard mechanical polishing could be avoided by analyzing cut or polished samples with a broad
ion beam.
1 Introduction and accordingly spatial distribution of target metals within
the deposit. However, such textures based on small chemi-
Fast appraisal of high value metal distribution within sulfides cal heterogeneities, for example resulting from Co, cannot
is important in all the exploration, selective mining, and pro- be distinguished by many standard methods or can only be
cessing sides of the mineral industry. In Chile, small-scale recognized with considerable effort. Thus, we test a Raman
mining is often related to mineral treatment and melting fa- technique on Co-bearing pyrite focusing on the most suit-
cilities of ENAMI, a state company providing small-scale able setting for its possibly fast and accurate identification
miners a selling platform for their products with the main fo- and textural characterization, as well as quantitative estima-
cus on Cu, Mo, Au, and Ag . Since hundreds of small mines tion of Co concentration.
deliver their ores to ENAMI, valuable metals such as Co, en- An old mine tailings dump of Delirio mine located 6 km
riched in one or the other mine site, are diluted by mixing south of Punitaqui in north-central Chile was geochemically
with other sources rather than extracted and consequently de- and mineralogically investigated for its economic potential
posited in tailings dumps. Thus, assaying ore from different and environmental impact (Berkh et al., 2019). Delirio mine
sources prior to crushing and subsequent separation of Co- exploited mainly Cu and subsidiary Au (3 g t−1 ) ore during
rich ore before mixing with common pyrites would help to the first half of the 20th century (Sillitoe and Thompson,
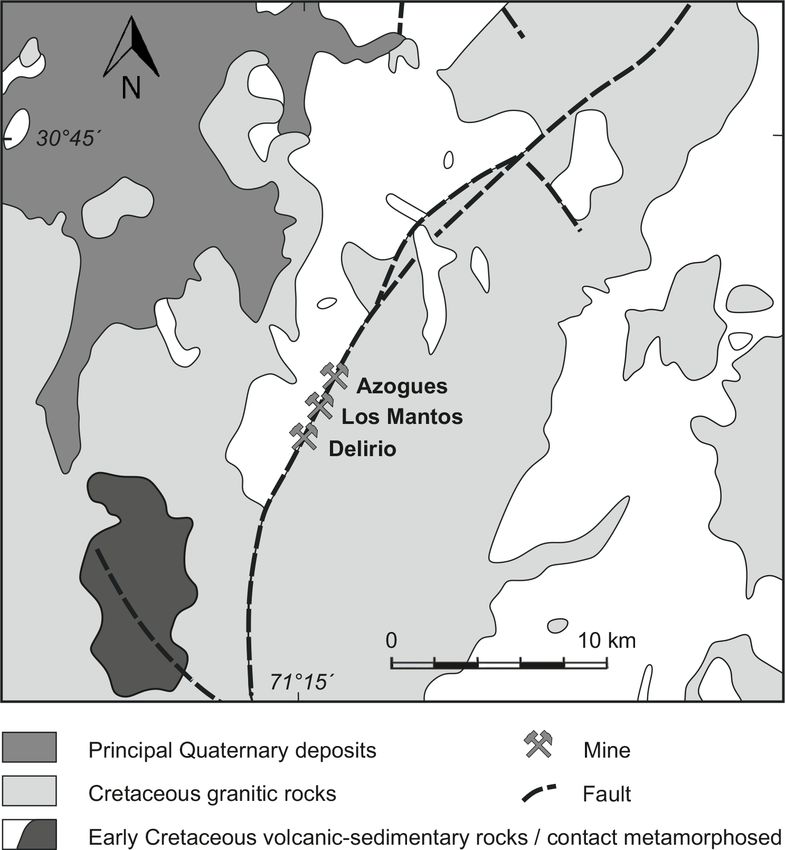
sell the concentrates enriched in Co to prospective buyers. 1998; Goodwin et al., 2018). Geologically, Delirio mine is
Recovery from tailings, in which both Co-rich and Co-free situated in the southern part of the Mantos de Punitaqui vein
pyrites are mixed together, would only be possible due to that is some 4.5 km long and 4 m wide, and it extends ver-
localizing zones of Co-rich pyrites in the sense of selective tically > 300 m. The vein is hosted by a north-striking and
mining by screening methods. steeply dipping fault in Mesozoic Coastal Batholith, a calc-
More importantly, internal textures such as chemical zon- alkaline, I type, and magnetite-series suite (Fig. 1).
ing, overgrowth, and brecciation of the mineral of economic Unfortunately, the mineralogy of the Delirio mine is
interest provide valuable information regarding ore genesis hardly known. In contrast, the mineralogy of the Los Man-
Published by Copernicus Publications on behalf of the European mineralogical societies DMG, SEM, SIMP & SFMC.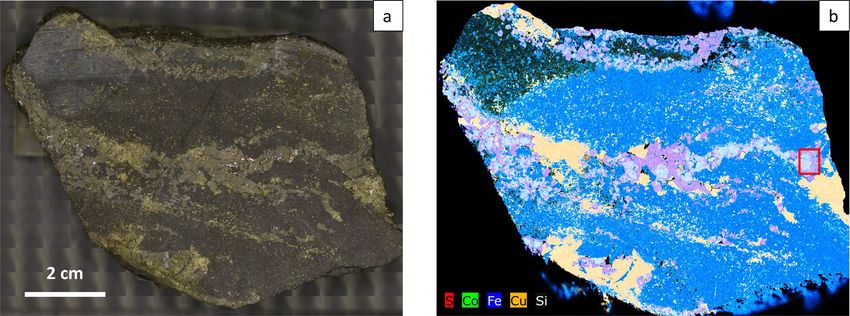
260                            K. Berkh and D. Rammlmair: The effect of Co substitution on the Raman spectra of pyrite

                                                                    with Fe Kβ (7.06 KeV) caused by the low spectral resolu-
                                                                    tions of the instruments (145 eV in µ-EDXRF and 130 eV
                                                                    in SEM at Mn Kα) in the case of low Co concentrations.
                                                                    A longer acquisition time (10 instead 2 ms per pixel) pro-
                                                                    vides distinct Co signals even at small grain sizes but no
                                                                    sharp spatial distribution due to the beam size and sam-
                                                                    pling depth. Only an electron probe microanalyzer (EPMA)
                                                                    with wavelength-dispersive spectrometry showed that Co is
                                                                    associated with pyrite. However, the EPMA needs a time-
                                                                    consuming sample preparation; thus, it has a long turnaround
                                                                    time for information. Therefore, we tested Raman micro-
                                                                    probe analyses to distinguish Co-bearing pyrite from pure
                                                                    pyrite to obtain quick results.
                                                                       The laser Raman microprobe is a non-destructive and pre-
                                                                    cise method for identification of minerals with a size down
                                                                    to less than 1 µm and can be applied even to samples with
                                                                    rough surfaces. The Raman shift, intensity, width, and num-
                                                                    ber of the Raman bands depend on the nature of the atomic
                                                                    species in the sample and the bond forces between these
                                                                    atoms, as well as the symmetry of their arrangement in the
                                                                    crystal structure. Thus, Raman spectra are unique to a certain
                                                                    type of crystal and can be used to identify samples with un-
                                                                    known mineralogy (Nasdala et al., 2004). Accordingly, mod-
Figure 1. Geological map of the Mantos de Punitaqui district,       ifications of Raman spectra also enable a further character-
northern Chile, showing control of the vein by major arc-parallel   ization such as structural defect, impurity, degree of crys-
fault along pluton contact (modified based on Sillitoe and Thomp-   tallinity, internal stress, and crystal orientation of the sample
son, 1998).
                                                                    being analyzed (Foucher et al., 2017). Since spectra provided
                                                                    by Raman analysis certainly indicate the bonding and sym-
                                                                    metry of the mineral structure, polymorphs, e.g., andalusite–
tos mine, located in the central part of the Mantos de Puni-        sillimanite–kyanite (Mernagh and Liu, 1991), coesite–α-
taqui vein (Fig. 1) and representing the Au-rich part of the        quartz (Nasdala et al., 2004), and pyrite–marcasite (White,
system, is well studied. The mineralogy consists mainly of          2008), can be distinguished. In comparison to instruments
quartz, calcite, specular hematite, magnetite, chalcopyrite,        based on electrons or X-ray, Raman spectroscopy can char-
and pyrite. The Azogues mine located in the northern part           acterize phases containing light elements such as Li miner-
of the vein, in turn, exploited mercury. All three deposits in      als (Brooker and Wang, 1992; Anderson et al., 2001). Due
the Mantos de Punitaqui vein can be considered iron oxide–          to the ability of the laser’s penetration into the transparent
copper–gold (IOCG) deposits due to their mineralogical and          medium, daughter minerals (precipitated from the fluid af-
genetic similarity to the world-class IOCG deposits in north-       ter being trapped) in fluid inclusions can also be identified
central Chile including Punta del Cobre, Candelaria, and            (Mernagh and Trudu, 1993; Kodera et al., 2003).
Manto Verde (Sillitoe and Thompson, 1998). Accordingly,                A group theory treatment of the lattice vibrations in pyrite
the main ore minerals in the studied tailings were chalcopy-        predicted five Raman active modes including Ag , Eg , and 3Tg
rite, pyrite, magnetite, and hematite (Berkh et al., 2019),         (Lutz and Willich, 1974). However, three modes including
pointing to the IOCG deposit as the most probable source.           Ag , Eg , and one Tg (3) were observed in most studies (Ush-
   The previously studied tailings exhibited a high bulk Co         ioda, 1972; Macfarlane, 1974; Mernagh and Trudu, 1993;
content with a mean of 845 ppm and a median of 762 ppm.             Hope et al., 2001; White, 2008; Pačevski et al., 2008; Kin-
Pyrite was expected to host Co because bulk Co concen-              ner et al., 2016; Bryant et al., 2018; Feng et al., 2019; Zhu et
trations in subsamples obtained by heavy mineral extraction         al., 2020). Only Vogt et al. (1983) resolved all five modes.
were directly proportional to the amount of pyrite in the sub-      Kleppe and Jephcoat (2004) and Yuan and Zheng (2015)
samples. Back-scattered electron analysis revealed homoge-          measured four out of five modes. The totally symmetric Ag
neous images of pyrite even at the setting of maximum con-          mode is caused by a stretching vibration of the dumbbell
trast due to minimal density contrasts of Fe and Co. The ap-        S–S bond. The doubly degenerate Eg mode is induced by
plied energy dispersive systems including a micro-energy-           a libration motion of S displaced perpendicular to the S–S
dispersive X-ray fluorescence microscope (µ-EDXRF) and              bond axis. The triply degenerate Tg mode involves various
scanning electron microscope (SEM) were not accurate                stretching and libration modes (Sourisseau et al., 1991). The
enough. The reason is an overlapping of Co Kα (6.93 KeV)            stretching mode Ag is largely determined by the S–S force

Eur. J. Mineral., 34, 259–274, 2022                                                    https://doi.org/10.5194/ejm-34-259-2022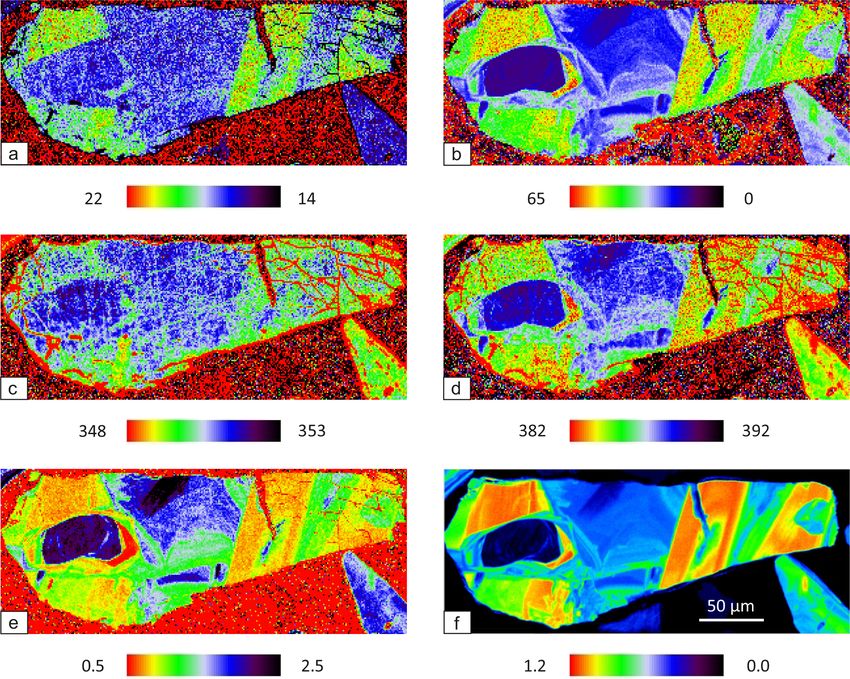
K. Berkh and D. Rammlmair: The effect of Co substitution on the Raman spectra of pyrite                                     261

constant, whereas the librational mode Eg and the coupled li-     200 ppm), Fe (Kα, 10 s, pyrite, 350 ppm), Co (Kα, 60 s,
brational and stretching mode Tg are mainly governed by the       cobaltite, 90 ppm), Ni (Kα, 60 s, pentlandite, 100 ppm), Cu
Fe–S force constant (Lutz and Zwinscher, 1996).                   (Kα, 30 s, chalcopyrite, 160 ppm), As (Lα, 130 s, cobaltite,
   General Raman studies on pyrite were published by a            110 ppm), Sb (Lα, 40 s, stibnite, 160 ppm), and Cd (Lβ, 70 s,
number of authors (Ushioda, 1972; Macfarlane, 1974; Vogt          CdS, 220 ppm). For the semi-quantitative element distribu-
et al., 1983; Mernagh and Trudu, 1993; Hope et al., 2001;         tion maps, the same operating conditions were applied. The
White, 2008; Feng et al., 2019). A high-pressure Raman            beam size and dwell time were here 0.5 µm and 1 s, respec-
spectroscopic study of pyrite was carried out by Kleppe and       tively.
Jephcoat (2004). Yuan and Zheng (2015) also performed
high-pressure and high-temperature investigations of pyrite.      2.3   Laser Raman microprobe
Bryant et al. (2018) examined a variability in the pyrite spec-
trum due to laser heating and crystal orientation. However,       The pyrite grains were investigated by a Renishaw in-
effects of chemical impurity in pyrite on its Raman spectra       Via Qontor confocal µ-Raman system equipped with a Le-
have been barely investigated. Rare publications are studies      ica DM2700 microscope. For the polished sample an N
of Cu-bearing pyrite by Pačevski et al. (2008) and As-bearing    plan 100× objective lens with 0.85 numerical aperture and
pyrite by Zhu et al. (2020). Studies on Co-bearing pyrite are     0.27 mm working distance was used to collect scattered ra-
also scarce. Only a Raman spectrum for synthetic nanocrys-        diation from the sample. For the rough surface of the cut
tals of Co0.5 Fe0.5 S2 was recorded by Kinner et al. (2016). To   sample an automatic focus track mode and an N plan 20×
our knowledge, vibrational characterizations of Co-bearing        objective lens with 0.40 numerical aperture and 1.15 mm
natural pyrite have not been undertaken.                          working distance were applied. A continuous-wave diode-
                                                                  pumped solid-state (CW-DPSS) laser with a wavelength of
                                                                  532 nm and HeNe laser with a wavelength of 633 nm were
2     Material and analytical techniques                          used as the excitation source. Unpolarized spectra were
                                                                  recorded by a Renishaw Centrus 1873H8 detector with a
2.1    Sample
                                                                  charge coupled device (CCD) array of 1040 × 256 pixels us-
Analyzed samples were taken from a tailings dump by               ing a 1800 L mm−1 grating. The spectral resolutions are 1.27
drilling up to 7 m. Three drill core samples, M1, M3, and M5,     and 0.82 cm−1 for the 532 and 633 nm lasers, respectively.
were used in this study. Additionally, the sample “Corte” was     Different settings depending on sample, measurement, and
collected from the weathered slope of the heap. Generally,        laser types were applied and are listed in Table 1.
the samples M3 and M5 are less weathered than the samples            The instrument was calibrated by automatic alignment
M1 and Corte. Heavy minerals were extracted from the sam-         procedures of the software WiRE, including laser spot cor-
pled tailings using a shaking table. The extracted heavy min-     rection, slit, and CCD area alignments. The correctness of the
eral concentrates were embedded in epoxy resin, ground with       calibration was verified with 520.5 cm−1 band of an unpro-
diamond pulley wheel (45 and 15 µm), and polished with dia-       cessed (111) crystalline silicon wafer from First Sensor. The
mond paste (3 µm) on cloth. The measurements were always          verification is adequate because all Raman modes of pyrite
carried out on freshly polished and ethanol-cleaned surfaces.     occur between laser line and 520.5 cm−1 band of the stan-
After the cross-sections were studied, they were polished         dard silicon wafer.
with an Ar broad ion beam (BIB) and re-analyzed for a com-           The background was subtracted, and spikes caused by cos-
parison. Additionally, un-crushed primary rocks supposed to       mic ray events were filtered out from raw spectra. The spec-
contain Co were collected from a mining site in the vicin-        tral range of the map measurement was reduced to an area
ity. The rock samples were cut with a diamond-coated saw          relevant to the pyrite spectrum (250 to 500 Raman shifts per
blade without being polished to avoid a stressed surface be-      centimeter) to improve the curve fit procedure by avoiding
cause pyrite grains tend to splinter due to the pressure during   high fluorescence spectra from epoxy resin towards higher
cutting.                                                          wavenumbers. Position, intensity, and full width at half max-
                                                                  imum (FWHM) of the Raman bands were determined by the
2.2    EPMA                                                       curve fit function of the software. A combined Gaussian–
                                                                  Lorentzian band shape was fitted to the data to minimize the
Chemical compositions of pyrite were determined by a              chi-squared (χ 2 ) value that measures a goodness of fit.
field emission microprobe JEOL JXA-8530 F instrument us-
ing wavelength-dispersive spectrometry. The point measure-        2.4   µ-EDXRF
ments were acquired with a focused beam 0.5 µm in size, an
operating voltage of 20 kV, and a beam current of 40 nA. The      The element distribution map of the cut sample was acquired
measured elements and their specification (X-ray line, ac-        by a µ-EDXRF M4 Tornado from Bruker Nano Analytics.
quisition time, reference material used for calibration, and      A polychromatic excitation emitted by a Rh tube is focused
calculated detection limit) as follows: S (Kα, 10 s, pyrite,      through a polycapillary lens onto a spot size of 17 µm (at Mo

https://doi.org/10.5194/ejm-34-259-2022                                                   Eur. J. Mineral., 34, 259–274, 2022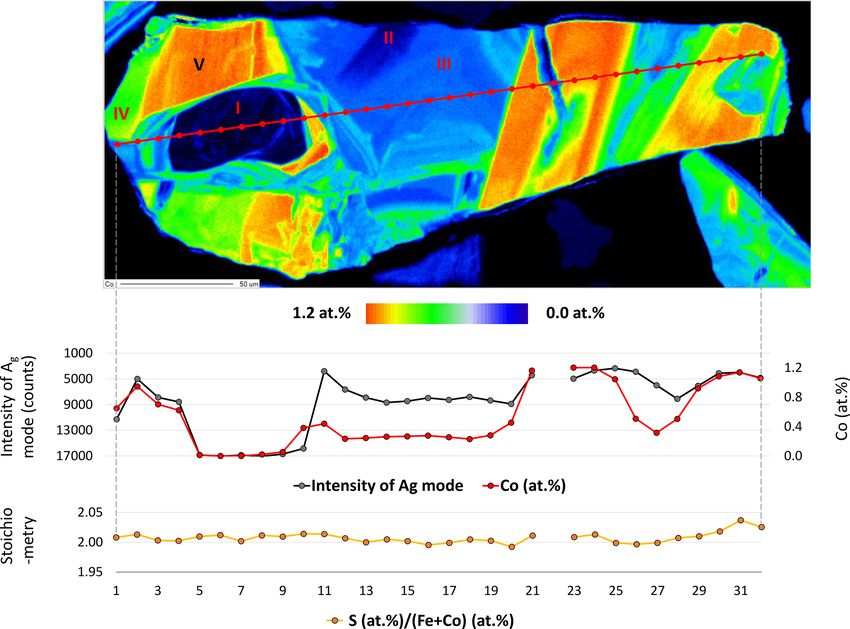
262 K. Berkh and D. Rammlmair: The effect of Co substitution on the Raman spectra of pyrite
Table 1. Measurement settings.
Sample Measure- Objective Laser Power on Exposure Accumu- Step size
preparation ment (nm) laser exit slit time (s) lation (µm)
Mechanical polishing Map ×100 633 50 % (∼ 9 mW) 1 4 1×1
Map ×100 532 50 % (∼ 26 mW) 1 4 1×1
Point ×100 633 50 % (∼ 9 mW) 30 10
Point ×100 532 50 % (∼ 26 mW) 30 10
Line ×100 633 50 % (∼ 9 mW) 3 20
BIB polishing Map ×100 633 50 % (∼ 9 mW) 1 4 1×1
Point ×100 633 50 % (∼ 9 mW) 30 10
Cut Map ×20 532 100 % (∼ 52 mW) 1 1 50 × 50
Point ×100 633 50 % (∼ 9 mW) 30 10
Point ×100 532 50 % (∼ 26 mW) 30 10
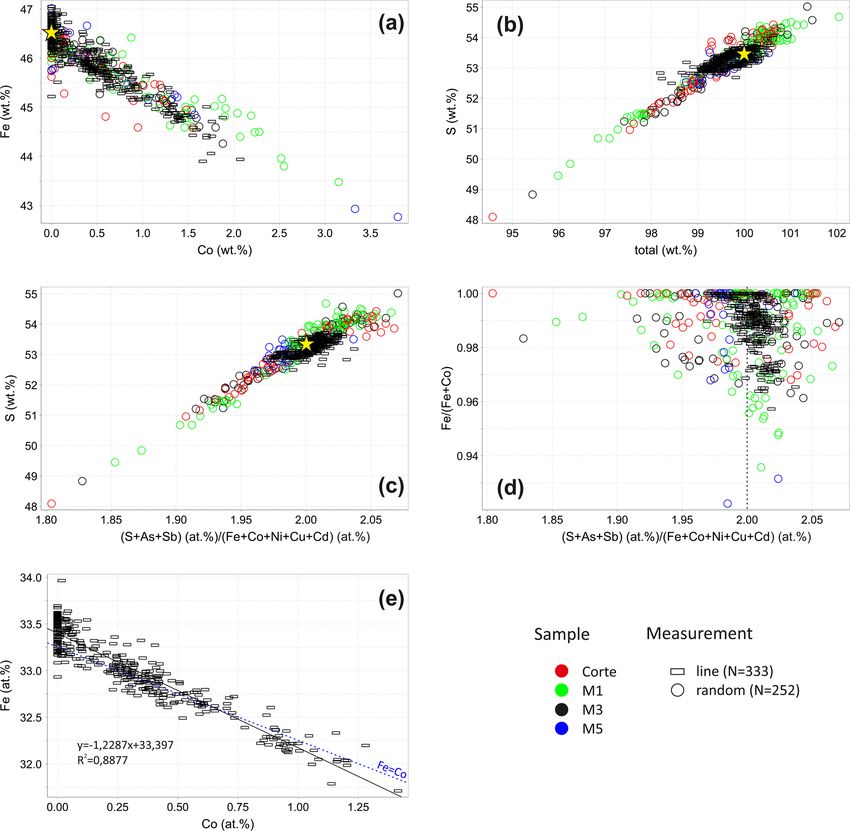
Kα) and hits the sample. The emitted fluorescence radiation Sb usually substitute S, whereas Co, Ni, Cu, and Cd re-
from the sample is detected by a silicon drift detector. 50 keV place Fe, the stoichiometry of pyrite is depicted as a ra-
and 600 µA were applied for the operation of the tube. A step tio (S+As+Sb) at. % / (Fe+Co+Ni+Cu+Cd) at. %. The ra-
size of 40 µm and a dwell time of 2 ms per pixel were cho- tio of all samples is widespread ranging from 1.80 to 2.08 and
sen. Chemical compositions of regions of interest (ROI) are leads to the gross formula FeS2−x with −0.07 ≤ x ≤ 0.20.
calculated as mean spectra by the method of fundamental pa- Larger deviations from the ideal stoichiometry tend to oc-
rameters within the instrument software. cur in samples M1 and Corte due to their advanced weath-
ering. Nevertheless, the median values for individual sam-
ples including Corte and drill cores M1, M3, and M5 are
3 Results 1.99, 2.00, 2.00, and 1.98, respectively, which demonstrates
a dominance of stoichiometric pyrite.
3.1 Chemical composition by EPMA In Fig. 2d, the Co content expressed as Fe / (Fe+Co) is
plotted against stoichiometry. Pure pyrite has a widely dis-
Representative pyrite grains in the extracted heavy mineral persed stoichiometry ranging from 1.80 to 2.06, whereas Co-
concentrates from drill cores M1, M3, and M5 and sample bearing pyrite tends to have a stoichiometry near to 2.00.
Corte were analyzed by EPMA. The measurement point was That means that the stoichiometry is improved by the in-
usually set in the center but occasionally at the edge of the creasing Co concentration, which can be additionally seen
grains because pyrite grains locally have a As-rich rim with in Fig. 3. Stoichiometry distributions are shown here for
up to 8.7 wt % As. In turn, the center of grains is almost pyrite with different Co contents. It is wide in pure pyrite
As-free as 3/4 of the analyses fall below the detection limit with a standard deviation of 0.035 (Fig. 3a) but narrows with
and 1/4 are below 0.6 wt %. Further impurities including Ni, the increasing Co content. The standard deviation decreases
Cu, Sb, and Cd are under 0.5 wt %, 0.2 wt %, 0.3 wt %, and hereby up to 0.014 (Fig. 3b–d), and the stoichiometry slightly
0.2 wt %, respectively. Results are listed in Supplement Ta- shifts towards higher numbers. The reason for that is that the
ble S1 and displayed as a circle symbol in Fig. 2. The sam- Co substitution for Fe is not 1 : 1 (Fig. 2e). According to the
ple M3 was taken from a less-weathered part of the tailings trendline equation one Co atom replaces 1.2 Fe atoms, which
dump. Additionally, it is coarser grained than others and was means that the Co substitution creates vacancies at the Fe
thus selected for further analyses. Thereby, line measure- position, which raises S to metal ratio and leads to a higher
ments were performed on grains (n = 7) containing an ele- stoichiometry.
vated concentration of Co. Results are shown as a rectangle
in Fig. 2. 3.2 Raman analysis on mechanically polished surface
Pyrite contains up to 3.8 wt % Co (Fig. 2a). The Co con-
centration negatively correlates with the Fe concentration. Raman mapping was performed on seven randomly oriented
The bigger part of pyrite has a S deficit that results in a grains in the coarse-grained and less-weathered sample M3.
low total (Fig. 2b). No correlation between the Fe content The selection of the grains was based on an elevated Co con-
and total was observed. Therefore, a low total due to mi- centration. After collecting map spectra, the main Eg and Ag
croporosity can be excluded because Fe deficit should pro- peaks of pyrite were fitted by using the WiRE software. An
portionally occur at the low total in the case of the mi- overlapping of Tg (1) and Tg (2) peaks does not affect the fit-
croporosity. The relation between stoichiometry and the S ted Eg and Ag peaks because their intensity is much weaker
content of pyrite is displayed in Fig. 2c. Since As and than that of the dominant Eg and Ag peaks. Tg (3) peak was
Eur. J. Mineral., 34, 259–274, 2022 https://doi.org/10.5194/ejm-34-259-2022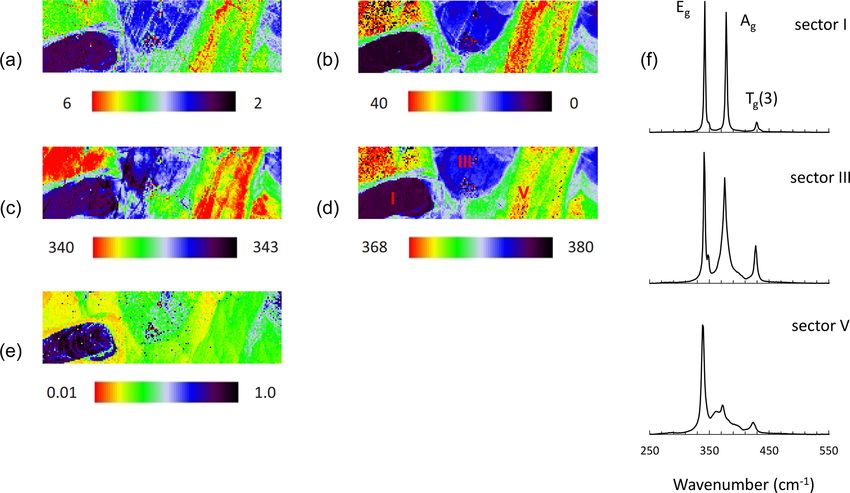
K. Berkh and D. Rammlmair: The effect of Co substitution on the Raman spectra of pyrite                                                  263

Figure 2. Correlation diagrams for relevant elements of analyzed pyrite grains. Yellow stars and dashed lines pose the theoretical composition
of stoichiometric pyrite.

Figure 3. Stoichiometry distributions in four groups of pyrite with differing Co contents.

https://doi.org/10.5194/ejm-34-259-2022                                                             Eur. J. Mineral., 34, 259–274, 2022
264                           K. Berkh and D. Rammlmair: The effect of Co substitution on the Raman spectra of pyrite

not fitted because its weakness and large FWHM do not al-            Sector I presents the first generation of pyrite and has a
low for a reliable evaluation. FWHM, Raman shift, and in-         concentric growth zoning caused by a trace amount of Co.
tensity ratio maps of the most representative grain are shown     The margin of the sector shows increased but strongly vari-
in Fig. 4a–e. The corresponding Co distribution map revealed      able Co contents. Sectors IV and V pose the second genera-
by EPMA is depicted in Fig. 4f.                                   tion of pyrite and have a tabular-like habitus. Sector IV has
   Both Eg and Ag modes progressively broaden (Fig. 4a            a lower Co content than sector V and therefore may present
and b) and shift towards lower wavenumbers (Fig. 4c and           a leached part of the second generation. Sectors II and III
d) by gaining Co substitution (Fig. 4f). The Ag mode is more      demonstrate the last generation of pyrite that deposited in
sensitive to Co incorporation because its broadness and shift-    interstitial volumes and has a collomorph-banded-like tex-
ing are stronger compared to the Eg mode. Especially the in-      ture. The contact between the three generations is distinct and
tensity of the Ag mode drastically drops and diminishes in        sharp implying a presence of different crystal domains. How-
comparison to the Eg mode. Accordingly, the intensity ratio       ever, only the first generation has a different crystal orienta-
of the modes (Ag / Eg ) decreases with increasing Co concen-      tion, while the last two generations show the same crystal ori-
tration (Fig. 4e). It should be noted that limits of the scale    entation because they uniformly darken during rotation of the
are semi-quantitative because they were set visually to attain    microscope stage under reflected and nearly cross-polarized
optimal images.                                                   light (Fig. 6). Therefore, it seems to be a crystallographically
   The grain was additionally mapped by using 532 nm exci-        oriented intergrowth or recrystallization.
tation for comparison, and the result is shown in Fig. 5. The        As mentioned, the Ag mode is more sensitive to the vary-
pattern of the map is barely changed, proving the same vari-      ing Co content, especially its intensity. Thus, the intensity of
ation of Eg and Ag modes due to the increasing Co concen-         the mode is quantitatively compared with the Co content by
tration independent of the laser energy (Fig. 5a–d). However,     collecting 32 Raman and EPMA point measurements indi-
the map of the intensity ratio differs (Fig. 5e) because the Ag   cated by the red line in Fig. 7. Results are displayed below
mode of pure pyrite measured with a 532 nm laser was less         the element distribution map (Fig. 7) and listed in Supple-
intense. Furthermore, a CW-DPSS laser with wavelengths of         ment Table S2. The line was chosen by eye in both meth-
1064 nm was tested. Spectra were recorded by an Andor In-         ods. Therefore, a minor spatial discrepancy can occur, which
GaAs detector with a CCD array of 512 × 1 pixels using an         might lightly affect the comparison diagrams. The measure-
830 L mm−1 grating. The laser was unsuitable because Ra-          ment number 22 is omitted because it was acquired in a frac-
man scattering intensity is inversely proportional to λ4 . Ac-    ture.
cordingly, the only mode existing was a weak Ag mode, and            The intensity of the Ag mode varying from 3357 to 17 050
it disappeared as soon as pyrite had a trace amount of Co.        is strongly influenced by the small amount of Co up to
   The grain was examined with reflected light microscopy.        1.2 at. %. The more Co in pyrite there is, the lower the in-
Under reflected and parallel-polarized light, the grain is ho-    tensity of the Ag mode will be. The reciprocal correlation is
mogeneous and possesses no pleochroism. Under nearly              almost linear except for sector III containing a trace amount
cross-polarized light, two domains with a weak anisotropy         of Co ranging from 0.2 at. % to 0.5 at. %. The intensity of the
were observed (Fig. 6). They alternately become extinct dur-      Ag mode shows here a stronger dip implying that incorpo-
ing rotation of the microscope stage, which demonstrates the      ration of trace Co results in an abrupt change in the dumb-
presence of two domains of different lattice orientation. One     bell S–S bond. Similarly, Yuan and Zheng (2015) observed
belongs to pure pyrite, and the other one belongs to the sur-     that the chemical bonds of pyrite are more sensitive to stress
rounding Co-bearing pyrite that hosts several sectors seen        changes at low pressures than at high pressures. Differences
in both Raman and element distribution maps (Fig. 4). The         in crystal lattice orientation between different sectors could
weak anisotropy usually points to a distortion of the lattice     be responsible for some of the variation in the intensity of the
and is therefore most probably the result of a surface defor-     Ag mode, as noted in Bryant et al. (2018). However, sector
mation due to the mechanical polishing procedure (Libow-          III has the same crystal orientation as sectors II, IV, and V,
itzky, 1994).                                                     as noted previously. Stoichiometry does not play a role in the
                                                                  intensity of the Ag mode because there is no correlation. The
3.3   Element distribution map: comparison of Raman               stoichiometry is here expressed as ratio S / (Fe+Co) since
      signature and Co content of pyrite along line               other impurities were negligible. The ratio weakly deviates
      measurements                                                from an ideal straight line and varies between 1.99 and 2.04,
                                                                  pointing to a nearly stoichiometric pyrite. The noticeable dip
An enlarged semi-quantitative element distribution map of         in the intensity of the Ag mode occurs above 0.2 at. % Co.
the investigated grain is shown in Fig. 7. The limits of the      Thus, 0.2 at. % can be regarded as a detection limit of the
scale bar correspond to maximum and minimum values ob-            Raman technique for Co.
tained by the line measurement on the grain. Sector I presents       Point measurements with longer acquisition time were
pure pyrite. The remaining sectors including II, III, IV, and     performed for sectors I–V. The data were collected from a
V have increasing Co concentrations up to 1.2 at. %.              pixel of the Raman map showing the most optimal spectrum

Eur. J. Mineral., 34, 259–274, 2022                                                  https://doi.org/10.5194/ejm-34-259-2022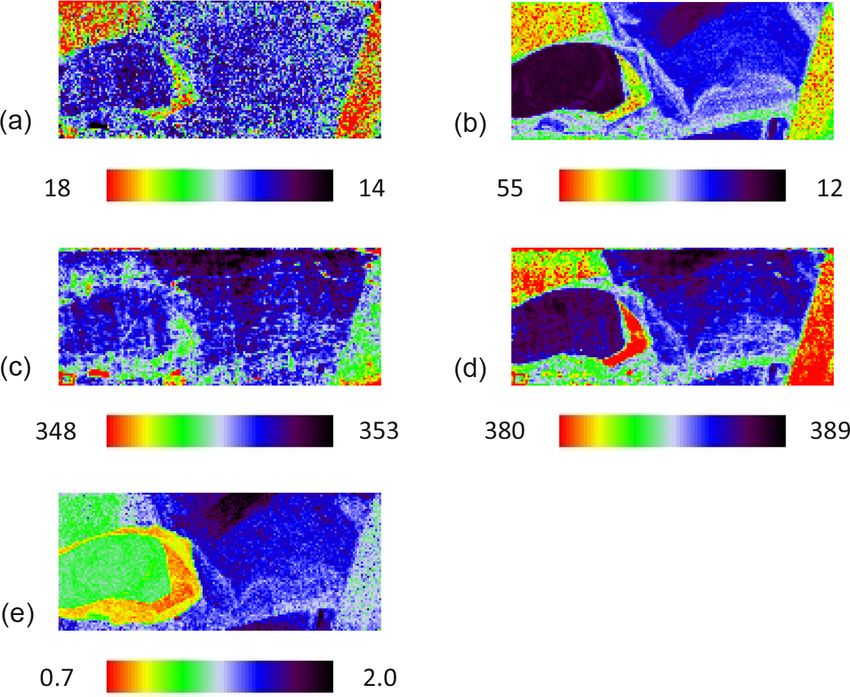
K. Berkh and D. Rammlmair: The effect of Co substitution on the Raman spectra of pyrite                                             265

Figure 4. Raman map of pyrite grain with 633 nm laser. FWHM of Eg (a) and Ag (b) modes (presented in cm−1 ), Raman shift of Eg (c) and
Ag (d) modes (presented in cm−1 ), intensity ratio of Eg and Ag (Ag / Eg ) modes (e), and Co distribution map revealed by EPMA (presented
in at. %) (f).

with a high signal-to-noise ratio. The positions of the ac-            and in particular chemical impurity and sample preparation
quired spectra approximately correspond to the positions of            have a strong influence on spectra.
the numerals in Fig. 7. The Raman shifts, FWHM, and inten-                Unpolished samples typically possess inadequate quantita-
sity ratios of the main Eg and Ag modes are listed in Table 2          tive chemical information since common in situ methods re-
in addition to literature data.                                        quire a polished surface. Accordingly, it is unknown whether
   Spectra revealed by the 532 and 633 nm lasers are com-              their Raman spectra have been affected by impurities or not.
parable (Fig. 8). The peak centers of the Eg and Ag modes              In turn, studies performed on polished samples offer chem-
are 351 and 387 cm−1 with the 532 nm laser and 351 and                 ical information but reveal increased band frequencies and
388 cm−1 with the 633 nm laser. The corresponding FWHM                 widths similar to our results. Since a surface deformation of
of the Eg and Ag modes are 16.1 and 16.4 cm−1 with the                 pyrite was predicted under reflected and parallel-polarized
532 nm laser and 17.0 and 14.0 cm−1 with the 633 nm laser.             light as a weak anisotropy, we assume that such biased spec-
Regardless of the laser type, both the Eg and Ag modes pro-            tra are the result of the mechanical polishing. Thus, a BIB
gressively shift to lower wavenumbers and broaden as the Co            polishing technology was applied to eliminate the surface
concentration is increased. Furthermore, the intensity of the          strain. Subsequently, the sample was re-analyzed by the Ra-
Ag mode decreases. A remarkable difference between spec-               man method.
tra collected by the two lasers is the more intense Ag mode
and its stronger diminishment with the 633 nm laser. Gener-            3.4   Raman analysis on broad ion beam polished
ally, the 633 nm laser is more suited for Co evaluation be-                  surface
cause the change in the spectra due to the varying Co substi-
tution is more prominent.
   However, our spectra of pure pyrite disagree with most of           Raman mapping was performed in an area within the grain
the data published previously (Table 2). Generally, Raman              previously analyzed. The same measurement settings and fit-
spectra of pyrite in the literature are markedly variable since        ting procedure were applied. FWHM, Raman shift, and in-
numerous factors such as crystal orientation, laser energy,            tensity ratio maps are shown in Fig. 9a–e. The corresponding
                                                                       spectra collected from available sectors by point measure-

https://doi.org/10.5194/ejm-34-259-2022                                                         Eur. J. Mineral., 34, 259–274, 2022
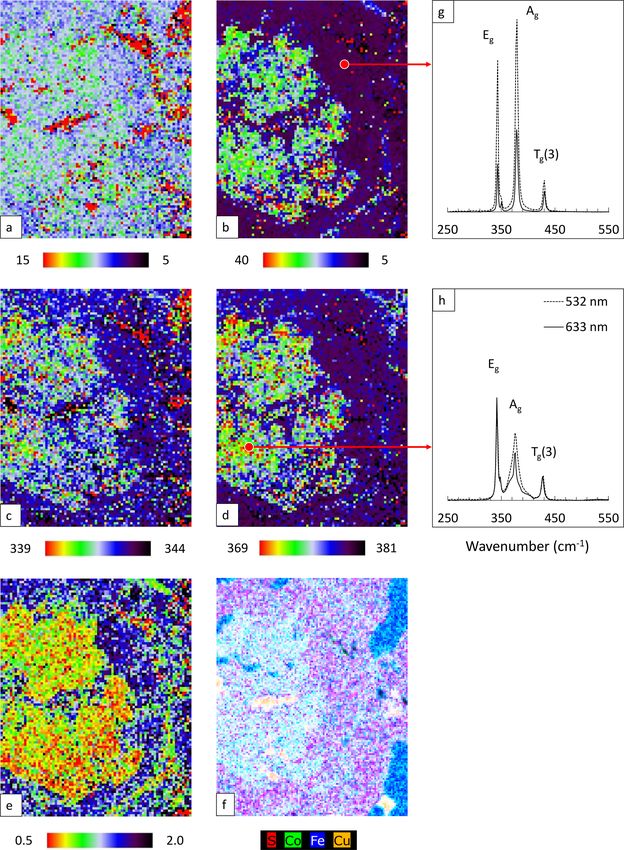
266                              K. Berkh and D. Rammlmair: The effect of Co substitution on the Raman spectra of pyrite

Figure 5. Raman map of pyrite grain with 532 nm laser. FWHM of Eg (a) and Ag (b) modes (presented in cm−1 ), Raman shift of Eg (c) and
Ag (d) modes (presented in cm−1 ), and intensity ratio of Eg and Ag (Ag / Eg ) modes (e).

Figure 6. Pyrite grain under reflected and nearly cross-polarized light positioned at 0◦ (a) and rotated by 90◦ (b).

ments are shown in Fig. 9f, and results of the peak fitting               wavenumbers and broadens with the increasing Co content.
procedure are listed in Table 3.                                          For the Co-bearing pyrite more than four peaks were fitted
   The pattern of the map has scarcely changed, proving the               to reduce χ 2 values. The final χ 2 values were 0.01, 0.03
same variation of Eg and Ag modes due to the increasing Co                and 0.03 for pyrite in sectors I, III, and V, respectively. The
concentration independent of the sample preparation. Simi-                curve fitting results are depicted in Supplement Fig. S2. The
lar to former results the Ag mode broadens and shifts stronger            Co incorporation obviously generates additional unidentified
than the Eg with the Co concentration. The intensity ratio of             broad bands in the spectrum of Co-bearing pyrite (“?” in Ta-
the modes (Ag / Eg ) also decreases, but it is lower than that            ble 3). They are located at 376 and 397 cm−1 for sector III
before BIB polishing. The reason could be a trace amount of               and at 361, 374, and 397 cm−1 for sector V.
Co at the changed level of the grain surface after BIB polish-
ing.                                                                      3.5   Raman analysis on cut surface
   A distinct difference to the previous spectra is that the cur-
rent spectra exhibit much narrower Raman modes located                    A cut of hand specimen (Fig. 10a) was investigated according
at lower frequencies (Fig. 9f and Table 3), showing that                  to its chemical composition using a µ-EDXRF. The obtained
the stressed surface has been abraded by the BIB. Due to                  element distribution map is shown in Fig. 10b. Relevant ele-
the reduced FWHM of the modes the Tg (1) mode could be                    ments including S, Co, Fe, Cu, and Si are presented in false
separated. Like with others the Tg (1) mode shifts to lower               colors.

Eur. J. Mineral., 34, 259–274, 2022                                                           https://doi.org/10.5194/ejm-34-259-2022
K. Berkh and D. Rammlmair: The effect of Co substitution on the Raman spectra of pyrite                                              267

Figure 7. Semi-quantitative Co distribution map of pyrite and position of quantitative analyses along the red line performed by microprobe
and Raman spectroscopy. Results are presented in the diagram below the map. Numbers (I–V) on the map present positions of Raman spectra
acquired by point measurements.

   The rock is composed mainly of magnetite (blue) and                 netite and can be ignored. As expected, the Ag mode broad-
quartz (black) and hosts veinlets consisting of chalcopy-              ens (Fig. 11b) and shifts with elevating Co concentration
rite (yellow), pure pyrite (magenta), and Co-bearing pyrite            (Fig. 11d); also the intensity ratio of the modes (Ag / Eg ) de-
(cyan). Chalcopyrite and pure pyrite appear to have coevally           creases (Fig. 11e).
mineralized first. Then Co-bearing pyrite filled the remain-               Spectra collected from the cut surface by point measure-
ing pore spaces of the veinlets or a Co-bearing fluid inter-           ment are comparable to those from the BIB polished sur-
acted with preexisting pure pyrite and replaced Fe with Co.            face. The modes are sharp and located at lower frequencies
A small amount of calcite, pyroxene, amphibole, and chlorite           (Table 4). The Tg (1) mode is present owing to the reduced
is also present in the host rock.                                      FWHM of the modes. For Co-bearing pyrite extra peaks were
   Up to ±1.5 at. % Co was measured in pyrite. However,                fitted to reduce χ 2 values. The final χ 2 values were less
the real maximum content should be higher because concen-              than 0.03. The modification of the pyrite spectra due to the
trations were calculated as a mean spectrum of an ROI that             Co substitution is independent of the laser wavelengths. The
usually consists of several sectors with varying Co concen-            only difference is the narrower bandwidths achieved by the
trations as seen in the element distribution map by EPMA               633 nm laser due to higher spectral resolution.
(Fig. 7).
   Raman mapping was performed in an area within the red
square in Fig. 10b using 532 nm laser. The same fitting proce-         4     Discussion
dure as used for the polished samples was applied. FWHM,
                                                                       4.1    Pyrite chemistry
Raman shift, and intensity ratio maps are shown in Fig. 11a–
e. The corresponding enlarged element distribution map is
                                                                       Since pyrite is a refractory mineral that is stable up to rel-
depicted in Fig. 11f. Single point spectra acquired from pure
                                                                       atively high temperatures, it readily preserves trace element
and Co-bearing pyrite using 532 and 633 nm lasers are pre-
                                                                       signatures. Thus, the trace element geochemistry of this ubiq-
sented in Fig. 11g and h. Results of the peak fitting procedure
                                                                       uitous mineral can be used as a geochemical tool in ore
are listed in Table 4.
                                                                       genesis (Cook et al., 2016). In particular, the Co/Ni ratio
   Similar to previous results the Eg mode is rather insensi-
                                                                       in mineralizing fluid can be preserved in pyrite as both el-
tive and barely changes with the Co incorporation (Fig. 11a
                                                                       ements are usually incorporated equally due to their simi-
and c). Red pixels here belong to chalcopyrite and mag-
                                                                       larity. Pyrites formed at or below the seafloor in sedimen-

https://doi.org/10.5194/ejm-34-259-2022                                                          Eur. J. Mineral., 34, 259–274, 2022
268 K. Berkh and D. Rammlmair: The effect of Co substitution on the Raman spectra of pyrite
Table 2. Comparison of investigated and literature wavenumbers (cm−1 ) for Raman spectrum of pyrite. Tg (1) and Tg (3) modes are not
presented.
Eg Ag Ag / Eg Chemical Laser Sample Locality Source
Center FWHM Center FWHM intensity composition preparation
351 18.0 385 15.0 3.8–1.0∗ – 454.2–514.5 Polished – Macfarlane et
al. (1974)
351 2.4 385 1.7 – 454.2–514.5 Unpolished – Macfarlane et
al. (1974)
343 4.7 379 5.7∗ 4.3∗ – 514.5 Polished East Tirol, Italy Vogt et al. (1983)
353 – 374 – – – – – – Sourisseau et al. (1991)
calculated
353 16.0∗ 387 17.0∗ 0.8∗ < 5 % impurity 514.5 – Guinaoang, northwestern Mernagh and Trudu (1993),
Luzon, Philippines pyrite isotropic
342 7.4∗ 377 8.5∗ 1.5∗ < 5 % impurity 514.5 – Pine Creek, N.T., Australia Mernagh and Trudu (1993),
pyrite anisotropic
342 9.2∗ 377 8.5∗ 7.9∗ – – – Hope et al. (2001)
344 3.2 379 4.5 2.3∗ – 514.5 – – Kleppe and Jephcoat
(2004)
343 10.5 379 10.5 1.1∗ – 532 Unpolished Inactive chimney from White (2008)
11◦ N on the East Pacific
Rise
336–346 9.7–32.2 377–383 10.3–29.6 – < 8 wt % Cu 785 Polished Čoka Marin, Serbia Pačevski et al. (2008)
331–343 2.3–22.6 376–379 0.3–20.7 – < 8 wt % Cu 785 Alkaline silica Čoka Marin, Serbia Pačevski et al. (2008)
336–347 14.5–27.8 373–384 16.8–27.0 1.3∗ (Cu-poor), < 8 wt % Cu 633 Polished Čoka Marin, Serbia Pačevski et al. (2008)
1.0∗ (Cu-rich)
344 3.9 380 3.9 0.9∗ – 514.5 Unpolished – Yuan and Zheng (2015)
341 11.4∗ 377 11.4∗ 1.0∗ Pure Fe2 S 633 Nanocrystals Synthetic Kinner et al. (2016)
321 38.6∗ 376 50.0∗ 0.9∗ Pure Co2 Fe2 S 633 Nanocrystals Synthetic Kinner et al. (2016)
342–343 4.4–5.1 378–379 4.4–30.0 1.0 on (100) < 0.1 wt % Ni 532 Unpolished Several localities Bryant et al. (2018)
1.8 on (111) < 1 wt % As
1.4 on (210)
342 6.2∗ 380 6.2∗ 2.3∗ on (100) 0.1 wt % Zn 532 Polished Hunan Province, China Feng et al. (2019)
4.2∗ on (110)
5.1∗ on (111)
351 17.0 388 14.0 2.0 ∼ 0.0 at. % Co 633 Polished North-central Chile This study, sector I
351 18.6 389 17.5 2.0 ∼ 0.2 at. % Co 633 Polished North-central Chile This study, sector II
350 18.5 386 22.9 1.3 ∼ 0.4 at. % Co 633 Polished North-central Chile This study, sector III
349 20.2 384 31.5 0.8 ∼ 0.6 at. % Co 633 Polished North-central Chile This study, sector IV
343 18.3 373 46.2 0.5 ∼ 1.2 at. % Co 633 Polished North-central Chile This study, sector V
351 16.1 387 16.4 1.2 ∼ 0.0 at. % Co 532 Polished North-central Chile This study, sector I
351 16.0 386 19.1 1.8 ∼ 0.2 at. % Co 532 Polished North-central Chile This study, sector II
351 16.5 384 34.9 1.5 ∼ 0.4 at. % Co 532 Polished North-central Chile This study, sector III
348 19.3 380 35.4 1.3 ∼ 0.6 at. % Co 532 Polished North-central Chile This study, sector IV
346 19.0 374 39.3 0.9 ∼ 1.2 at. % Co 532 Polished North-central Chile This study, sector V
∗ The present authors determined FWHM and intensity ratios by manually measuring enlarged spectra if not clearly reported. – Not reported.
Table 3. Frequencies and FWHM of observed Raman modes of pyrite measured on BIB polished surface (cm−1 ).
Sect. Eg Tg (1) ? Ag ? ? Tg (3) Ag / E g
Center FWHM Center FWHM Center FWHM Center FWHM Center FWHM Center FWHM Center FWHM
I 342 2.6 349 3.2 378 3.0 429 4.5 0.9
III 342 3.1 348 3.0 376 3.3 376 15.0 397 31.9 428 5.2 0.4
V 339 5.4 345 4.0 361 20.1 373 5.1 374 41.5 397 8.8 423 9.1 0.1
Eur. J. Mineral., 34, 259–274, 2022 https://doi.org/10.5194/ejm-34-259-2022K. Berkh and D. Rammlmair: The effect of Co substitution on the Raman spectra of pyrite 269
Table 4. Frequencies and FWHM of observed Raman modes of pyrite measured on cut surface (cm−1 ).
Sector Laser Eg Tg (1) ? Ag ? Tg (3) Ag / E g
(nm) Center FWHM Center FWHM Center FWHM Center FWHM Center FWHM Center FWHM
Pure 532 343 3.0 350 3.4 379 5.5 430 4.6 1.2
Pure 633 343 2.6 350 2.5 379 5.0 431 4.2 1.7
Co 532 342 4.1 348 3.8 375 21.3 376 5.8 427 5.6 0.3
Co 633 342 3.5 348 3.8 373 25.1 376 3.3 400 16.3 427 5.6 0.3
tary and volcanic settings are generally characterized by low
Co/Ni ratios (< 1), whereas magmatic–hydrothermal pyrite
exhibits Co/Ni ratios between ∼ 1 and 10 (del Real et al.,
2020). Pyrite in our study is considered to be hydrothermal
and was deposited in the Mantos de Punitaqui vein. However,
it has highly variable Co/Ni ratios ranging from nearly 0 to
over 100 caused by very low Ni concentrations. For such a
high ratio a metamorphic event might be responsible as meta-
morphism leads to a loss of Ni and gain of Co (Bralia et al.,
1979).
Grain-scale heterogeneity in our sample is primarily the
result of different generations of pyrite, indicating multiple
pulses of the mineralizing fluid. The fine chemical zoning
due to Co incorporation within a single generation is in turn
most probably caused by temperature fluctuations of the host
fluid, at least at a local scale. Numerous studies have shown
that Co incorporation into pyrite tends to be more efficient
under higher-temperature conditions (del Real et al., 2020;
Grant et al., 2018).
Other geochemically important trace elements are, for ex-
ample, temperature- and redox-sensitive pairs such as Se
and Ni (del Real et al., 2020). However, their concentrations
in our pyrite sample are nearly always below the detection
limits of EMPA. Therefore, laser ablation inductively cou-
pled plasma mass spectrometry (LA-ICP-MS) would help
to record such low concentrations. The method has recently
been widely applied for elemental mapping of pyrite to study
ore formation (Cook et al., 2016; del Real et al., 2020; Zhou
et al., 2017). However, this is a destructive technique with
a relatively large ablation crater for a moderately hard min-
eral like pyrite, which can be 20 µm deep, giving an ablated
volume of several thousand cubic micrometers (Cook et al.,
2016). This makes it difficult to perform a correlative study
with Raman techniques with a spot size of less than 1 µm, es-
pecially for minerals with micro-scale compositional zona-
tion such as pyrite in this study.
4.2 Band position
The Raman band position of pyrite normally depends on
pressure and temperature change (Kleppe and Jephcoat,
Figure 8. Raman spectra of pyrite with varying Co contents by 532 2004; Yuan and Zheng, 2015). Laser heating at the sample
and 633 nm lasers. surface causes downshifting of bands (Bryant et al., 2018).
In our case, the effect of laser heating due to longer expo-
sure time was small because the spectra extracted from the
https://doi.org/10.5194/ejm-34-259-2022 Eur. J. Mineral., 34, 259–274, 2022270 K. Berkh and D. Rammlmair: The effect of Co substitution on the Raman spectra of pyrite Figure 9. Raman map of pyrite grain with 633 nm laser after BIB polishing. FWHM of Eg (a) and Ag (b) modes (presented in cm−1 ), Raman shift of Eg (c) and Ag (d) modes (presented in cm−1 ), intensity ratio of Eg and Ag (Ag / Eg ) modes (e), and Raman spectra of pyrite collected from sectors I, III, and V by point measurements (f). Figure 10. Cut of rock sample (a) and element distribution map revealed by µ-EDXRF (b). map with an exposure time of 4 s per pixel were compara- 1979; Kwon et al., 2000), whereas it is 5.42 Å in pyrite. ble to the point measurements with a longer exposure time Gaining lattice constants with an increasing Co concentra- of 5 min (Table 3 and Fig. 9). Zhu et al. (2020) reported a tion in synthetic nanocrystals of pyrite was predicted, as well notable downshift of band positions of up to 7 cm−1 at the as measured, by Kinner et al. (2016). It confirms our obser- higher laser power of 75 mW instead of 1.5 mW in As-rich vation that both Eg and Ag modes downshift with increas- pyrite (up to 4.9 wt % As). Similarly, we observed a down- ing Co content, implying a lengthening of chemical bonds shifting of the Ag band by up to 4 cm−1 when the laser power which reflects an expansion of the crystal structure. Fujioka was increased from 0.5 to 52 mW in pure pyrite, as well as in et al. (2016) also observed a downshifting of frequencies by Co-bearing pyrite (Supplement Fig. S3). Moreover, a regu- a substitution of Co in NiTiO3 . Their interpretation was an lar mechanical polish led to strongly upshifted bands, which average symmetry lowering through a structural distortion. could be avoided by analyzing BIB polished or cut surfaces. However, pure cattierite has a fairly different Raman spec- In this study, the downshifting of the modes is caused by trum than that of pyrite, although they have the same struc- Co substitution because the laser power was kept constant ture type. According to the RRUFF database, the strongest during measurements. Cattierite (CoS2 ) readily forms a solid mode of cattierite is at 385 cm−1 , and the second strongest solution series with pyrite (Klemm, 1965; Bouchard, 1968). mode is at 291 cm−1 . The lattice constant of cattierite is 5.53 Å (Pratt and Bayliss, Eur. J. Mineral., 34, 259–274, 2022 https://doi.org/10.5194/ejm-34-259-2022
K. Berkh and D. Rammlmair: The effect of Co substitution on the Raman spectra of pyrite                                           271

Figure 11. Raman map of pyrite grain with 532 nm laser. FWHM of Eg (a) and Ag (b) modes (presented in cm−1 ), Raman shift of Eg (c)
and Ag (d) modes (presented in cm−1 ), intensity ratio of Eg and Ag (Ag / Eg ) modes (e), element distribution map revealed by µ-EDXRF
(f), and Raman spectra of pure pyrite (g) and Co-rich pyrite (h).

   The Ag mode of pyrite is more sensitive and displays              1996). Therefore, during the expansion of the unit cell due
stronger downshifts than the Eg mode. It might be explained          to the Co substitution, the downshifting of the Eg mode is
by the following. The longer the S–S distance is, the shorter        weaker than the Ag mode.
the M–S distance is in FeS2 , CoS2 , and NiS2 . The sum of
the two bond lengths remains nearly constant (Elliott, 1960).        4.3   Bandwidth
The Ag mode is largely determined by the S–S force con-
stant, whereas the Eg mode is mainly governed by the Fe–S            Increasing the laser power from 0.5 to 52 mW resulted in
force constant (Sourisseau et al., 1991; Lutz and Zwinscher,         a slight broadening of Ag band by up to 1 cm−1 in both
                                                                     pure and Co-bearing pyrites (Supplement Fig. S3). In turn,

https://doi.org/10.5194/ejm-34-259-2022                                                       Eur. J. Mineral., 34, 259–274, 2022
272 K. Berkh and D. Rammlmair: The effect of Co substitution on the Raman spectra of pyrite
the bandwidths are extremely sensitive to surface strains. A caused by the Co substitution itself. It partly results from the
rough polishing with 3 µm diamond paste resulted in strongly splitting out of the Tg (2) mode from the Ag mode but not
broadened bandwidths ranging from 14 to 17 cm−1 for pure completely because the Tg (2) mode is less intense than Tg (3)
pyrite, whereas they were less than 2.6 cm−1 when measured mode (Vogt et al., 1983), and its subduction would not result
from a BIB polished or cut surface. Pačevski et al. (2008) in such a strong decrease. Thus, some kind of Co-induced
also achieved a reduced FWHM with a chemo-mechanical “antiresonant scattering” of the Ag mode seems to be the rea-
final polish. son.
The increasing bandwidths with the elevating Co content Finally yet importantly, chemical impurity affects all three
in this study is caused by an overlap of several Raman bands. signatures. However, a chemical investigation of the ana-
Pyrite is a natural semiconductor with an indirect band gap lyzed pyrite was neglected in a number of publications (Ta-
of ∼ 0.95 eV (Ferrer et al., 1990) that can be significantly de- ble 2), which can highly modify the pyrite spectra as seen in
creased by Co substitution (Xian et al., 2012). The decrease this study.
in the band gap strongly affects the electrochemical prop-
erties of the mineral and accordingly vibrational properties 4.5 Similar cases
of the crystal. The formation of additional bands may also
hint at a structural disorder because the chemical analyses on Hope et al. (2001) and Osadchii and Gorbaty (2010) ob-
pyrite predict a creation of vacancies at the Fe position due to served in case of sphalerite that the intensity of the LO (longi-
Co substitution. Similarly, Fujioka et al. (2016) demonstrated tudinal optical) mode at 350 cm−1 decreases, whereas the TO
a structural distortion by the substitution of Co in NiTiO3 , but (transverse optical) mode at 275 cm−1 became more intense
the Raman modes in their study remained sharp. The expla- when the mineral contained more Fe. Pačevski et al. (2008)
nation was a homogeneous spatial Ni/Co ratio within a laser also recorded a correlation between increasing Cu content
spot implying a long-range structural disorder (Fujioka et al., up to 8 wt % and decreasing band position and increasing
2016). In turn, the Co distribution in pyrite in our case ap- bandwidth in natural pyrite (inferred to be in solid solution).
pears to be rather heterogeneous at the nanoscale level, hint- These authors explained that the pyrite structure is slightly
ing at a short-range, as well as long-range, structural distor- expanded due to the larger Cu atoms, and thus the bonds be-
tion. come longer and weaker. Additionally, distorted Cu sites re-
sult in a variety of structural environments in the lattice and
4.4 Intensity of band consequently broadening of bands. Furthermore, intensities
of the Eg and Ag modes were approximately equal in Cu-
The ratio of band intensities is usually affected by the crystal rich zones, whereas the intensity of Ag was higher in Cu-poor
lattice orientation with respect to the laser’s dominant polar- zones. Zhu et al. (2020) also recognized a strong linear cor-
ization plane (Vogt et al., 1983; Bryant et al., 2018; Feng et relation between As content and band positions of pyrite. All
al., 2019). Thus, different lattice orientations of the analyzed three Raman bands were shifted downwards (up to 10 cm−1 )
pyrite grains are responsible for some of the variation in the with an increase in As content from below 0.05 wt % to
Ag mode intensity. Although the mapped grains were ran- 4.89 wt %. The authors concluded that the downshifting was
domly oriented (Supplement), the representative grain stud- due to increased bond lengths and local distortions within an
ied contained several sectors with different crystal orienta- expanded crystal structure.
tions (Fig. 6), and the analyzed area of the cut sample con- A Raman spectrum for synthetic nanocrystals of
sisted of several subgrains (Fig. 11); a similar observation, Co0.5 Fe0.5 S2 was recorded by Kinner et al. (2016). The spec-
which is that the intensity of the Ag mode decreases with trum differed from a simple combination of Raman spec-
increasing Co concentration in pyrite, was made in all cases. tra obtained from the CoS2 and FeS2 , indicating the stoi-
A resonance effect depending on excitation energy also en- chiometric substitution of Co2+ . The Eg and Ag modes of
hances the intensity of certain bands, which changes the in- Co0.5 Fe0.5 S2 were downshifted from those of FeS2 (Table 2).
tensity ratio of the bands. Macfarlane et al. (1974) observed a The bandwidths were also strongly broadened, but the inten-
progressive gain in the intensity ratio (Ag / Eg ) from 1 to 4 on sity ratio remained constant (Kinner et al., 2016).
tuning the incident Ar+ laser energies from 2.41 to 2.73 eV.
They suggested that the resonance Raman scattering in pyrite
is mostly contributed by two direct inter-band electronic tran- 5 Conclusions
sitions occurring at 2.47 and 2.85 eV. Kleppe and Jephcoat
(2004) also observed a resonance scattering of Ag and Tg (1) We have determined the effect of Co substitution in pyrite on
modes with increasing pressure. Raman spectra of the mineral. A trace amount of Co causes
Similar to pure pyrite in this work, almost all pyrites in a downshifting and widening of the Raman bands, as well
the literature that are supposed to be pure have a stronger as diminishment of the Ag band of pyrite. The noticeable
Ag mode than Eg mode (Table 2). Thus, the diminishing of dip in the intensity of the Ag band occurs above 0.2 at. %
the Ag mode correlating to increasing Co concentration is Co, which can be regarded as a detection limit of the Raman
Eur. J. Mineral., 34, 259–274, 2022 https://doi.org/10.5194/ejm-34-259-2022K. Berkh and D. Rammlmair: The effect of Co substitution on the Raman spectra of pyrite 273
technique. We have also observed that the sample prepara- for their insightful comments and suggestions and Allen Nutman at
tion has a strong influence on the pyrite spectra. The standard the UOW for an invaluable consultation.
mechanical polishing resulted in strongly broadened modes
at upshifted frequencies, which could be avoided by analyz-
ing BIB polished or cut samples. However, the effect of Co Financial support. This research was funded by the German Min-
on pyrite spectra is independent of the sample preparation, eral Resources Agency under the grant number A-0203006.A.
enabling the method as a possible tool for the differentiation
of Co-bearing pyrite from pure pyrite. Raman spectroscopy
has several advantages over other methods. There is no need Review statement. This paper was edited by Etienne Balan and re-
viewed by two anonymous referees.
of sample preparation due to a unique application in the rapid
focusing on a rough surface even for crushed ores. No vac-
uum chamber and wavelength-dispersive analysis are neces-
sary. References
Assaying of ore prior to crushing and subsequent sepa-
ration of Co-rich ore would help to ensure that this strate- Anderson, A. J., Clark, A. H., and Gray, S.: The occurrence
and origin of zabuyelite (Li2 CO3 ) in spodumene-hosted fluid
gic element is recovered as a by-product rather than end-
inclusions: Implications for the internal evolution of rare-
ing up in the tailings pile. In addition, the separation would element granitic pegmatites, Can. Mineral., 39, 1513–1527,
help to reduce the volume of acid-generating mine tailings. https://doi.org/10.2113/gscanmin.39.6.1513, 2001.
Since pyrite is a natural semiconductor and its electrochemi- Berkh, K., Rammlmair, D., Drobe, M., and Meima, J.: Case
cal properties can be modified by a Co substitution, quantita- Study: Geochemistry and Mineralogy of Copper Mine
tive Raman analyses for composition and qualitative analyses Tailings in Northern Central-Chile, ICAM, 14, 37–40,
for crystallinity, strain, and stress of the Co-doped pyrite can https://doi.org/10.1007/978-3-030-22974-0_9, 2019.
be interesting for the semiconductor industries. Lastly, non- Bouchard, R. J.: The preparation of pyrite solid solutions of the
destructive and micro-Raman mapping technique could have type Fex Co1−x S2 , Cox Ni1−x S2 , and Cux Ni1−x S2 , Mater. Res.
important applications in the study of ore genesis. Bull., 3, 563–570, https://doi.org/10.1016/0025-5408(68)90087-
1, 1968.
Bralia, A., Sabatini, G., and Troja, F.: A revaluation of the Co/Ni ra-
tio in pyrite as geochemical tool in ore genesis problems, Miner.
Data availability. All raw data can be provided by the correspond-
Deposita, 14, 353–374, https://doi.org/10.1007/BF00206365,
ing author upon request.
1979.
Brooker, M. H. and Wang, J.: Raman and infrared studies of lithium
and cesium carbonates, Spectrochim. Acta A.-M., 48, 999–1008,
Supplement. The supplement related to this article is available on- https://doi.org/10.1016/0584-8539(92)80176-W, 1992.
line at: https://doi.org/10.5194/ejm-34-259-2022-supplement. Bryant, R. N., Pasteris, J. D., and Fike, D. A.: Variability in the Ra-
man Spectrum of Unpolished Growth and Fracture Surfaces of
Pyrite Due to Laser Heating and Crystal Orientation, Appl. Spec-
Author contributions. KB performed the data collection and evalu- trosc., 72, 37–47, https://doi.org/10.1177/0003702817736516,
ation. KB wrote the manuscript with input from DR. Both authors 2018.
discussed and interpreted the results. Cook, N., Ciobanu, C. L., George, L., Zhu, Z.-Y., Wade, B., and
Ehrig, K.: Trace Element Analysis of Minerals in Magmatic-
Hydrothermal Ores by Laser Ablation Inductively-Coupled
Competing interests. The contact author has declared that neither Plasma Mass Spectrometry: Approaches and Opportunities,
they nor their co-author has any competing interests. Minerals, 6, 111, https://doi.org/10.3390/min6040111, 2016.
del Real, I., Thompson, J. F. H., Simon, A. C., and Reich, M.: Geo-
chemical and Isotopic Signature of Pyrite as a Proxy for Fluid
Disclaimer. Publisher’s note: Copernicus Publications remains Source and Evolution in the Candelaria-Punta del Cobre Iron Ox-
neutral with regard to jurisdictional claims in published maps and ide Copper-Gold District, Chile, Econ. Geol., 115, 1493–1518,
institutional affiliations. https://doi.org/10.5382/econgeo.4765, 2020.
Elliott, N.: Interatomic Distances in FeS2 , CoS2 , and NiS2 , J.
Chem. Phys., 33, 903–905, 1960.
Acknowledgements. We thank Simon Goldmann and Chris- Feng, J., Tian, H., Huang, Y., Ding, Z., and Yin, Z.: Direc-
tian Wöhrl for excellent support during the EPMA, Do- tional Oxidation of Pyrite in Acid Solution, Minerals, 9, 7,
minic Göricke for great technical support, Donald Henry and An- https://doi.org/10.3390/min9010007, 2019.
toine Fourrière for sample preparation, and Malte Drobe for provid- Ferrer, I. J., Nevskaia, D. M., de las Heras, C., and Sánchez, C.:
ing rock samples at the Federal Institute for Geosciences and Nat- About the band gap nature of FeS2 as determined from optical
ural Resources. We also thank anonymous reviewers and the editor and photoelectrochemical measurements, Solid State Commun.,
74, 913–916, https://doi.org/10.1016/0038-1098(90)90455-K,
1990.
https://doi.org/10.5194/ejm-34-259-2022 Eur. J. Mineral., 34, 259–274, 2022274 K. Berkh and D. Rammlmair: The effect of Co substitution on the Raman spectra of pyrite Foucher, F., Guimbretière, G., Bost, N., and Westall, F.: Petrograph- Nasdala, L., Smith, D. C., Kaindl, R., and Ziemann, M. A.: Raman ical and Mineralogical Applications of Raman Mapping, in: Ra- spectroscopy: Analytical perspectives in mineralogical research, man Spectroscopy and Applications, edited by: Maaz, K., In- in: Spectroscopic methods in mineralogy, edited by: Beran, A. TechOpen publishing, 163–180, https://doi.org/10.5772/65112, and Libowitzky, E., Mineralogical Society of Great Britain and 2017. Ireland, https://doi.org/10.1180/EMU-notes.6.7, 2004. Fujioka, Y., Frantti, J., Puretzky, A., and King, G.: Osadchii, E. and Gorbaty, Y.: Raman spectra and Raman Study of the Structural Distortion in the unit cell parameters of sphalerite solid solutions Ni1−x Cox TiO3 Solid Solution, Inorg. Chem., 55, 9436–9444, (Fex Zn1−x S), Geochim. Cosmochim. Ac., 74, 568–573, https://doi.org/10.1021/acs.inorgchem.6b01693, 2016. https://doi.org/10.1016/j.gca.2009.10.022, 2010. Goodwin, R., Corben, R., and Holland, L.: NI 43-101 Technical Pacˇevski, A., Libowitzky, E., Zˇivkovic´, P. A., Dimitrije- Report for the Punitaqui Project located near Ovalle, Chile, JDS vic´, R., and Cvetkovic´, L.: Copper-bearing pyrite from Energy & Mining Inc., Vancouver, 2018. the Coka Marin polymetallic deposit, Serbia: Mineral inclu- Grant, H. L. J., Hannington, M. D., Petersen, S., Frische, M., and sions or true solid solution?, Can. Mineral., 46, 249–261, Fuchs, S. H.: Constraints on the behavior of trace elements in https://doi.org/10.3749/canmin.46.1.249, 2008. the actively-forming TAG deposit, Mid-Atlantic Ridge, based Pratt, J. L. and Bayliss, P.: Crystal-structure refinement on LA-ICP-MS analyses of pyrite, Chem. Geol., 498, 45–71, of cattierite, Z. Krist.-Cryst. Mater., 150, 163–168, https://doi.org/10.1016/j.chemgeo.2018.08.019, 2018. https://doi.org/10.1524/zkri.1979.150.14.163, 1979. Hope, G. A., Woods, R., and Munce, C. G.: Raman micro- Sillitoe, R. H. and Thompson, J. F. H.: Intrusion–Related probe mineral identification, Miner. Eng., 14, 1565–1577, Vein Gold Deposits: Types, Tectono-Magmatic Settings and https://doi.org/10.1016/S0892-6875(01)00175-3, 2001. Difficulties of Distinction from Orogenic Gold Deposits, Kinner, T., Bhandari, K. P., Bastola, E., Monahan, B. M., Hau- Resour. Geol., 48, 237–250, https://doi.org/10.1111/j.1751- gen, N. O., Roland, P. J., Bigioni, T. P., and Ellingson, 3928.1998.tb00021.x, 1998. R. J.: Majority Carrier Type Control of Cobalt Iron Sulfide Sourisseau, C., Cavagnat, R., and Fouassier, M.: The vibrational (Cox Fe1−x S2 ) Pyrite Nanocrystals, J. Phys. Chem. C, 120, properties and valence force fields of FeS2 , RuS2 pyrites 5706–5713, https://doi.org/10.1021/acs.jpcc.5b11204, 2016. and FeS2 marcasite, J. Phys. Chem. Solids, 52, 537–544, Klemm, D. D.: Synthesen und Analysen in den Dreiecks- https://doi.org/10.1016/0022-3697(91)90188-6, 1991. diagrammen FeAsS–CoAsS–NiAsS und FeS2 – Ushioda, S.: Raman scattering from phonons in iron CoS2 –NiS2 , Neues Jb. Miner. Abh., 103, 205–255, pyrite (FeS2 ), Solid State Commun., 10, 307–310, https://doi.org/10.1127/njma/103/1965/205, 1965. https://doi.org/10.1016/0038-1098(72)90013-0, 1972. Kleppe, A. K. and Jephcoat, A. P.: High-pressure Raman spec- Vogt, H., Chattopadhyay, T., and Stolz, H. J.: Complete first- troscopic studies of FeS2 pyrite, Mineral. Mag., 68, 433–441, order Raman spectra of the pyrite structure compounds FeS2 , https://doi.org/10.1180/0026461046830196, 2004. MnS2 AND SiP2 , J. Phys. Chem. Solids, 44, 869–873, Kodera, P., Murphy, P. J., and Rankin, A. H.: Retrograde min- https://doi.org/10.1016/0022-3697(83)90124-5, 1983. eral reactions in saline fluid inclusions: The transformation White, S. N.: Laser Raman spectroscopy as a tech- ferropyrosmalite ? clinopyroxene, Am. Mineral., 88, 151–158, nique for identification of seafloor hydrothermal and https://doi.org/10.2138/am-2003-0118, 2003. cold seep minerals, Chem. Geol., 259, 240–252, Kwon, S. K., Youn, S. J., and Min, B. I.: Itinerant ferromag- https://doi.org/10.1016/j.chemgeo.2008.11.008, 2008. netism in half-metallic CoS2 , Phys. Rev. B, 62, 357–360, Xian, Y.-J., Wen, S.-M., Chen, X.-M., Deng, J.-S., and Liu, https://doi.org/10.1103/PhysRevB.62.357, 2000. J.: Effect of lattice defects on the electronic structures and Libowitzky, E.: Anisotropic pyrite: A polishing effect, Phys. Chem. floatability of pyrites, Int. J. Min. Met. Mater., 19, 1069, Miner., 21, 97–103, https://doi.org/10.1007/BF00205220, 1994. https://doi.org/10.1007/s12613-012-0672-5, 2012. Lutz, H. D. and Willich, P.: Gitterschwingungsspektren. IX. Yuan, X. and Zheng, H.: In situ Raman spectroscopic stud- Pyritstruktur. FIR-Spektren und Normalkoordinatenanalyse von ies of FeS2 pyrite up to 675 K and 2100 MPa using a hy- MnS2 , FeS2 und NiS2 , Z. Anorg. Allg. Chem., 405, 176–182, drothermal diamond anvil cell, Mineral. Mag., 79, 1–10, 1974. https://doi.org/10.1180/minmag.2015.079.1.01, 2015. Lutz, H. D. and Zwinscher, J.: Lattice dynamics of pyrite Zhou, L., McKenna, C. A., Long, D. G. F., and Kamber, B. S.: FeS2 polarizable-ion model, Phys. Chem. Miner., 23, 497–502, LA-ICP-MS elemental mapping of pyrite: An application to the https://doi.org/10.1007/bf00241999, 1996. Palaeoproterozoic atmosphere, Precambrian Res., 297, 33–55, Macfarlane, R. M., Ushioda, S., and Blazey, K. W.: Resonant Ra- https://doi.org/10.1016/j.precamres.2017.05.008, 2017. man scattering from FeS2 (pyrite), Solid State Commun., 14, Zhu, Q., Cook, N. J., Xie, G., Wade, B. P., and Ciobanu, 851–855, 1974. C. L.: Arsenic-induced downshift of Raman band Mernagh, T. P. and Liu, L.-G.: Raman spectra from the Al2 SiO5 positions for pyrite, Econ. Geol., 115, 1589–1600, polymorphs at high pressures and room temperature, Phys. https://doi.org/10.5382/econgeo.4770, 2020. Chem. Miner., 18, 126–130, 1991. Mernagh, T. P. and Trudu, A. G.: A laser Raman microprobe study of some geologically important sulphide minerals, Chem. Geol., 103, 113–127, https://doi.org/10.1016/0009-2541(93)90295-T, 1993. Eur. J. Mineral., 34, 259–274, 2022 https://doi.org/10.5194/ejm-34-259-2022
You can also read