Probabilistic characterisation of coastal storm-induced risks using Bayesian networks
←
→
Page content transcription
If your browser does not render page correctly, please read the page content below
Nat. Hazards Earth Syst. Sci., 21, 219–238, 2021
https://doi.org/10.5194/nhess-21-219-2021
© Author(s) 2021. This work is distributed under
the Creative Commons Attribution 4.0 License.

Probabilistic characterisation of coastal storm-induced risks
using Bayesian networks
Marc Sanuy and Jose A. Jiménez
Laboratori d’Enginyeria Marítima, Universitat Politècnica de Catalunya, BarcelonaTech,
c/Jordi Girona 1–3, Campus Nord ed D1, 08034 Barcelona, Spain

Correspondence: Marc Sanuy (marc.sanuy@upc.edu)

Received: 31 March 2020 – Discussion started: 11 May 2020
Revised: 18 November 2020 – Accepted: 1 December 2020 – Published: 22 January 2021

Abstract. A probabilistic estimation of hazards based on           1   Introduction
the response approach requires assessing large amounts of
source characteristics, representing an entire storm climate.      The coastal fringe is a highly dynamic zone and one of the
In addition, the coast is a dynamic environment, and factors       most fragile terrestrial areas due to high population, dense
such as existing background erosion trends require perform-        infrastructure, intense economic activities, and endangered
ing risk analyses under different scenarios. This work applies     natural habitats. The progressive occupation of coastal ar-
Bayesian networks (BNs) following the source–pathway–              eas increasingly exposes them to storm-induced hazards,
receptor–consequence scheme aiming to perform a proba-             such as inundation and erosion (IPCC, 2012, 2013). This,
bilistic risk characterisation at the Tordera delta (NE Spain).    together with future projections of rising sea levels (Vous-
One of the main differences of the developed BN framework          doukas et al., 2016; IPCC, 2018), long-term shoreline re-
is that it includes the entire storm climate (all recorded storm   treat (Vousdoukas et al., 2020), changes in storminess (Li-
events, 179 in the study case) to retrieve the integrated and      onello et al., 2008; Conte and Lionello, 2013; IPCC, 2014),
conditioned risk-oriented results at individually identified re-   and/or changes in the directionality of incoming waves
ceptors (about 4000 in the study case). Obtained results high-     (Cases-Prat and Sierra, 2013), highlights the need for local-
light the storm characteristics with higher probabilities to in-   scale risk assessments considering these current and future
duce given risk levels for inundation and erosion, as well         scenarios. In the NW Mediterranean Basin, storm-induced
as how these are expected to change under given scenarios          damages at the Catalan coast have increased during the
of shoreline retreat due to background erosion. As an exam-        last decades as a result of increased exposure along the
ple, storms with smaller waves and from secondary incom-           coastal zone and the progressive narrowing of the existing
ing direction will increase erosion and inundation risks at the    beaches (Jiménez et al., 2012). All these elements have de-
study area. The BNs also output probabilistic distributions of     termined that current and future coastal management plans
the different risk levels conditioned to given distances to the    will require a specific chapter on coastal risks as recog-
beach inner limit, allowing for the definition of probabilistic    nised in the Protocol of Integrated Coastal Zone Manage-
setbacks. Under current conditions, high and moderate in-          ment in the Mediterranean (UNEP/MAP/PAP, 2008). One of
undation risks, as well as direct exposure to erosion can be       the most used approaches in risk assessment is the source–
reduced with a small coastal setback (∼ 10 m), which needs         pathway–receptor–consequence (SPRC) framework (Sayers
to be increased up to 20–55 m to be efficient under future         et al., 2002; Narayan et al., 2014; Oumeraci et al., 2015).
scenarios (+20 years).                                             This is a conceptual model describing the propagation of
                                                                   risk across a given domain from the source to the receptors.
                                                                   When applied to storm-induced coastal risks, it is generally
                                                                   schematised in terms of a source (storms) that propagates
                                                                   and interacts with a pathway (beach or coastal morphology)
                                                                   where hazards (i.e. inundation and erosion) are generated.

Published by Copernicus Publications on behalf of the European Geosciences Union.
220                 M. Sanuy and J. A. Jiménez: Probabilistic characterisation of coastal storm-induced risks using BNs

These affect the receptors (elements of interest), inducing        the methodology and its different steps, and Sect. 4 presents
different consequences. When addressing the problem at the         the obtained risk characterisation at the Tordera delta; results
local scale (∼ 5–10 km), storm-induced hazards are usually         are discussed in Sect. 5, and the main conclusions are sum-
assessed by using detailed process-based models that are fed       marised in Sect. 6.
information on both the source and the pathway. Recent stud-
ies use the capabilities of Bayesian networks (BNs) to assess
consequences at the receptor scale, as they can easily handle      2   Study area and data
multidimensional problems while dealing with large amounts
of data allowing the assessment of multiple source condi-          The Catalan coast is located in the NW Mediterranean Sea
tions, hazards, and scenarios (e.g. Van Verseveld et al., 2015;    (Fig. 1). The coastline extends to nearly 600 km with about
Poelhekke et al., 2016; Plomaritis et al., 2018; Sanuy et al.,     280 km of beaches. Storm-induced issues are present along
2018). BNs allow the analysis of conditional dependencies          the entire coastline and are especially concentrated in loca-
between variables and therefore can be used to reproduce the       tions with the largest decadal-scale shoreline erosion rates
causal relationships inherent in the SPRC scheme (Jäger et         (Jiménez et al., 2011; Jiménez and Valdemoro, 2019). A
al., 2018).                                                        good example of such an area is the Tordera delta, located ap-
   In this context, this work presents the development of a        proximately 50 km north of Barcelona (Jiménez et al., 2018)
fully probabilistic BN-based SPRC approach to assess storm-        (Fig. 1). The deltaic coast is a highly dynamic area com-
induced risks at a local scale. To illustrate the methodology,     posed of coarse sediment and extends to about 5 km, from
the BN approach is applied to characterise coastal risks at        s’Abanell beach at the northern end to Malgrat de Mar beach
the Tordera delta, a highly dynamic area that is vulnerable to     in the south (Fig. 1). It is currently retreating because of the
the impact of extreme coastal storms (Jiménez et al., 2018).       net longshore sediment transport directed southwest and the
Risks related to storm-induced erosion and inundation were         decrease in Tordera river sediment supplies. Consequently,
assessed using current morphology and future configurations        the beaches surrounding the river mouth are being signifi-
considering the existing trends of shoreline retreat due to        cantly eroded (Jiménez et al., 2011, 2018; Sardá et al., 2013),
background erosion (Jiménez et al., 2019). The approach as-        and the frequency of inundation episodes and damage to
sesses the storm characteristics associated with the spatially     existing infrastructure (beach promenade, campsite installa-
variable risks and characterises the alongshore and cross-         tions, roads, etc.) has significantly increased since the begin-
shore spatial distribution of given levels of risk under differ-   ning of the 1990s (Jiménez et al., 2011; Sardá et al., 2013)
ent scenarios. For this purpose, all available storms derived      (Fig. 1). The area is composed of multiple campsites that rep-
from a long dataset (60 years) of wave time series were sim-       resent the main economical activity of the municipality and
ulated by the XBeach model (Roelvink et al., 2009) and the         was identified as a regional coastal hotspot to erosion and
induced hazards analysed. Receptor characterisation was in-        inundation in Jiménez et al. (2018). Therefore, it is the pro-
dividually performed as described in Sanuy et al. (2018). The      totype of the study area where detailed risk assessments are
inundation risk was assessed in terms of relative damage to        needed at the local scale to support decision-making.
structures and risk to life, while the erosion risk was assessed      To spatially characterise the risk of the area as a function of
as a function of the loss of protective capacity of the coast in   the variability of the local geomorphology and coastline ori-
front of the receptors. The inclusion in the BN of simula-         entation at both sides of the river mouth, five different sectors
tion results from a long dataset of storms allows for a fully      along the coast were defined (Fig. 1). Two of them, SBN and
stochastic assessment in terms of wave climate characterisa-       SBM, are located northwards of the river mouth (Fig. 1), with
tion. This is a novelty with respect to existing studies (e.g.     SBM being limited to the south by the river mouth. The main
Van Verseveld et al., 2015; Plomaritis et al., 2018; Ferreira et   distinctive feature of SBN is the existence of a promenade
al., 2019; Sanuy et al., 2018). Although some of these studies     limiting the inner part of the beach. Southwards of the river,
introduce copula assessments on source (storm) characteris-        there are three sectors (Fig. 1): MSM, which is closest to the
tic variables to generate synthetic events, the training subsets   mouth; MS1, which is located southwards of a coastal revet-
aimed at covering the whole range of possible storm condi-         ment; and MS2, which is located furthest to the south, with
tions rather than statistically representing the existing storm    wider beaches, and sheltered against eastern storm waves,
climate. In addition, the applied method follows the idea be-      which are dominant in the area (Mendoza et al., 2011).
hind the response approach (Garrity et al., 2006, Sanuy et            The data used to represent the morphology of the study
al., 2020b), simulating erosion and inundation hazard for the      area are comprised of lidar-derived topography provided by
whole population of events, while simulating the storms us-        the Institut Cartogràfic i Geológic de Catalunya, as a high-
ing their real shapes (i.e. storm evolution with time), and thus   resolution digital elevation model (DEM) with 1 m × 1 m
avoiding the uncertainties introduced by the use of a syn-         grid cells and a vertical precision of 5–6 cm (Ruiz et al.,
thetic representation of the events (Duo et al., 2020).            2009). Bathymetry obtained from multi-beam surveys pro-
   The structure of the paper is as follows: Sect. 2 presents      vided by the Ministry of Agriculture, Fish, Food, and Envi-
the study area with the main data sources, Sect. 3 outlines        ronment was also used.

Nat. Hazards Earth Syst. Sci., 21, 219–238, 2021                                    https://doi.org/10.5194/nhess-21-219-2021
M. Sanuy and J. A. Jiménez: Probabilistic characterisation of coastal storm-induced risks using BNs                                    221

Figure 1. Main locations and characteristics of the study site: (a) location of the Tordera delta, XBeach model domain (red), location of
model boundary conditions (yellow, Downscaled Ocean Waves and Global Ocean Surge datasets, Camus et al., 2013), receptors of interest
(orange) and Tordera wave buoy (light blue); (b) digital elevation model (DEM) of the Tordera delta; (c) wave rose at the Tordera delta buoy
(Global Ocean Waves; Reguero et al., 2012); (d) receptor areas for the local risk assessment. Orthophoto provided by Institud Cartogràgic I
Geològic de Catalunay (ICGC).

   To characterise the forcing, the present work used hindcast          3     Methodology
waves from the Downscaled Ocean Waves dataset (Camus et
al., 2013) derived from the Global Ocean Waves (Reguero                 3.1    General framework
et al., 2012). Hindcast surge from the Global Ocean Surge
dataset (Cid et al., 2014), obtained at four locations close to
the Tordera delta at ∼ 20 m depth, covering the period from             The methodology used in this work adapts the general ap-
1954–2014 (Fig. 1), was also used. The simultaneous astro-              proach of Jäger et al. (2018), where BNs were applied to
nomical tide was added to the Global Ocean Sampling (GOS)               implement the SPRC framework to assess storm-induced
dataset to obtain the total water level. The astronomical tidal         coastal risks. This approach has been previously imple-
range in the study area was about 0.25 m.                               mented by Sanuy et al. (2018) at the Tordera delta to com-
                                                                        pare, in a deterministic manner, different risk reduction mea-
                                                                        sures. In this work, the scheme was upgraded to a fully prob-
                                                                        abilistic risk characterisation and consisted of the following
                                                                        steps.

https://doi.org/10.5194/nhess-21-219-2021                                          Nat. Hazards Earth Syst. Sci., 21, 219–238, 2021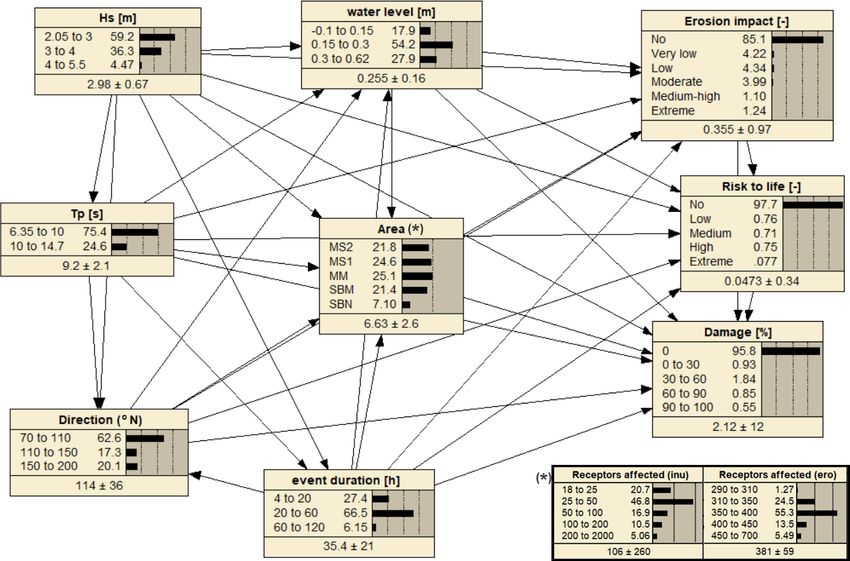
222                M. Sanuy and J. A. Jiménez: Probabilistic characterisation of coastal storm-induced risks using BNs

  i Storm characterisation. This step consisted of defining        3.2   Storm characterisation
    the local storm climate from long-term wave time se-
    ries. This stage corresponded to the (probabilistic) char-     Coastal storms have been identified from wave time series
    acterisation of the source. In practice, the result of this    by employing the peak-over-threshold (POT) method using a
    step was a storm dataset containing the hourly evolution       double threshold criterion as in Sanuy et al. (2020b). The first
    of wave parameters during each event for a long period         threshold, the 0.98 quantile (Hs = 2 m, in agreement with
    (multiple decades).                                            Class 1 storms in Mendoza et al., 2011, for NW Mediter-
                                                                   ranean conditions), is used to identify storm start and end
  ii Hazard assessment. Once the forcing was characterised,        times and thus controls the event duration and inter-event
     the next step was the assessment of the storm-induced         fair-weather periods. The second threshold, the 0.995 quan-
     hazards, i.e. erosion and inundation, which were sim-         tile (Hs = 2.6 m), is used to filter events that do not reach this
     ulated using a process-based morphodynamic model,             value at the peak and would not be significant in terms of
     XBeach. This stage corresponded to the characterisation       induced impacts. This second threshold retains only storms
     of the pathway. To ensure the probabilistic representa-       reaching Class 3 at the peak, which is the minimum storm
     tion of the hazards, this step was performed for all the      magnitude inducing hazardous coastal response (Mendoza et
     events of the storm dataset (first step) or for a subset of   al., 2011)
     events that ensures an equivalent representation of the          The obtained dataset is composed of 179 storms (∼ 3
     multivariant population representing the source.              storms per year), each being characterised by the hourly
                                                                   evolution of wave conditions (significant wave height, Hs;
                                                                   peak period, Tp; storm surge; wave direction; and directional
 iii Risk characterisation. In this step, simulated storm-         spreading). Of the 179 events, 43 correspond to multi-peak
     induced hazards across the study area were transformed        storms. These events occur when fair-weather conditions (Hs
     into risk values at the scale of individual receptors (ex-    below the first threshold) between consecutive peaks last less
     isting buildings and infrastructure). To this end, vulner-    than 72 h (Fig. 2); they are relatively frequent in this part of
     ability rules were defined as a function of the receptor      the NW Mediterranean (Mendoza et al., 2011). In 12 cases,
     typology and analysed hazard. In this stage, the receptor     storms are formed by three or more peak sequences, leading
     and consequence phases of the SPRC framework were             to a total number of 237 individual storm peaks. For each
     tackled.                                                      peak, we retain its duration, together with the total accumu-
                                                                   lated event duration, and the previous energy (e.g. single-
 iv Scenario definition. This step consisted of defining the       peak storms are always characterised as peaks with “peak
    conditions for the assessment in terms of geomorpho-           duration” equal to “event duration” and with “zero previous
    logical scenarios of interest. This might require repeat-      energy”). Although all this information is retained (Fig. 2),
    ing steps (ii) and (iii) for all identified storms in (i).     only event duration together with wave parameters and water
    Here, the entire storm dataset was used to characterise        level will be used as a BN variable here, for the sake of sim-
    the baseline scenario (current conditions), while the ad-      plicity in a risk-oriented perspective, while a more detailed
    ditional scenarios were assessed with a representative         source description may be necessary in morphological anal-
    subset to reduce the computational effort. The subset          yses.
    was also used to assess the baseline scenario to later ver-       To reduce the computational effort when assessing multi-
    ify that it statistically represents the same population as    ple scenarios, a storm subset is built aiming to maintain the
    the original dataset from the perspective of the obtained      statistical representativeness while avoiding the repetition of
    results (for the validation of the method).                    simulations of strongly similar storm conditions. The pro-
                                                                   cedure consists of grouping the main variables defining the
                                                                   storm (Hs, Tp, duration, and direction) in homogeneous in-
  v BN integration. The obtained results for each event at         tervals covering the entire range of local conditions (see Ta-
    the receptor scale were related to the variables char-         ble 1). Each storm from the dataset falls into one of the result-
    acterising the storms (e.g. bulk features) and receptor        ing 5 × 4 × 3 × 3 = 188 combinations of bulk characteristics.
    properties (e.g. location) and integrated within the BN.       Some combinations are populated with storms (48), while
    Therefore, the BN outputs risk probability distributions       others are empty groups (140), i.e. storm characteristics that
    accounted for the variability in the forcing conditions as     have not been recorded and, therefore, are not present in the
    well as the spatial distribution of receptors.                 storm dataset. This subdivision is only used for the purpose
                                                                   of deriving the subset, allowing finer detail in the source
   In the following sections, specific methods used in each        characteristics of the single-peak and multi-peak storms to
step to analyse the Tordera delta case study are presented.        be selected. Later, the BN will present a coarser binning of
Although some specificities are included, adopted methods          such variables, ensuring a better filling of the source variable
are general enough to be applicable at nearly any site.            combinations in the network.

Nat. Hazards Earth Syst. Sci., 21, 219–238, 2021                                    https://doi.org/10.5194/nhess-21-219-2021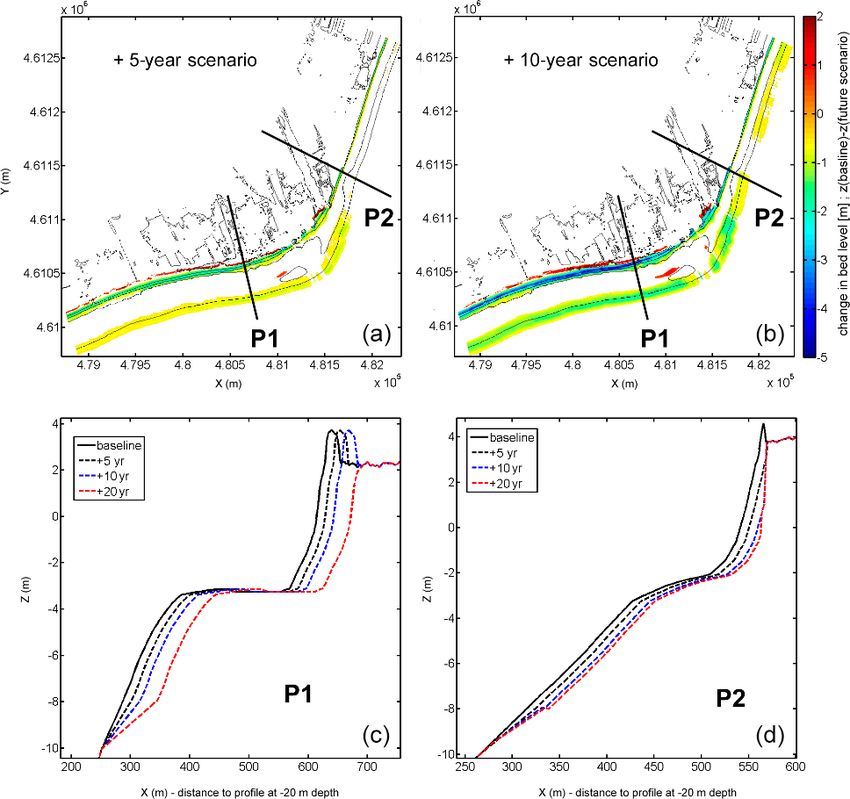
M. Sanuy and J. A. Jiménez: Probabilistic characterisation of coastal storm-induced risks using BNs                                  223

Figure 2. Scheme of a double-peak storm.

Table 1. Subset characteristics compared to the original storm           fects, all existing identified multi-peak storms in the original
dataset. Source variable combinations used to classify storms and        time series (43) were included in the subset. Their impact
select the subset events.                                                was simulated with the XBeach model saving the cumula-
                                                                         tive output after each peak. The impact after the first peak
                   Original dataset characteristics
                                                                         of such multi-peak events was used as proxy of equivalent
 179 storms    136 single-peak    43 multi-peak       237 storm peaks    single peaks already covering 22 source variable combina-
                       Subset characteristics                            tions. The other 26 combinations were covered by additional
                                                                         single-peak storms. Thus, the storm subset comprised of 69
  69 storms     26 single-peak    43 multi-peak       127 storm peaks    storms, including the 43 multi-peak storm events (see Ta-
              Variable combinations to produce subsets                   ble 1).
     Hs (m)              Tp (s)     Duration (h)       Direction (◦ N)
                                                                            The statistical representativeness of the subset with respect
                                                                         to the full storm dataset was tested using the methodology
        155
      4–4.5                                >60                           follow a normal distribution with expected value ni, k and
      >4.5                                                               variance σi,2 k (with “i” representing the bin and “k” the his-
                                                                         togram). Thus, the significance is defined as
                                                                               n̂i, 1 − n̂i, 2
                                                                         Ŝi = p                 ,                                    (1)
                                                                                 σ̂i, 1 + σ̂i, 2
   Therefore, to produce the subset, one storm is selected for
each combination populated with at least one event. To en-               where n̂i, k is an observed value at bin “i” of histogram “k”
sure a probabilistic representation of the source, the number            and σ̂i, k = n̂i, k . Therefore, we consider the root mean square
of storms belonging to each combination is counted for later             (RMS) of the distribution of significances as
use as a weight (multiplicity factor) when feeding the BN                           s
                                                                                      PM               2
with results from that event.                                                            i=1 (Ŝi − S)
   As was previously mentioned, one of the local character-              RMS =                           ,                             (2)
                                                                                                M
istics of the storm climate in the study area is the presence of
multi-peak storms. As the impact of successive storms sepa-              where S is the mean value of Ŝi and M is the number of
rated by relatively short fair-weather periods may be differ-            bins of the histogram. The RMS represents a distance mea-
ent to that of single events depending on storm characteris-             sure with the following interpretation: if RMS = 0, both his-
tics and initial beach configuration (e.g. Dissanayake et al.,           tograms are identical; if RMS = 0 ∼ 1 both histograms are
2015; Eichentopf et al., 2020), we retained these storms in              obtained from the same parent population; if RMS  1, his-
the analysis. Thus, to properly account for their potential ef-          tograms are obtained from different parent distributions. The

https://doi.org/10.5194/nhess-21-219-2021                                           Nat. Hazards Earth Syst. Sci., 21, 219–238, 2021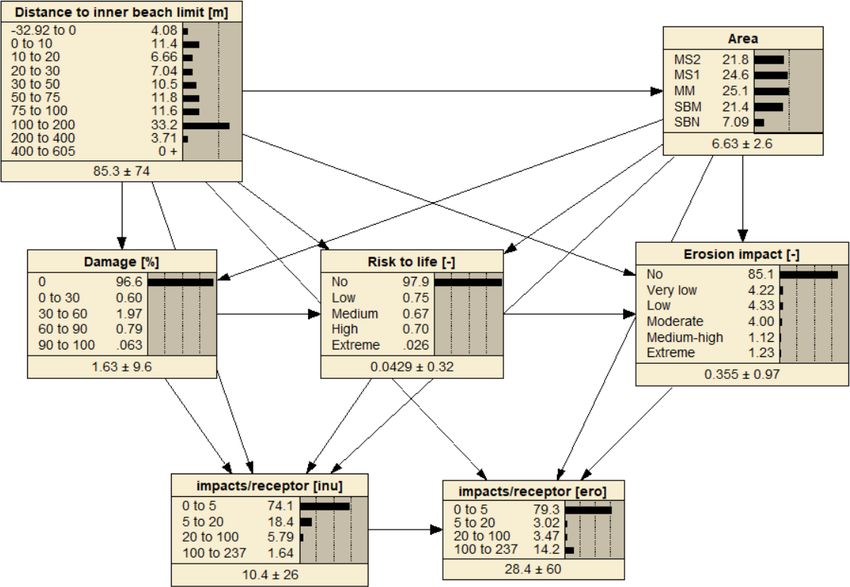
224                  M. Sanuy and J. A. Jiménez: Probabilistic characterisation of coastal storm-induced risks using BNs

method is applied to compare the output distributions result-         Table 2. Flood-damage curves to obtain relative damage to struc-
ing from training the BN with the whole dataset vs. training          tures using simulated inundation depth as input (Catalan Water
it with the subset.                                                   Agency, ACA, 2014).
   The statistics will be calculated for both BN inputs and
outputs (see following sections): (i) the distribution of un-                                        Relative damage (%)
constrained output risk variables; (ii) the distribution of Hs,             Inundation   Hard structures (road,       Soft structures
Tp, duration, direction, and water level constrained to the dif-             depth (M)    promenade, houses)      (campsite elements)
ferent risk levels per sector; and (iii) the risk distributions per
                                                                                     0                       0                     0
area and conditioned to the distance to the inner beach limit.
                                                                                 0–0.3                    18.3                    50
This involves the comparison of more than one variable out-                    0.3–0.6                    26.5                    71
put (e.g. impact results are always three variables), and there-               0.6–0.9                    33.2                    82
fore results are given as a mean and standard deviation.                       0.9–1.5                    44.7                    89
                                                                               1.5–2.1                    54.9                    91
3.3   Hazards assessment                                                         >2.1                     64.5                   100

Storm-induced hazards (erosion and flooding) have been
modelled using the XBeach model (Roelvink et al., 2009),              elements (e.g. bungalows) (Sanuy et al., 2018). To assess
which has been previously calibrated for the Tordera delta            the flooding-induced risk, the relative damage to receptors
(see Sanuy and Jiménez, 2019). The calibration of the model           is calculated using flood-damage curves (Table 2) using the
achieved a Brier skill score (BSS) (Sutherland et al., 2014)          maximum-modelled water depth within the receptor poly-
of 0.68. The model was implemented using a curvilinear                gon. No specific damage curves are available for the Cata-
grid with a variable cell size around the Tordera river mouth         lan coast, and due to this we used the curves recommended
(Fig. 1). The extension of the mesh is approximately 1.5 km           and used by the Catalan Water Agency (ACA, 2014) for the
in the cross-shore direction, with a cell size ranging from 5–        development of inundation management plans. Risk to life
6 m at the offshore boundary (20 m depth) to 0.7–0.8 m at the         has also been included in the assessment by using the water-
swash zone. In the alongshore direction, the model has an             depth–velocity product as input (Table 3, Priest et al., 2007)
extension of 4.5 km with cell size ranging from 25 m at the           within the receptor’s boundaries. For the erosion hazard, the
lateral boundaries 2–3 m around the river mouth. Storm in-            magnitude of the associated risk is based on the distance from
put consists of time series of wave conditions characterising         the significantly eroded XBeach nodes to the receptors. Sig-
each storm obtained from the DOW dataset at the four nodes            nificant erosion was set to 0.25 m of the vertical bed level
at the offshore boundary (Fig. 1), with a time step of 1 h,           change and assumed as the common minimum depth for light
which is the time resolution of the original data. The model          structure foundations. The closest distance from the receptor
was used to simulate storm-induced hazards under 455 dif-             corners to that erosion level was compared with the erosion
ferent events, which correspond to 179 original storms, plus          risk thresholds indicated by Jiménez et al. (2018) (Table 4).
a subset composed of 69 storms under four different scenar-              Therefore, the result of each simulation (hazard maps) was
ios. The XBeach model outputs used for the subsequent risk            transformed into a risk value at the individual receptor. Fig-
calculations were maxzs for water depth with accompanying             ure 3 shows an example of simulated inundation water depth
u, v components of the water velocity (inundation hazard)             for a long return period event and its transformation into
and sedero for bed level change (erosion hazard).                     relative inundation damages to receptors: none (0 %), low
                                                                      (0 %–30 %), moderate (30 %–60 %), high (60 %–90 %), and
3.4   Risks                                                           extreme (>90 %). Figure 4 shows, for the same event, re-
                                                                      sults corresponding to the erosion hazard. Individual results
To assess the induced risk, first, receptors in the study area        were stored at each of the ∼ 4000 receptors for each of the
are individually considered by their footprint polygons (∼            simulated events, leading to a total number of 716 000 and
4000) and delineated using a Geographic Information Sys-              276 000 cases to feed the BN with the entire dataset and with
tems (GIS)-based tool to account for their exact position and         the subset, respectively.
dimension. Once they are defined, a direct correspondence
between each receptor with the underlying XBeach model                3.5     Scenario definition
mesh is available in such a way that each receptor is asso-
ciated with the model nodes directly affecting it (see Figs. 3        When assessing risks in coastal areas under changing con-
and 4).                                                               ditions, it is necessary to consider these potential varia-
   The vulnerability of each receptor is individually charac-         tions in the assessment; otherwise, its utility for medium–
terised as a function of their structural properties. Receptors       long-term risk management will be limited. Here, future
in the study area comprise hard constructions, such as houses         morphological scenarios are defined to consider the back-
and infrastructures, and softer elements, such as campsite            ground erosion in the area. As previously mentioned, the

Nat. Hazards Earth Syst. Sci., 21, 219–238, 2021                                         https://doi.org/10.5194/nhess-21-219-2021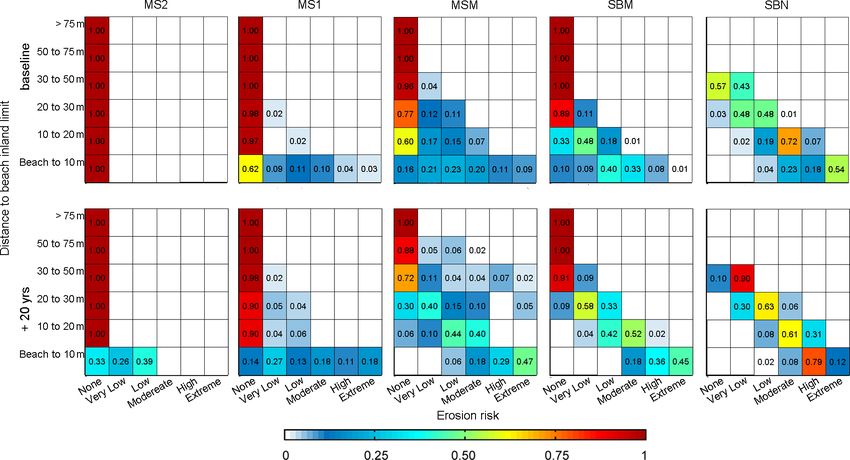
M. Sanuy and J. A. Jiménez: Probabilistic characterisation of coastal storm-induced risks using BNs                                      225

Figure 3. Example of transformation from inundation hazard to risk. Storm event of November 2001, Hs = 5.4 m, Tp = 13 s, eastern direction,
and 96 h of event duration. Lidar provided by Institud Cartogràgic I Geològic de Catalunay (ICGC).

Table 3. Risk to life calculated as a function of the product between   Table 4. Erosion risk as a function of the distance from the receptors
water depth and flow velocity (Priest et al., 2007).                    to erosion magnitudes greater than 0.25 m of bed level change. A
                                                                        distance of 7.5 m corresponds to the expected retreat for the 10-year
                    Flood depth–       Risk to                          return period (Jiménez et al., 2018).
                    velocity (m2 /s)   life
                                                                                            Erosion risk     Distance to
                    0–0.25             None                                                 level           receptor (m)
                    0.25–0.5           Low
                    0.5–1.1            Moderate                                             None                    >30
                    >1.1               High                                                 Very low             22.5–30
                                                                                            Low                  15–22.5
                                                                                            Moderate              7.5–15
                                                                                            High                   3–7.5
                                                                                            Extreme                  0–3
study area is a highly dynamic sedimentary environment
subjected to a background coastal retreat (Jiménez et al.,
2018). Thus, in this step, different scenarios characteris-
ing future configurations were built based on the expected              evolution trends remain constant during the timeframe of the
future coastal changes. This was accomplished by using                  analysis, which is limited to 20 years. However, this could
decadal-scale background erosion rates estimated for the dif-           be substituted by time-varying evolution rates provided this
ferent beach sectors by Jiménez and Valdemoro (2019) by                 should be the case.
analysing shoreline changes from aerial photographs. The                   Thus, to account for this background response, each sce-
estimated average shoreline retreat at each sector is 1.1, 4.0,         nario was defined based on a given coastal morphology at a
and 1.9 m/yr at SBN and SBM, MSM and MS1, and MS2, re-                  given time horizon. The baseline morphology, which corre-
spectively (see Fig. 1 for locations). It is assumed that current       sponds to the current scenario, is the one described in Sect. 2

https://doi.org/10.5194/nhess-21-219-2021                                         Nat. Hazards Earth Syst. Sci., 21, 219–238, 2021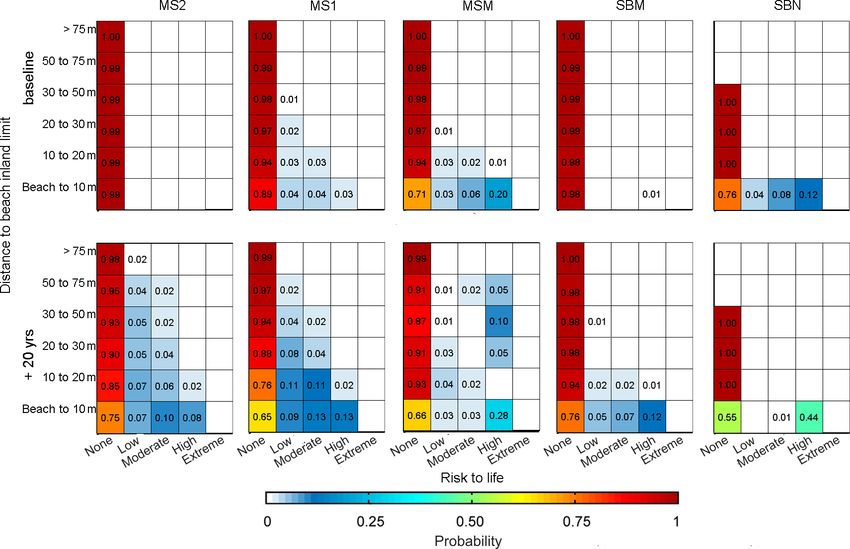
226                 M. Sanuy and J. A. Jiménez: Probabilistic characterisation of coastal storm-induced risks using BNs

Figure 4. Example of transformation from erosion hazard to risk. Storm event of November 2001, Hs = 5.4 m, Tp = 13 s, eastern direction,
and 96 h of event duration. Orthophoto provided by Institud Cartogràgic I Geològic de Catalunay (ICGC).

(Fig. 1) that was directly measured. Future coastal morpholo-         sults in a continuous retreat of P1 for all scenarios, whereas
gies for each scenario corresponding to different time hori-          the retreat of P2 is limited at the beach after 10 years.
zons (+5 years; +10 years; and +20 years) were built by
retreating the active part of the shoreface, from a −10 m             3.6   Bayesian network integration
depth to the subaerial beach, according to erosion rates at
the different areas. This hypothesis about the shape of long-         The BNs are probabilistic models based on acyclic graph the-
term (decadal) profile changes follows the hypothesis ap-             ory and Bayes’ theorem (Pearl, 1988; Jensen, 1996). They
plied in shoreline evolution models, i.e. a parallel displace-        have demonstrated their versatility and utility in efficiently
ment of the active profile from the emerged beach down to             combining multiple variables to predict system behaviour.
the depth of closure (e.g. Hanson, 1989). To ensure along-            Within the context of this work, they can be used to represent
shore smoothness after retreating, linear transitions between         the SPRC scheme through the dependency relations between
sectors affected by different retreat rates were applied. Re-         the different steps (see e.g. Straub, 2005; Jäger et al., 2018).
sulting configurations for two scenarios are shown in Fig. 5,         In this sense, they can easily be adapted to assess different
along with example profiles at locations under different lev-         natural hazards and their impacts on many kinds of recep-
els of background retreat. Local constraints due to the lack          tors, for both descriptive as well as predictive applications
of accommodation space due to the existence of hard struc-            (see e.g. Beuzen et al., 2018b).
tures at the hinterland were also considered. When the shore-            In this work, two BN configurations were used to char-
line reaches a fixed structure limiting the landward transla-         acterise the system response to the impact of coastal storm
tion, it is assumed that, locally, the beach disappears and, in       events. This was done to optimise the BN structure by lim-
consequence, no further profile retreat will occur. As an ex-         iting the number of variables per network while solving the
ample, Fig. 5 shows the beach profile retreat at two locations        different parts of the SPRC framework. In practice, one BN
with different hinterland characteristics: P1 has no hard limit,      solved the source–consequence relationships (BN-A), while
whereas P2 is limited at the back by a promenade. This re-            the other characterised the receptor–consequence spatial dis-

Nat. Hazards Earth Syst. Sci., 21, 219–238, 2021                                        https://doi.org/10.5194/nhess-21-219-2021
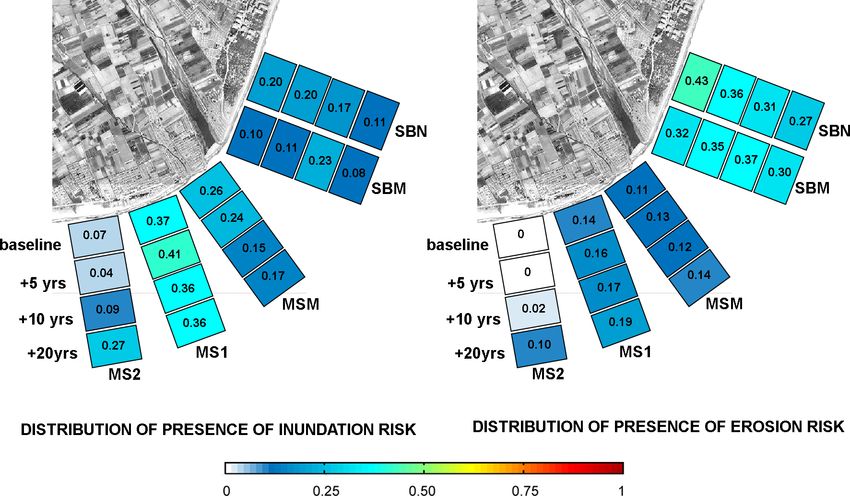
M. Sanuy and J. A. Jiménez: Probabilistic characterisation of coastal storm-induced risks using BNs                                      227

Figure 5. Changes in the bed level grid for the future scenarios. Difference between baseline bed level and scenario bed level (a, b). Profile
retreat at both sides of the river mouth at the different time horizons (c, d). P1 belongs to MS1 (retreat of 4 m/yr) and P2 belongs to SBM
(retreat of 1.1 m/yr).

tribution (BN-B), providing complementary information on                 introduced in the BN as an additional storm characteristic
the local risk profile.                                                  variable. To characterise the extension of inundation, all re-
   BN-A (Fig. 6) links storm-defining variables (Hs, Tp, du-             ceptors presenting a relative damage other than 0 % or a risk
ration, direction, and water level) and impacts to the recep-            to life other than “none” were counted. Similarly, to char-
tors (erosion impact, risk to life, and structural relative dam-         acterise the extension of erosion, all receptors presenting an
age). The central variable of the network (indicated by ∗ in             impact level different than “none” were counted. In practi-
Fig. 6) was used to perform conditioned assessments. De-                 cal terms, this means that, in general, the number of affected
pending on the objective of the analysis, it can be (i) the              receptors by erosion was larger than by inundation. This is
total number of affected receptors by inundation within a                because, with the used criteria, it is quite probable to have
storm event; (ii) total number of affected receptors by ero-             receptors affected by “very low” to “moderate” erosion risks
sion within a storm event, or (iii) receptor area (SBN, SBM,             representing the loss of protection provided by the beach, al-
MSM, MS1, and MS2), as shown in Fig. 6. To account for                   though this does not imply that they will be directly exposed
the spatial extension of the impacts, we included the total              to wave impact. However, inundation-related impacts are al-
number of affected receptors as an output variable. These are            ways associated with the presence of water at the receptors.
counted outside the BN for each simulated storm peak and

https://doi.org/10.5194/nhess-21-219-2021                                           Nat. Hazards Earth Syst. Sci., 21, 219–238, 2021
228                  M. Sanuy and J. A. Jiménez: Probabilistic characterisation of coastal storm-induced risks using BNs

Figure 6. BN-A, linking source variables to consequences. The central variable (∗ ) is used for conditioned assessments and is one of three:
(i) total number of affected receptors by inundation within a storm event; (ii) total number of affected receptors by erosion within a storm
event, and (iii) receptor area (i.e, SBN, SBM, MSM, MS1, and MS2). Distributions correspond to the baseline scenario.

This has to be taken into consideration when interpreting the           of variables (Figs. 6 and 7) was done manually, enabling
obtained results.                                                       better accuracy than automatic unsupervised methods and
   BN-B (Fig. 7) links the simulated impacts on the recep-              closer accuracy to supervised discretisation with less associ-
tors to their position, characterised by their location along           ated variability on model performance (Beuzen et al., 2018a).
the coast (area) and the distance to the inner beach limit.             Notably, both BNs present a certain degree of complexity
These variables provided additional insight into the system             given the discretisation level of some variables and the num-
response, as the obtained distributions with the BN merge               ber of variables used. The BNs are designed to be descriptive
storm-climate variability and the spatial distribution of re-           BNs (Beuzen et al., 2018b), and thus source variables are
ceptors. For the inundation risk, the number of impacts with            also interconnected to avoid the propagation of noise from
damage different from 0 % and/or with risk to life differ-              empty combinations to the output. This departs from predic-
ent from “none” was counted at each receptor. For the ero-              tive BNs which aim to infer system behaviour and predict
sion risk, the number of impacts different from “none” was              combinations beyond those learned from the dataset.
counted per receptor. This has the same consequence as that
described in the previous case (BN-A) for interpreting the
obtained results. It must be noted that from all receptors dis-         4   Results
played in Figs. 1d, 3, and 4, only those presenting at least one
impact for the entire storm dataset, by either inundation or            Figures 3 and 4 show the results of a single simulation ex-
erosion, were used for the BN training. Otherwise, the choice           ercise for 1 of the 455 possible events. Each simulation re-
of receptor population to include in the assessment would be            sults in the collection of the BN variables characterising the
arbitrary, affecting the obtained distributions.                        storm characteristics together with the location and the risk
   The presented BN model was designed to assess storm-                 values for each receptor (∼ 4000). The following subsections
induced risks in a coastal hotspot where the storm climate              present the results of the integration of multiple simulations
and coastal response are well known (e.g. Jiménez et al.,               (i.e. 179 in baseline morphology and 69 for each additional
2018; Sanuy et al., 2020a). Due to this, the discretisation             scenario). First, the 69-storm subset is validated against the

Nat. Hazards Earth Syst. Sci., 21, 219–238, 2021                                          https://doi.org/10.5194/nhess-21-219-2021
M. Sanuy and J. A. Jiménez: Probabilistic characterisation of coastal storm-induced risks using BNs                                229

Figure 7. BN-B, linking consequences to receptors spatial locations. Distributions correspond to the baseline scenario.

179-storm original dataset using the baseline morphology to             constrained) probabilities represent the expected frequency
ensure that it properly represents the local storm climate.             of the different risk levels in the study area and account for
This is followed by the presentation of the risk characteri-            the variability of the source (storm climate), spatial distri-
sation of the Tordera delta, starting with risk probabilities in-       bution, and extent of the impacts on the receptors. In gen-
tegrating all storms and receptors (global risk probabilities),         eral, under current conditions, the probability of receptors
and then with conditioned probabilities between forcing-area            being affected by significant (high and extreme) risks is low
risk (BN-A, Fig. 6) and area-distance risk (BN-B, Fig. 7).              (1 %–2 %). However, the existence of background erosion
                                                                        in the study area results in a significant increase in future
4.1   Subset validation                                                 risks. Under the baseline scenario, the computed probability
                                                                        of moderate–high risks associated with erosion is larger than
Table 5 shows the obtained statistics using Eqs. (1) and (2) to         the ones for inundation. However, when we only consider
compare the discrete probability distributions obtained with            those cases where erosion results in exposing receptors to di-
the BN using the 179-storm dataset against those from the               rect impact (high and extreme risk), the obtained probability
69-storm subset.                                                        values are of the same order of magnitude as those obtained
   All obtained values of the mean significance S and its root          for moderate damages associated with inundation. Addition-
mean square (RMS) are close to 0; therefore, from the per-              ally, results of number of affected receptors from BN-A (not
spective of obtained results, it can be assumed that the ob-            shown in the table) show an increase in the percent of storm
tained distributions by feeding the BNs with the subset al-             conditions affecting a large number of receptors along the
most identically represent the same source population as that           study area. As an example, storm conditions with the poten-
of the complete dataset. This is true both for global distribu-         tial to affect more than 200 receptors with any level of in-
tions and for conditioned discrete probability density func-            undation risk increase from 4 % under current conditions to
tions (PDFs).                                                           20 % and 40 % after 10 and 20 years, respectively. Simulta-
                                                                        neously, storm conditions affecting more than 450 receptors
4.2   Risk characterisation                                             with any level of erosion risk will rocket from the current 4 %
                                                                        to 100 % in 10 years. Here, it is important to remember that
Table 6 shows the obtained probability levels for different             erosion risk is not only related to direct impact but also the
tested scenarios in the study area. These so-called prior (un-

https://doi.org/10.5194/nhess-21-219-2021                                          Nat. Hazards Earth Syst. Sci., 21, 219–238, 2021
230 M. Sanuy and J. A. Jiménez: Probabilistic characterisation of coastal storm-induced risks using BNs
Table 5. Results of the histogram comparison between the original storm dataset and the subset for the baseline scenario.
Verification case S RMS
Global risk probabilities
Histograms of damage, risk to life, and erosion impact variables without condi- −0.009 ± 0.006 0.04 ± 0.05
tioning (Figs. 6 and 7)
Risk probabilities conditioned to source characteristics
Hs, duration, water level, and direction conditioned to damage, risk to life and 0.0006 ± 0.02 0.05 ± 0.03
erosion impact levels at different areas
Risk probabilities conditioned to receptors locations
Damage, risk to life and erosion impact probabilities at the different areas and 0.0041 ± 0.02 0.04 ± 0.08
distance to the beach (Figs. 10 to 12)
loss of protection function (decrease of beach width in front the receptors located at a given distance from the beach (i.e.
of a given receptor), while inundation risk implies the direct limit between beach and hinterland). Figures 10 and 11 show
effect of water on the receptor. In general, estimated proba- obtained results in terms of percent of inundation-induced
bilities associated with erosion-induced risks are larger than damage and risk to life, respectively, for different time hori-
those due to inundation when comparing similar risk levels. zons. Consistent with the results shown in Table 6, under
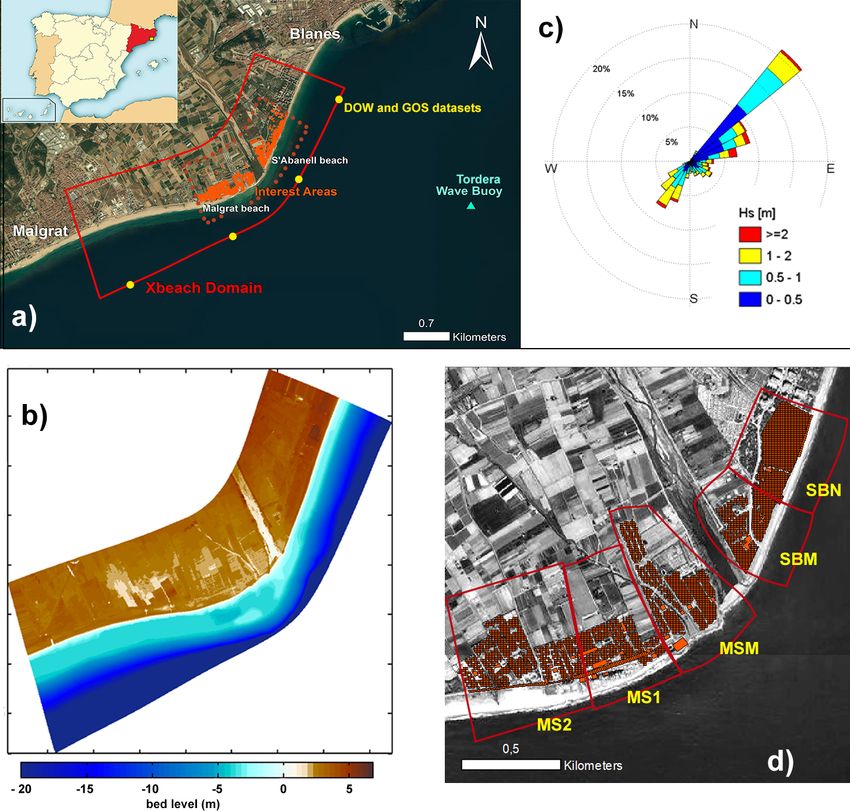
Figure 8 shows the alongshore spatial distribution of the current conditions (baseline), storms cannot induce extreme
BN-computed percentages of receptors affected by any level structural damage (>90 %) (Fig. 10) or extreme risk to life
of risk induced by both hazards under all scenarios. Ob- (Fig. 11). High damages (>60 %) are mainly concentrated at
tained results show a different spatial behaviour according to the outer fringe of the hinterland of the two locations (MSM
the considered hazard. Thus, the most-erosion-affected areas and MS1) with associated conditioned probabilities of 21 %
(those showing a larger percentage of receptors with damage and 5 %, respectively. These two areas also show the highest
different to zero) are located northwards of the river mouth, probabilities of risk penetration into the hinterland. North-
whereas areas southwards of the river mouth are more af- wards of the river mouth, the SBN sector presents a large
fected by inundation (higher probability values). The time probability of moderate damages, but it is limited to the ex-
evolution of the affected receptors is also different, reflecting ternal fringe. Regarding risk to life, a similar spatial pattern
existing spatial variations in shoreline retreat rates. Thus, the is observed, with MSM showing the largest probability of
largest relative increase in the number of impacted receptors high risk (20 %) at the external fringe, SBN at the north with
under future scenarios occurs southwards of the river mouth. 12 %, and MS1 only showing a residual 3 %. The obtained
Notably, the MS2 sector is the most sensitive to future risks, results reflect the role played by the current coastal morphol-
as currently, although it is well protected by a relatively wide ogy, where the southern area is characterised by narrow and
beach, this protection will fade after 10 to 20 years. low-elevation beaches (MSM and MS1), whereas the SBN
BN-A was also used to characterise the conditioned prob- sector in the north is composed of a narrow beach backed by
abilities of storm characteristics associated with the highest a promenade. Notably, SBM with a narrow beach but higher
risks and assess whether these probabilities vary along the topography without a promenade and MS2 with low topog-
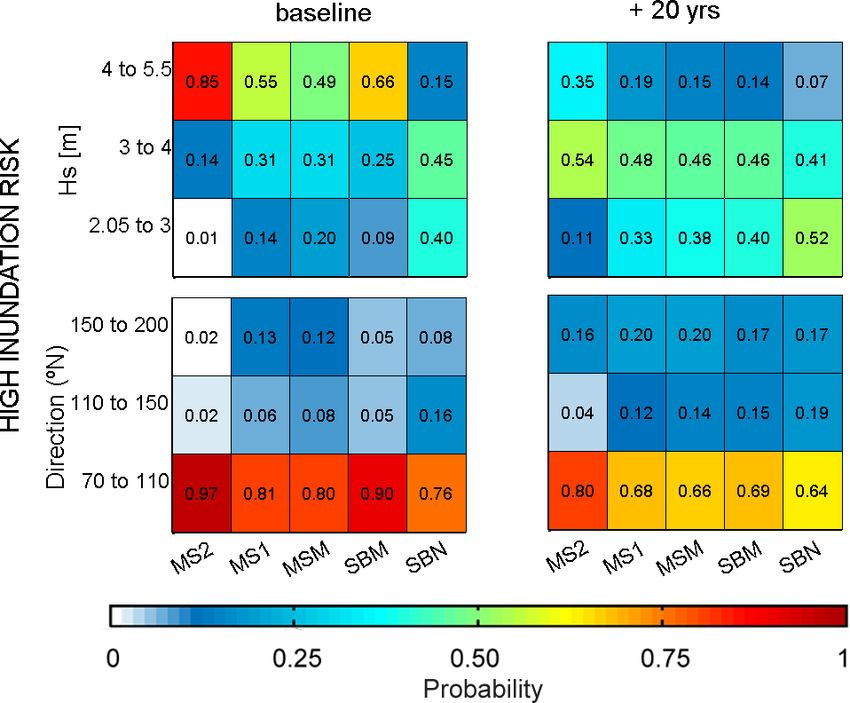
study area. As seen in Fig. 9, under current conditions, the raphy but wider beaches are the areas presenting the lowest
main storms driving the highest inundation-induced risks are risks.
characterised by Hs higher than 4 m and from the east direc- Under future conditions (+20-year scenario), significant
tion. This is valid for the entire area, although their relevance changes are observed in the intensity of risks and extension
slightly varies along the coast. Thus, the only exception is across the territory (Figs. 10 and 11). The spatial modulation
found in the SBN sector, where the promenade is so close to on induced risks as a consequence of the beach narrowing
the shoreline that lower Hs can induce inundation damages. due to background erosion is especially evident in the south-
For future conditions (20-year scenario), the relative impor- ernmost area, MS2. Whereas this sector does not experience
tance of storms with smaller Hs increases, and the relative any risk under current conditions, significant probabilities of
importance of present secondary wave directions, S and SE, moderate and high damage and risk to life is expected to oc-
also increases in relative terms. cur in 20 years, not only at the outer fringe but also in inner
The spatial distribution of the expected impacts across the positions of the hinterland. The other sectors along the coast
study area was analysed using the BN-B. The objective of the also show significant increases in the probability of occur-
analysis was to assess the probability damage occurring at
Nat. Hazards Earth Syst. Sci., 21, 219–238, 2021 https://doi.org/10.5194/nhess-21-219-2021M. Sanuy and J. A. Jiménez: Probabilistic characterisation of coastal storm-induced risks using BNs 231
Table 6. Global risk probabilities for different risk levels under the different scenarios. Note that global risk probabilities account for the
variability in the source (storm climate) and the spatial distribution of impacts on the receptors.
Global risk probabilities Baseline + 5 years + 10 years + 20 years
Inundation
Moderate risk or higher (damages ≥ 30 %) 3% 5% 5% 7%
Moderate risk to life or higher 2% 3% 3% 5%
High and extreme risk to life 1% 2% 2% 3%
Erosion
Moderate risk or higher 6% 9% 13 % 13 %
High and extreme risks 2% 4% 8% 8%
Figure 8. Distribution of risks (at any level) across the different sectors (see specific locations in Fig. 1). This shows the relative proportion
of impacted receptors in the different areas, under the baseline morphology and the future +5-, +10-, and +20-year scenarios. Orthophoto
provided by Institud Cartogràgic I Geològic de Catalunay (ICGC).
rence of any type of risk and extension of the impacts land- 45 % and 47 %, respectively) at receptors located closest to
ward (Figs. 10 and 11). the beach, along with the largest spatial propagation of risks
The spatial distribution of erosion-induced risk under cur- into the hinterland, as no hard elements are present to limit
rent conditions (Fig. 12) reflects the existence of hard ele- the retreat of the shoreline. At MS1, the probability of ex-
ments and varying beach widths along the study area. Thus, treme risks increases to 18 % at the beach limit with small
SBN presents the largest probability of extreme risks at the changes at larger distances, while MS2 starts presenting sig-
promenade (54 %), followed by MSM (9 %) and MS1 (3 %). nificant probabilities of low risks indicating that the beach
In SBN, the promenade acts as a physical boundary for ero- will begin to decrease its protective function against storm
sion; the distribution of risk levels into the hinterland shows impacts after 20 years.
a linear pattern reflecting its position. At the southernmost
end, MS2 is currently well protected by a wide beach, and
no risk is predicted under the current conditions. Under the 5 Discussion
+20-year scenario, the effect of the promenade in SBN is
reflected through the unaltered spatial pattern of affected lo- In contrast to previous applications of the BN-SPRC concept
cations and computed probabilities. MSM and SBM show presented in Jäger et al. (2018) (e.g. Van Verseveld et al.,
the largest relative increase of extreme risks (probabilities of 2015; Plomaritis et al., 2018; Ferreira et al., 2019; Sanuy et
https://doi.org/10.5194/nhess-21-219-2021 Nat. Hazards Earth Syst. Sci., 21, 219–238, 2021232 M. Sanuy and J. A. Jiménez: Probabilistic characterisation of coastal storm-induced risks using BNs
large sensitivity of the area to the impact of such S storms
(Sanuy and Jimenez, 2019), this may have serious implica-
tions for the future risk management of the area.
The method has been designed to provide a detailed spa-
tial assessment to assess the sensitivity of the area, which
permits the association of the local risk profile with differ-
ent morphological characteristics such as beach orientations,
height, and the presence of hard structures. In this sense, the
local response affected by the presence of the promenade
at s’Abanell (SBN) and revetment in Malgrat north (MS1)
were adequately characterised by the BN. This spatial analy-
sis also permitted the assessment of a differentiated variation
in future risks along the study area. Thus, whereas some ar-
eas being currently exposed linearly increased the probabili-
ties of higher risks, other areas currently well protected will
be subjected to higher future risks without any variation in
storminess.
The method can also be used for testing risk management
Figure 9. Probability of storm Hs and direction conditioned to the measures such as the performance assessment of different
area and to highest intensity inundation risk, i.e. moderate to high
setbacks. While this measure is effective in reducing coastal
risk to life together with high structural damages (≥ 60 %). Note
that extreme risk to life and damages over 90 % are not present for
damages in eroding coastlines, especially in the context of
the study site. Results must be read as individual vertical histograms climate change (Sanò et al., 2011), it has to be defined for
(one histogram per area). given time horizons and driving conditions (e.g. Wainwright
et al., 2014). To this end, the framework presented herein
permits the definition of probabilistic setbacks at the study
site. Moreover, as this definition is based on the probabilis-
al., 2018), this paper presents a fully probabilistic character- tic distributions of the different risk levels and impacts per
isation of the source using all available storms in a 60-year- receptor at different locations across the coastal domain, it
long wave time-series hindcast, following the response ap- differs from existing approaches that are essentially based
proach, and modelling their induced erosion and inundation on the probabilistic definition of the shoreline position (e.g.
risks over all the identified receptors at the study site. Jongejan et al., 2016). As an example, Table 7 shows the cal-
The methodology was successful in identifying storm culated minimum distances landward of the inner limit of
characteristics with higher probabilities to induce given risk the beach according to different risk levels for different time
levels for different coastal hazards (inundation and erosion). horizons (scenarios). As the BN output combines the natu-
It was efficient in assessing the expected changes in storm ral variability of the storm climate with the spatial variabil-
characteristics and probabilities under different scenarios, ity of the impacted receptors, setbacks can be defined from
which were developed based on the background mid-term these (total probability, as in Figs. 10 to 12) or by assuming
coastal evolution. In this sense, the obtained relationship un- that the presence of a given risk level must be completely
der current conditions of erosion and inundation risks with tackled, focusing then only on the spatial distribution of re-
storm direction and Hs depicts the general characteristics ceptors under such levels. The second approach will result in
of storm-induced hazards in the study area (Mendoza et al., more conservative (wider) buffers. Table 7 shows the calcu-
2011). The thresholds used to identify independent events in lated buffer distances using both perspectives. The obtained
the POT are site dependent. In this work, they agree with the setbacks accounting for the total probabilities can be used as
storm classification in Mendoza et al. (2011), and therefore proposals for managed retreats, as they reflect the areas with
they are valid for the Catalan coast (NW Mediterranean). The a high number of impacts per receptor; the setbacks defined
BN output showed a lack of correlation between high risks by the presence of a given risk level can be used to inform
and water levels, consistent with the previous findings of self-preparedness against risk, as they highlight zones where
Mendoza and Jiménez (2008) on the non-relevance of storm the existence of risk is possible but highly infrequent. It must
surges. Under future conditions, the background shoreline be noted that all scenarios have been simulated without any
erosion changes the sensitivity of the area to storms. Thus, assumption of receptor reallocation, and therefore hard lim-
for the tested scenarios, the population of storms with the po- its for erosion remain homogeneous across scenarios. There-
tential to significantly impact the area increases, and higher fore, the distances presented in Table 7 must be interpreted
risks will be associated with storms characterised by lower as the evolution of the baseline setbacks at different horizons
Hs with currently secondary wave directions (Fig. 8). If we in a business-as-usual situation.
combine this larger exposure to southern storms with the
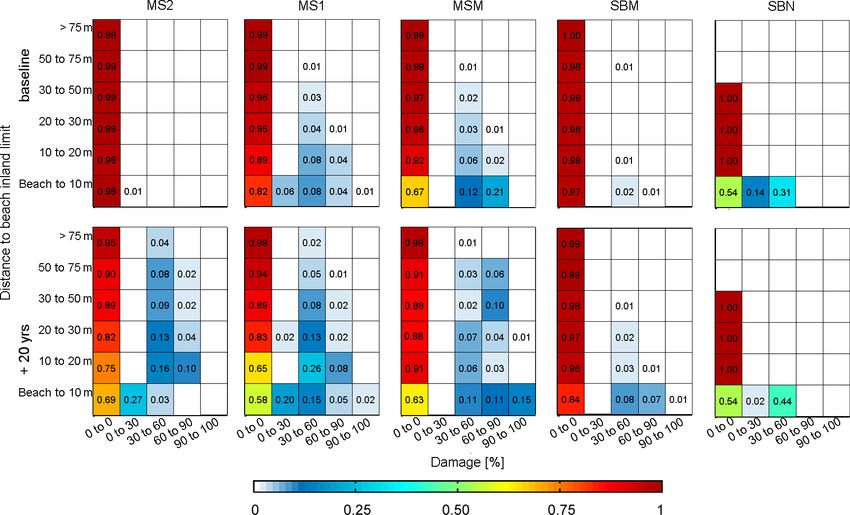
Nat. Hazards Earth Syst. Sci., 21, 219–238, 2021 https://doi.org/10.5194/nhess-21-219-2021M. Sanuy and J. A. Jiménez: Probabilistic characterisation of coastal storm-induced risks using BNs 233 Figure 10. Probability distributions of the relative damage by inundation conditioned to the different subareas (see Fig. 1 for locations) and the distance to the inner limit of the beach. Baseline and +20-year time horizon of background shoreline retreat. Results must be read horizontally as individual histograms for each combination of area, distance, and scenario. Figure 11. Probability distributions of the risk to life by inundation conditioned to different subareas (see Figs. 1 or 8 for locations) and the distance to the inner limit of the beach. Baseline and +20-year time horizon of background shoreline retreat. Results must be read horizontally as individual histograms for each combination of area, distance, and scenario. https://doi.org/10.5194/nhess-21-219-2021 Nat. Hazards Earth Syst. Sci., 21, 219–238, 2021
234                   M. Sanuy and J. A. Jiménez: Probabilistic characterisation of coastal storm-induced risks using BNs

Figure 12. Probability distributions of the erosion risk conditioned to the different subareas (see Fig. 7.1 for locations) and the distance to the
inner limit of the beach. Baseline and +20-year time horizon of background shoreline retreat. Results must be read horizontally as individual
histograms for each combination of area, distance, and scenario.

   The presented method is based on the response approach                   on decadal-scale shoreline rates of displacement retreat mea-
(Garrity et al., 2006; Sanuy et al., 2020b) as it produces prob-            sured by Jiménez and Valdemoro (2019), which were used to
abilities based on how hazards (erosion and inundation) af-                 build future coastal configuration assuming that no changes
fect the receptors in each of the storm events derived from a               in evolutive conditions will occur. Even in this case where no
long dataset of 60 years; it does not allow the extrapolation               changes in forcing conditions were applied (no changes in
of the storm conditions out of the range of the ones regis-                 storm conditions or sea level rise), this approach permitted
tered in such datasets. This has relatively little impact on the            the identification of significant changes in the storm-induced
results when compared to the impacts from other sources of                  risk profile.
uncertainty, such as morphological variability or model er-                    It has to be mentioned that to build these morphological
ror (Sanuy et al., 2020a). Nonetheless, it allows the simula-               scenarios, it is necessary to forecast future configurations of
tion of all storm events with their real shapes (time evolu-                the shallow water bathymetry. In this work, this was done by
tion of storm characteristics) without introducing large un-                extending shoreline displacements down to the depth of clo-
certainty in hazard estimation associated with the use of syn-              sure by assuming a simple parallel displacement of the active
thetic storms that are commonly used to define the shape of                 inner profile, which is compatible with the usual hypothesis
statistically extrapolated storm events (see e.g. Duo et al.,               applied in mid-term shoreline models. However, other pro-
2020).                                                                      file change modes could also be applied, such as a wedged-
   In this study, hazards were computed using a robust model                shaped change over the closure depth to simulate a slower
to simulate the storm-induced coastal response, XBeach, cal-                retreat of the delta front in comparison with faster shore-
ibrated for an event representative of extreme conditions (see              line changes (e.g. Refaat and Tsuchiya, 1991). In both cases,
Sanuy and Jiménez, 2019). They were converted to risk by                    their morphological consequences are limited to the shallow-
using damage curves recommended for use in the study area.                  est and faster part of the shoreface and, in consequence, are
However, the BN methodology is flexible for any kind of                     strictly applicable to expected mid-term (decadal) changes.
model, as well as to include model uncertainties (using dif-                Building longer-term morphological scenarios would require
ferent models or setups) and measurements (e.g. Sanuy et al.,               us to consider other options since the depth limiting signif-
2020a, for cross-shore parametric models) to extend the data                icant changes in the beach profile will extend further with
training and improve the results while testing its predictive               timescale (e.g. Cowell et al., 1999 ). In this line, Stive and
capacity.                                                                   de Vriend (1995) proposed a long-term shoreface evolution
   With regard to building future scenarios to assess future                model that considers a varying type of change through the
risks, we have limited the present study to mid-term scenar-                shoreface, from an upper part experiencing a parallel dis-
ios, i.e. at the decadal scale (20 years). They were built based

Nat. Hazards Earth Syst. Sci., 21, 219–238, 2021                                               https://doi.org/10.5194/nhess-21-219-2021
You can also read