The Costs of Regulation and Centralization in Health Care
←
→
Page content transcription
If your browser does not render page correctly, please read the page content below
The Costs of Regulation and Centralization in Health Care

                                 By Scott W. Atlas, MD , Robert Wesson Senior Fellow, Hoover Institution

Abstract                                                            of hyper-regulation. The record on access and quality of such
                                                                    systems will be contrasted with the United States system. In
Health care is universally among the most regulated sectors.        light of the need for reforming health care, this paper also
In most nations, heavy regulation of the supply of health care      will note an alternative approach that offers simplification via
goods and services care is coupled with marked centralization       strategic deregulation to enhance market competition.
of the payment for medical care. The United States has a far
less centralized but still highly regulated system characterized    Introduction
by its unique private components. More than 200 million
Americans, including most seniors on Medicare, use private          The overall goal of US health care reform is to broaden
insurance. In response to a large uninsured population and          access for all Americans to high-quality medical care at
increasing health costs, the Affordable Care Act (ACA)              lower cost. In response to a large uninsured population and
of 2010 expanded federal authority over all health care via         increasing health care costs, the Affordable Care Act (ACA,
extensive regulations, mandates, and taxes. Although more           or “Obamacare”) aimed first and foremost to increase the
people enrolled in government insurance, the new regulatory         percentage of Americans with health insurance. It did so by
environment generated substantial increases in private insurance    broadening government insurance eligibility, adding extensive
premiums, fewer insurance options, narrower acceptance              regulations and subsidies to health care delivery and payment,
of insurance by doctors and hospitals, and a record pace of         and imposing dozens of new taxes. The ACA was projected
provider consolidation.                                             to spend approximately $2 trillion over the first decade on
                                                                    its two central components: expanding government insurance
America’s government programs, Medicare for seniors and             and subsidizing heavily regulated private insurance.
Medicaid for the poor, are unsustainable without reforms.
Most hospitals, nursing facilities, and in-home providers           Through its extensive regulations on private insurance,
already lose money per Medicare patient served. Federal             including coverage mandates, payout requirements, co-
expenditures for health care and Social Security are projected to   payment limits, premium subsidies, and restrictions on medical
consume all federal revenues by 2049, eliminating the capacity      savings accounts, the ACA counterproductively encouraged
for national defense, interest on the debt, or any other program.   more widespread adoption of bloated insurance and furthered
Health care costs are increasing, and the projected demand          the construct that insurance should minimize out-of-pocket
for medical care by an aging population and lifestyle-related       payment for all medical care. Patients in such plans do not
disease threatens the sustainability of the entire system.          perceive themselves as paying for these services, and neither
                                                                    do physicians and other providers. Because patients have little
These fiscal concerns have prompted new calls for single-           incentive to consider value, prices as well as quality indicators,
payer health care in the United States, emblematic of the           such as doctor qualifications or hospital experience, remain
broader discussion about the relative merits of socialism versus    invisible, and providers do not need to compete. The natural
free-market capitalism. The intuitive attractiveness of single-     results are overuse of health care services and unrestrained
payer health care is mainly driven by a simple concept: the         costs.
government explicitly “guarantees” medical care that would
cost less overall. However, single-payer systems universally        In response to the failures of the ACA, superimposed on
hold down expenditures by limiting availability of doctors,         decades of misguided incentives in the system and the
treatments, medications, and technology. Moreover, countries        considerable health care challenges facing the country, US
with decades of single-payer experience are now forced to pay       voters at the time of this writing are being presented with
for private health care to solve their failures. The illusion of    two fundamentally different visions of health care reform:
broadening access in single-payer health care disguises a vastly    (1) a single-payer, government-centralized system, including
restrictive regulatory power, with costs that are enormous and      Medicare for All, the extreme model of government regulation
far reaching.                                                       and authority over health care and insurance, which is
                                                                    intended to broaden health care availability to everyone while
This paper will review the costs and historical evidence on         eliminating patient concern for price; or (2) a competitive,
performance of single-payer health systems, the extreme version     consumer-driven system based on removing regulations that

The Costs of Regulation and Centralization in Health Care | Atlas                                                                   1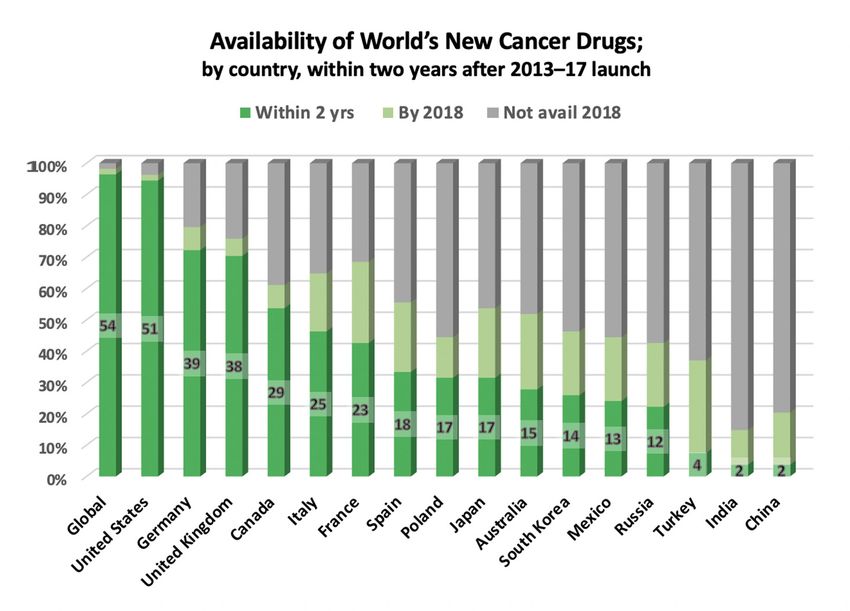
shield patients from considering price, increasing competition           Congressional Budget Office (CBO) projected that about 10
among providers, and empowering patients with control of                 million Americans will be forced off their chosen employer-
the money. This model is intended to incentivize patients                based health insurance by 2021—a tenfold increase in the
to consider price and value, in order to reduce the costs of             number that was initially projected back in 2011.7 Meanwhile,
medical care while enhancing its value, thereby providing                private insurance premiums have greatly increased under
broader availability of high-quality care.                               ACA regulations on insurance, most notably those rules
                                                                         approximating modified community rating for premiums and
Outside a discussion of the role of private versus public health         approaching guaranteed issue of coverage. In its first four years,
insurance are two realities. First, America’s main government            ACA private insurance premiums for individuals doubled
insurance programs, Medicare and Medicaid, are already                   and for families increased by 140 percent; this occurred even
unsustainable without reforms. The 2019 Medicare Trustees                though insurance deductibles (the amount that must be paid
report projects that the Hospitalization Insurance Trust Fund            before services are covered by the plan) increased by over 30
will face depletion in 2026.1 Most hospitals, nursing facilities,        percent for individuals and by over 97 percent for families
and in-home providers lose money per Medicare patient.2 Dire             (fig. 1).8 As time passed, insurance options and prices on ACA
warnings about the closure of hospitals and
care provider practices are already projected
by the Centers for Medicare and Medicaid
due to the continued payment for services
by government insurance below the cost of
delivery of those services. Regardless of trust
fund depletion, Medicare and Medicaid must
compete with other spending in the federal
budget. America’s national health expenditures
now total more than $3.8 trillion per year,
or 17.8 percent of gross domestic product
(GDP), and they are projected to reach 19.4
percent of GDP by 2027. In 1965, at the
start of Medicare, workers paying taxes for
the program numbered 4.6 per beneficiary;
that number will decline to 2.3 in 2030 with
the aging of the baby boomer generation.
Unless the current system is reformed, federal
expenditures for health care and social security
are projected to consume all federal revenues
by 2049, eliminating the capacity for national
                                                      Figure 1. Impact of ACA regulations on private insurance premiums and deductibles, first
defense, interest on the national debt, or any        four years. Source: eHealth, January 2017 data.
other domestic program.3

Second, beyond the growing burden from lifestyle-induced                 exchanges continued to worsen, according to the Department
diseases,4 including obesity5 and smoking, that will require             of Health and Human Services (HHS).9 Many exchange
medical care at an unprecedented level, America’s aging                  enrollees continued to face large year-on-year premium
population means more heart disease, cancer, stroke, and                 increases in 2018, according to Kaiser Family Foundation
dementia—diseases that depend most on specialists, complex               analysis,10 even in the face of markedly higher deductibles.
technology, and innovative drugs for diagnosis and treatment.            The shift into government insurance itself also increases
The current trajectory of the system is fiscally unsustainable,          private insurance premiums. Because government
and millions are already excluded from the excellence of                 reimbursement for health care is below cost, costs are shifted
America’s medical care. 6                                                back to the privately insured, pushing up premiums. In some
                                                                         calculations, the underpayment by government insurance
The Impact of Affordable Care Act Regulations                            adds $1,800 per year to every family of four with private
                                                                         insurance.11 Nationally, the gap between private insurance
As a direct result of the ACA’s new regulations on insurance             payment and government underpayment has become the
pricing and its new mandates on coverage, millions of                    widest in twenty years, doubling since the initiation of
Americans lost their existing private health plans. The                  Obamacare.12

2                                                                                                                          Hoover Institution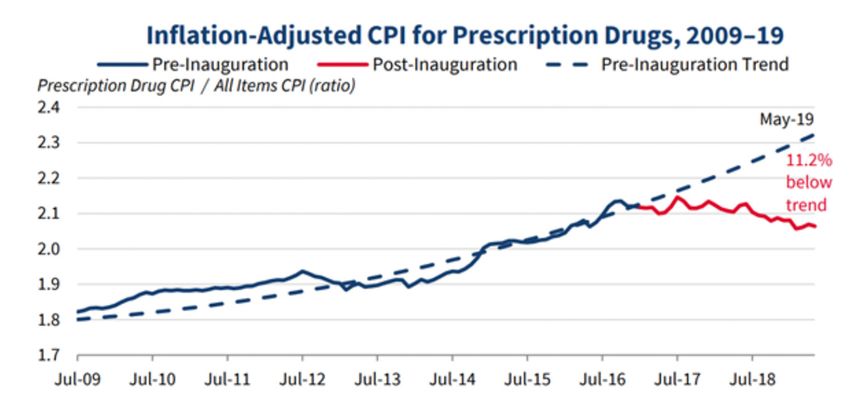
Choices of private insurance and covered providers under            Single-Payer Health Care: The Data on Performance
them are dwindling as well, disproving the theory that the law
would increase insurance choices and competition. According         Single-payer health care is a term that encompasses a variety
to a December 2014 study, the exchanges were offering 21            of health systems in which government insurance, funded
percent fewer plans than did the pre-Obamacare individual           by taxes, is the principal payer for all medical care services
market, a decrease to 310 plans nationally in 2015 from 395         for its citizens, thereby controlling access to medical care.
plans in the individual market in 2013, the last year before the    This arrangement may or may not be associated with legal,
implementation of Obamacare.13 For 2018, only one exchange          alternative private insurance options. Single-payer health
insurer offered coverage in approximately one-half of US            care is often misunderstood as a simple system, because one
counties. As the CBO stated, “Insurance premiums are lower          central administrative authority replaces an otherwise more
in markets with more insurers, because insurers have stronger       fragmented system. However, its overriding position as the
incentives to keep premiums low.”14 This rise will affect not       single payer dominates or wholly restricts the delivery of health
only the individual paying the premiums but also taxpayers,         care goods and services, eliminating market alternatives and
because taxpayers subsidize those increasing premiums under         ultimately controlling the access and quality of virtually all
Obamacare. Note that the federal government (i.e., federal          medical care.
taxpayers) subsidizes most private premiums—directly or
indirectly—at a cost of roughly $300 billion in fiscal year 2016.   Demographic and fiscal concerns in the wake of the ACA
                                                                    have prompted new calls for single-payer health care. The
For middle-income Americans dependent on subsidized                 notion that single-payer health care represents a compelling
private insurance through government exchanges, the ACA             goal for reform of the US health system is mainly driven by
eliminated access to many of the best specialists and best          the intuitive attractiveness of a simple concept: the government
hospitals. Soon after ACA regulations were fully implemented,       explicitly “guarantees” medical care. Indeed, many nations claim
McKinsey reported that 68 percent of those policies covered         to “guarantee” health care; many further insist that such health
only narrow or very narrow provider networks, double that           care is provided “free of charge.” For instance, England’s National
of the previous year.15 The majority of America’s best hospitals    Health Service (NHS) Constitution explicitly states, “You
in the National Comprehensive Cancer Network were not               have the right to receive NHS services free of charge.” Yet the
covered in most of their states’ exchange plans. And since          National Health Service taxes citizens about £125 billion per
late 2014, under Obamacare insurance plans, we have been            year, roughly equivalent to US$160 billion per year. Canada’s
experiencing a severe shortage of the specialists essential to      “free” health care costs the average family about C$13,311 per
diagnose and treat stroke, one of the most disabling and lethal     year for government health insurance; families among the top
diseases in the United States (in some cities, the number of        10 percent of income earners in Canada pay C$39,486.22 Note
specialists is actually down to zero). Almost 75 percent of         that beyond direct expenditures for health care, Canada’s “free”
ACA private plans became “highly restrictive,”16 with far fewer     health care also costs billions of dollars to the overall economy
hospitals, primary care doctors, and specialists17 accepting        and to individuals in forgone wages. For instance, Stokes and
that insurance.                                                     Somerville found that the total lost economic output from
                                                                    waiting longer than medically recommended for treatment
The ACA regulatory environment has encouraged a record              for total joint replacement surgery, cataract surgery, coronary
pace18 of consolidation across the health care sector, including    artery bypass graft surgery, and magnetic resonance imaging
mergers of doctor practices and hospitals. The last period of       (MRI) scans in 2007 was an estimated $14.8 billion.23
hospital mergers increased medical care prices substantially,
at times by over 20 percent,19 according to a Robert Wood           Funding the costs of single-payer health care by involuntary
Johnson Foundation report. Robinson and Miller reported that        taxation is often cited as the main objection to its implementation,
when hospitals owned doctor groups, per patient expenditures        and there is no question that a nationalized single-payer system
were 10 to 20 percent higher, or an extra $1,200–$1,700             would require massive new taxes on workers. The California
per patient per year.20 Capps, Dranove, and Ody found that          State Senate’s 2017 analysis by the Appropriations Committee
physician prices increased on average by 14 percent for medical     estimated that the single-payer health care proposed for
groups acquired by hospitals; specialist prices increased           California alone, SB 562, the Healthy California Act, would
by 34 percent after joining a health system.21 In the wake          cost about $400 billion per year, more than double the
of the ACA, overall health care expenditures continue to            state’s entire annual budget. Senator Bernie Sanders’s bill to
increase—for individuals, for employers, and for taxpayer-          establish single-payer health insurance in the United States,
funded government programs.                                         the Medicare for All Act, sometimes called M4A, has been
                                                                    estimated to cost over $32 trillion in its first decade.24 Doubling
                                                                    all currently projected federal individual and corporate income
                                                                    tax collections would be insufficient to finance the added

The Costs of Regulation and Centralization in Health Care | Atlas                                                                     3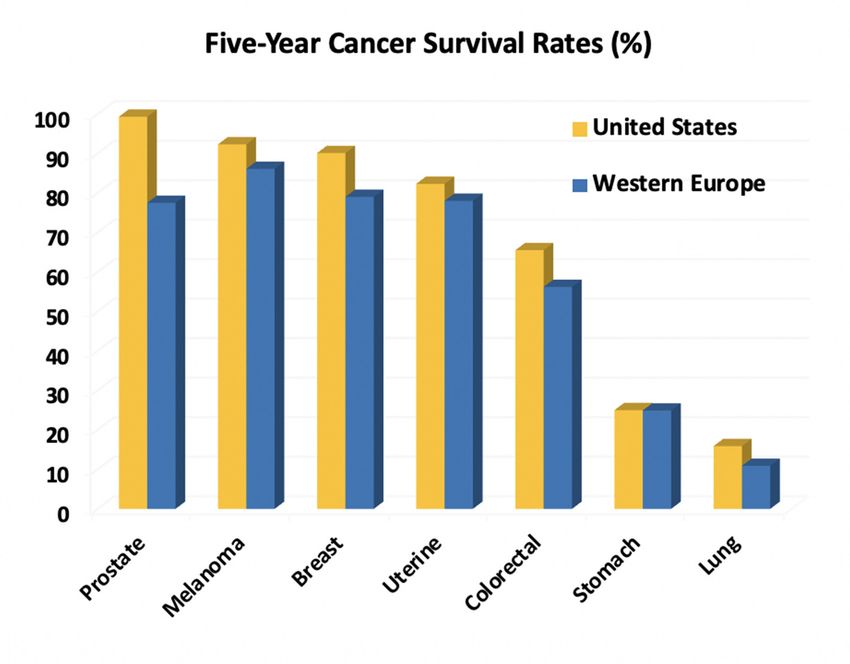
federal costs of the plan. On the other hand, overall direct health       statistics for the government of Canada, “waiting time has
care expenditures in nationalized single-payer systems are lower          been identified as a key measure of access” and is “the major
than in the United States. Single-payer systems universally hold          barrier among those who experienced difficulties obtaining
down health care expenditures by limiting availability of doctors,        care.”27 In Canada’s single-payer system, the 2017 median
treatments, medications, and technology through their power               wait from general practitioner (GP) appointment to specialist
over patients and doctors as the only direct payer.                       appointment was 10.2 weeks; when added to the median wait
                                                                          of 10.9 weeks from specialist to first treatment, the median
An evaluation of single-payer health care must examine its                wait after seeing a doctor to start treatment was 21 weeks, or
well-documented half-century record in providing timely,                  about five months.28 An average wait for a Canadian cardiology
quality medical care. Single-payer systems in countries with              patient was 6.4 weeks for the cardiologist appointment after
decades of experience have proved to be inferior to the                   seeing the GP and another 5.3 weeks to start treatment, which
United States system in important objective measures of                   means 11.7 weeks from GP appointment to first treatment.
both access to care and quality. The truth is that single-payer           The average Canadian woman waits 13.2 weeks after seeing
systems, including those Canada and in the United Kingdom,                the GP to see the gynecologist and another 9.3 weeks for first
Sweden, and numerous other European and Nordic countries,                 treatment, or 22.5 weeks total from GP visit to treatment.
impose extremely long wait times for doctor appointments,                 For simply an appointment with the qualified specialist after
diagnostic procedures, drugs, and surgery, specifically as a              already waiting and seeing the GP, Canadians wait another
means to contain expenditures. And that failure to deliver                13.4 weeks (three months) for an ophthalmologist; they wait
timely medical care has serious costs, including pain, suffering,         another 22.1 weeks (five months) to see a neurosurgeon;
and death; worse medical outcomes; permanent disability;                  and they endure their bone and joint pain for 17.9 weeks
lack of patient choice about health care; and tremendous                  (four months) while waiting to see an orthopedist for further
societal costs. Moreover, those countries with decades of                 evaluation before another 23.8 weeks for treatment (fig. 2).
single-payer experience are now reducing their broadest                   Barua and Jacques estimated that the purely monetary costs
regulatory constraints by overtly using taxpayer money to                 of waiting in Canada exceeded C$6.3 billion during 2018,
shift the patient to private health care to solve their failures,         or about C$5,860 per person, without considering medical
in many cases even outside their own borders.                             costs, such as increased risk of mortality or adverse events
                                                                          that result directly from long delays for treatment.29 Indeed,
Delays and Waiting Lists for Medical Care. In those countries             the Supreme Court of Canada, in the 2005 Chaoulli v. Quebec
with the longest experience of single-payer health care,                  decision, famously stated, “Access to a waiting list is not access
published government data demonstrates massive waiting lists              to health care.”
and delays that are virtually
never found in the United
States. In England alone,
according to UK government
statistics, a record-setting 4.4
million patients are on NHS
waiting lists as of late 2019;
95,252 have been waiting
more than six months for
treatment; and more than
3,400 patients have waited
more than one full year as of
July 2018—all after already
receiving initial diagnosis and
referral.25 As recently as 2013,
NHS England felt it necessary
to proclaim “zero tolerance” of
waits for treatment of more
than 52 weeks—a full year—
after diagnosis.26

According to Statistics Canada,
                                        Figure 2. Canadians face long wait times between seeing their GP and receiving treatment from a specialist.
the national organization in            Source: Adapted from B. Barua and M. Moir, Waiting Your Turn: Wait Times for Health Care in Canada, 2019
charge of producing official            Report, Fraser Institute.

4                                                                                                                               Hoover Institution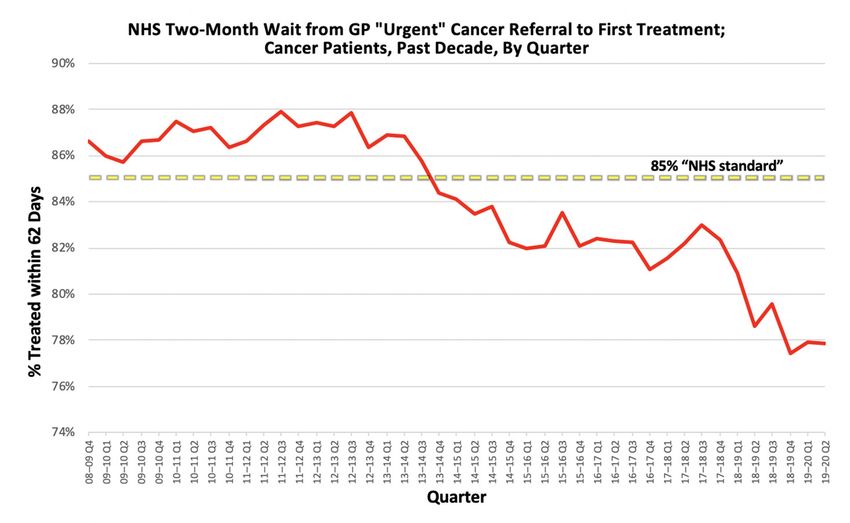
Despite the clear importance of the availability of medical care           cataracts, a disease causing severe disability that prevents
when it is needed, prolonged wait times for care are commonly              independent living and is associated with numerous other
found in health systems with government-controlled                         secondary medical problems. We will then consider access
nationalized health insurance—not just as a consequence                    to prescription drugs, medical technology, and critical care.
of limitations and imbalances in supply and demand but                     Specific examples of health care outcomes from some of the
specifically as a means of restricting access.30 In fact, “waiting         most significant illnesses are also discussed.
lists are the most commonly used means of limiting demand”
in these health systems.31 In many countries that otherwise rely           Cancer. Delay in initiation of treatment for cancer, the world’s
on free-market economics, the health care sector stands out                number one or two leading cause of death, is associated with
as being subjected to far more regulation and centralization               worse survival.35 In the United Kingdom’s single-payer NHS,
akin to programs under socialism.                                          more than 22 percent of cancer patients referred for “urgent
                                                                           treatment” currently wait more than two months for their first
Long waits are a defining characteristic of hyper-regulated                treatment after receiving the diagnosis in England (NHS
single-payer systems as a means of cost containment, but                   wait time statistics in Q4 2019)—a number that has been
they stand in stark contrast to US health care. Aside from                 increasing despite government efforts and that exceeds even
organ transplants, “waiting lists are not a feature in the United          its own arbitrarily set “standard,” which declared that it would
States,” as stated by the OECD and verified by numerous                    be acceptable for 15 percent of cancer patients to wait two
studies.32 For instance, Ayanian and Quinn note that “in                   full months for first treatment (fig. 3).
contrast to England, most United States patients face little
or no wait for elective cardiac care.”33 Low-risk patients in              In the United Kingdom, 9.6 percent of breast cancer patients
the United States “sometimes have to wait all day or even be               received first treatment within the two-month period after
rescheduled for another day,” according to the Agency for                  specialist diagnosis, but 30 percent of colorectal cancer patients,
Healthcare Research and Quality’s “Technology Assessment:                  28.2 percent of lung cancer patients, and 29.2 percent of
Cardiac Catheterization in Freestanding Clinics”—that is, a                urological cancer patients waited more than two months after
wait of even one day was considered notable. Ironically, US                “urgent referral” to start therapy. Similarly, 21 percent of brain
media reporting of wait times was widespread and cited as                  surgery patients in England wait more than four months after
a wake-up call for whole-system reform when 2009 data                      diagnosis to be treated. In Canada’s single-payer system, the
showed that time to appointment for Americans averaged 20.5                most recent data revealed a median wait for neurosurgery, after
days for five common specialties (note that in 2017, after the             patients have already seen the doctor, of 32.9 weeks—about
implementation of the ACA, wait times had increased by 30                  eight months.
percent compared with 2014).34 That reporting failed to note
that those US waits were for
healthy checkups in almost all
cases, by definition the lowest
medical priority. Even for low-
priority checkups and purely
elective, routine appointments,
US wait times are far shorter
than for seriously ill patients
in countries with single-payer
health care.

Although an exhaustive study
of access to every medical or
surgical treatment is impossible
to perform and beyond the
scope of this paper, it is
enlightening to look at access
to care for a two common
diseases: cancer, representing a
life-threatening disease, where
timely diagnosis and treatment           Figure 3. NHS statistics on patient waits for treatment after GP “urgent referral for cancer,” past decade
are critical to outcome; and             through Q2 2019–20.

The Costs of Regulation and Centralization in Health Care | Atlas                                                                                5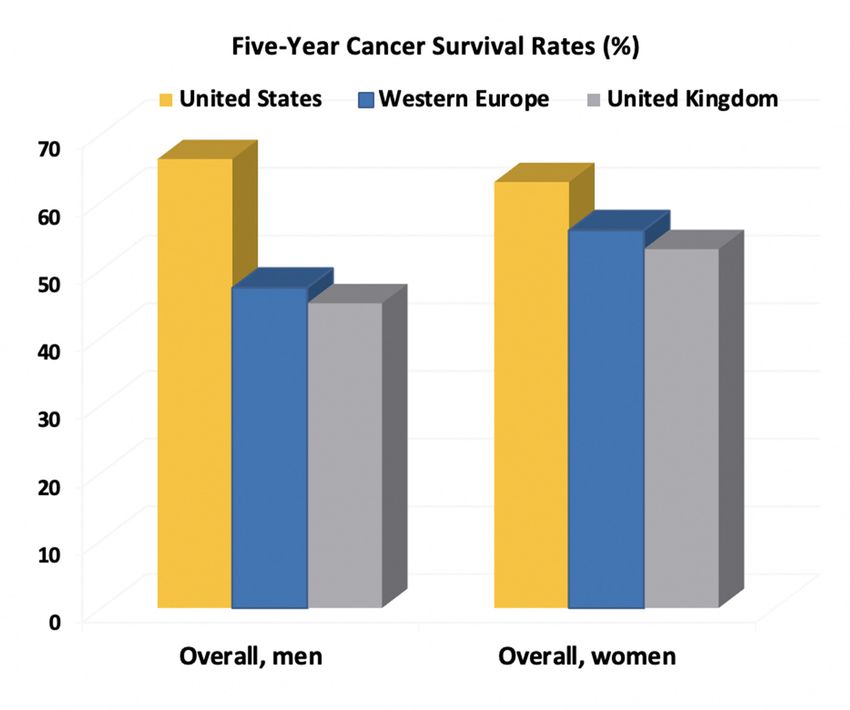
One study of 3.67 million US patients with breast, prostate, For their vision-restoring surgery, most recent data shows
lung, colorectal, renal, and pancreas cancer from 2004 to 2013 that Canadians with cataracts waited a median time of 20.2
showed a median wait of twenty-seven days.36 All cancer weeks. In contrast, there is almost no waiting for cataract
treatment began in less than two months, except for prostate surgery in the United States beyond patient-chosen deferral.
cancer, generally a more indolent tumor (up to eighty-seven In fact, thousands of people from other countries commonly
days). Note that timely access to treatment of cancer reveals seek their cataract surgery in the United States every year.
significantly longer waits (24 percent to 91 percent longer)
from initial diagnosis to treatment in the US single-payer Prescription drugs. The regulations of single-payer systems
Veterans Affairs system than in other hospital settings.37 prevent patient access to the newest drugs for cancer and
serious diseases, sometimes for years, unlike US regulations.
Cataract surgery. Cataract, a degenerated, opacified lens in Even though pharmaceuticals are perhaps the most heavily
the eye, is the world’s leading cause of blindness, affecting regulated technology in the nation, requiring staggering
more than 24.4 million Americans age forty and older. By costs and time until approval for use, the United States has
age seventy-five, approximately half of all Americans have been by far the most frequent location for launching new
cataracts, according to National Eye Institute statistics. drugs of virtually all types. The United States is the most
Surgical removal of the lens is the only treatment, without frequent originator of new cancer drugs—by a factor of at least
which patients often have severely limited vision even four—surpassing any country studied in the previous decade,
approaching blindness. Intraocular lens replacement has been including Germany, Japan, Switzerland, France, Canada, Italy,
universally established as the treatment of choice. The visual and the United Kingdom, according to Annals of Oncology.41
impairments in elderly patients can be severe enough to prevent Two-thirds of the “novel drugs” approved in 2015 (twenty-
independence, and the time waiting for cataract surgery can nine of forty-five, or 64 percent) were approved in the United
represent a large proportion of their remaining lives. Brown States before any other country.42 Women in single-payer
calculated quality-of-life impact from the SHARE data of Canada and in the United Kingdom even had far fewer
ten European nations that given a 3.3-month average wait choices of hormonal contraceptive drugs (62 percent and 54
for surgery and an additional twelve months from a patient percent, respectively) than American women, who had access
noting disabling vision loss means 15.3 months between to twenty-six contraceptive drugs over a fifteen-year period,
disability and treatment.38 She calculated that this wait for as reported in the Canadian medical literature in 2016.43
cataract surgery had the equivalent negative impact as having
limb amputation or significant coronary artery disease. Cancer drugs, generally making up the largest proportion
of all new drugs, deserve special consideration, because time
In a study of ten European nations, the average patient is of the essence for treating these life-threatening diseases.
waited more than three months for cataract surgery, and The OECD showed that survival is strongly associated with
31.6 percent of patients overall waited longer than three the system’s availability of new cancer drugs, and specifically
months.39 This does not include the wait of up to one full more so than the provision of drugs free of charge.44 Of all
year to see the ophthalmologist. More recent OECD data newly approved cancer drugs from 2009 to 2014, single-payer
shows the following waits (fig. 4) for cataract surgery after systems of the United Kingdom, Australia, France, and Canada
referral by a specialist:40 had approved only 30–60 percent of those approved in the
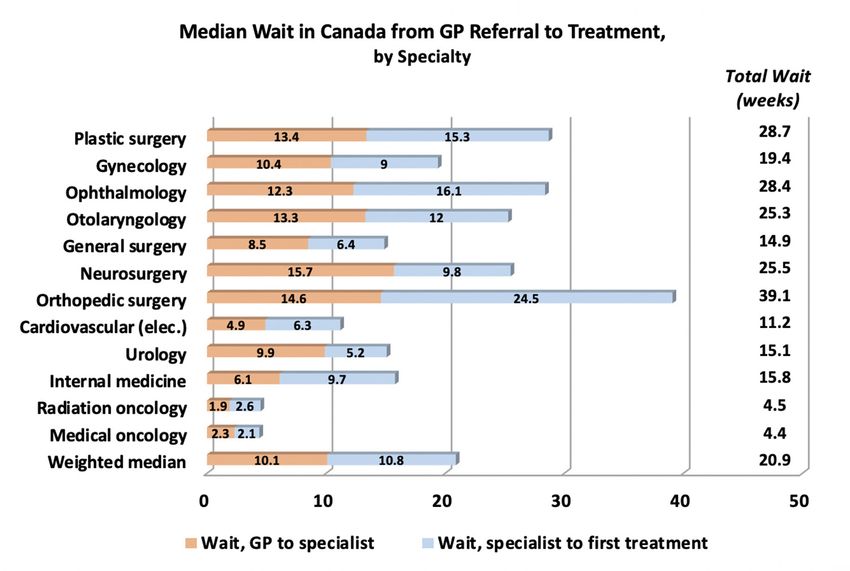
United States by June 30, 2014.45 Of the world’s fifty-four
Country Waiting Time (days) new cancer drugs launched from 2013 to 2017 and available
Austria 30.0 within two years, fifty-one (94 percent) were available within
two years in the United States (fig. 5). 46 For Brits with cancer,
Denmark 63.0
only thirty-eight of fifty-four (70 percent) were available; for
Finland 103.0 Canada’s cancer patients, only twenty-nine of fifty-four (53
Israel 132.0 percent) were available; cancer patients in France had access
Netherlands 58.8 to only twenty-three of fifty-four (43 percent); and Australian
New Zealand 75.0 cancer patients had access to fifteen of fifty-four (28 percent).
Norway 129.0
Spain 105.0 And yet, in 2017, single-payer NHS England introduced a
Sweden 57.0 new regulation, the “budget impact test,”47 to cap drug prices
Portugal 133.3 specifically based on system expenditures rather than medical
efficacy. This regulation will further restrict drug access, even
United Kingdom 78.3
though cancer patients could be forced to wait years for life-
Figure 4. Waiting times for cataract surgery, after appointment with saving drugs, some already available in the United States. As
specialist physician, in selected OECD nations. just one important projection under that single-payer NHS
6 Hoover Institution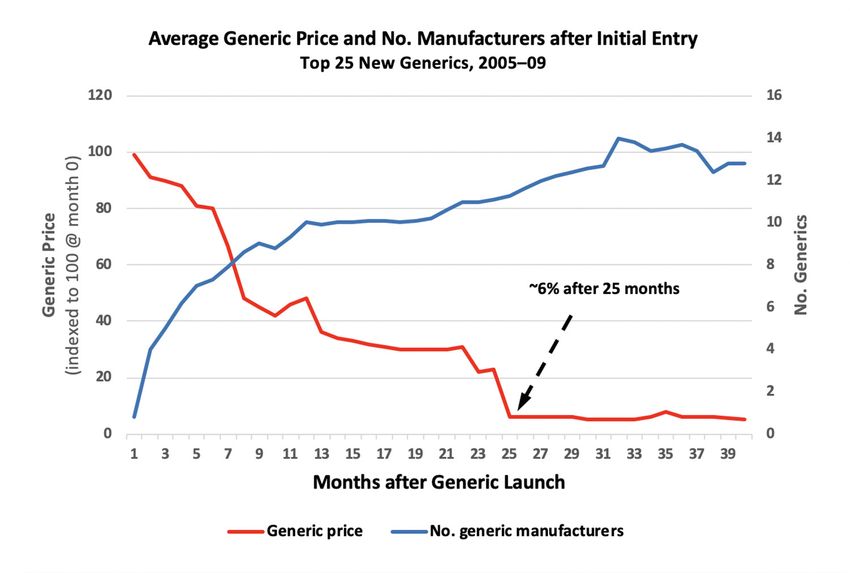
setting. Separately, notwithstanding
                                                                                                         the importance of diagnostic scanners
                                                                                                         in medical care, highly centralized
                                                                                                         health systems more broadly regulate
                                                                                                         the purchase and utilization of these
                                                                                                         expensive scanners, specifically to limit
                                                                                                         the outlays for their use. Single-payer,
                                                                                                         centralized health systems, particularly
                                                                                                         those of Canada and the United
                                                                                                         Kingdom, are notorious for their low
                                                                                                         numbers of CT and MRI scanners
                                                                                                         (figs. 6, 7).53 Overall, the United States
                                                                                                         employs far lighter regulatory restrictions
                                                                                                         on the availability and utilization of
                                                                                                         advanced technology devices such
                                                                                                         as CT and MRI scanners. However,
                                                                                                         regulatory certificate-of-need (CON)
                                                                                                         requirements54 in thirty-four states,
                                                                                                         Puerto Rico, and the District of Columbia
                                                                                                         still limit approvals of competitive
Figure 5. Availability of the world’s new cancer drugs, by country, within two years after 2013–17       medical technology. The original intent
launch (as of December 2018). Exact number of drugs available in each country of the world’s
                                                                                                         of CON laws was to support indigent
total of 54 total is noted; green shaded column in chart indicates percentage of the 54 total. Source:
IQVIA Institute, Global Oncology Trends 2019: Therapeutics, Clinical Development and Health System
                                                                                                         care by limiting overinvestment in
Implications, 2019; data from Statista, https://www.statista.com/statistics/696020/availability-of-      unnecessary equipment and facilities.
new-oncology-drugs-by-country.                                                                           CON regulations fail to increase the
                                                                                                         level of indigent care but do restrict the
rule, a dementia drug for Alzheimer’s disease would be required                   supply of regulated medical services in those states: fewer beds
to cost only £29.60 per year, less than US$4 per month,48                         per person and fewer MRI and CT scanners per person.55
or it would be unavailable to patients (as calculated by the                      Availability of imaging is specifically reduced in nonhospital
Alzheimer’s Society), ironically restricted due to overall cost                   settings, driving patients to seek MRI, CT, and PET (positron
to the system specifically because so many patients need it.                      emission tomography) scanning either out of state or in
                                                                                  hospitals, likely increasing costs.56
Medical imaging technology. Sophisticated imaging technology,
including magnetic resonance imaging (MRI) and computed
tomography (CT) scanning, has
revolutionized diagnosis and treatment.
Today, imaging is central to the diagnosis
and treatment of most the world’s most
serious disorders, including cancer,49
stroke,50 and heart disease, and it has long
been proven cost-effective.51 Moreover,
numerous studies have proved that the
availability of CT and MRI scanners is
highly correlated with better outcomes
in diseases with the most mortality and
morbidity.52 Access to state-of-the-art
imaging is a foundation of twenty-first-
century medical care.

All governments impose heavy regulatory
burdens on manufacturers of medical
devices, including diagnostic imaging
technology, for proof of safety and efficacy
prior to and during use in the clinical             Figure 6. CT scanners by country, most recent data available. Source: OECD.

The Costs of Regulation and Centralization in Health Care | Atlas                                                                                7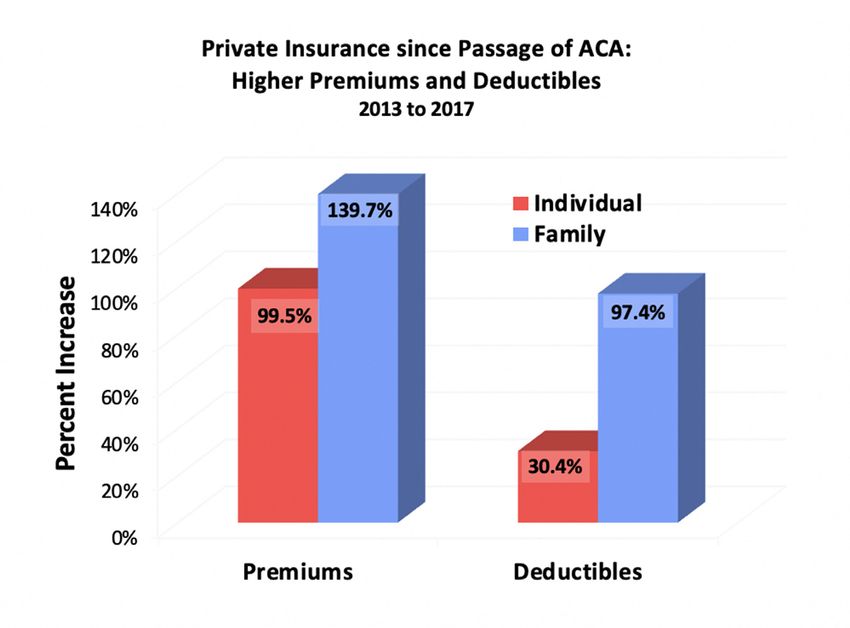
cited data from the National Center
for Biotechnology Information, and
the journals Intensive Care Medicine
and Critical Care Medicine noted that
the United States had 34.7 critical care
beds per 100,000, leading Germany
(29.2), Italy (12.5), France (11.6),
South Korea (10.6), Spain (9.7), Japan
(7.3), the United Kingdom (6.6), China
(3.6), and India (2.3).58 Adjusting these
numbers as a proportion of each nation’s
specific elderly population,59 data shows
that the United States exceeds every
other country in available critical-care
beds per 100,000 of its sixty-five-plus
population (fig. 8), those most at risk
for needing an ICU: United States
(239.31), Germany (136.13), South
Figure 7. MRI scanners by country, most recent data available. Source: OECD. Korea (83.73), France (64.62), Italy
(58.82), Spain (52.98), India (38.33),
the United Kingdom (38.24), China
ICU and critical care. Concerns about the lack of capacity of (32.73), and Japan (29.13). Ironically, as we hear critics of the
medical systems and hospitals to deal with intensive-care unit US system now bemoaning an alleged shortage of ICU beds,
(ICU) and critical care needs became a top issue in 2020, as the some critics recently pushed for more regulation to constrain
world grappled with the COVID-19 pandemic. No country the increasing number of ICU beds through certificate-of-need
can realistically have instant availability of unlimited emergency laws.60 However, the United States has shifted even further
medical care, whether doctors, drugs, or technology. Preparedness toward more ICU beds as a percentage of total hospital beds.61
can without question be improved,
though, and all systems will now focus
on preventing future shortcomings.
In the context of this manuscript, the
evidence in peer-reviewed medical
journals is clear on two facts: (1) the
United States is the most well-equipped
system in the world for these patients,
and (2) the United States has the best
outcomes from severe respiratory disease
requiring ICU treatment.
Medical care for the sickest patients
requires ICU access, technology,
medications, and highly skilled,
specialist physicians. Despite some
variations in terminology, the
availability of ICU beds in the United
States dwarfs the availability in Figure 8. Available critical care beds, per 100,000 and per 100,000 aged 65 years and older, by country.
Sources: N. McCarthy, “The Countries with the Most Critical Care Beds per Capita,” Forbes, March
single-payer systems. According to a 12, 2020; World Bank staff estimates based on age/sex distributions of United Nations Population
Columbia University study, the United Division’s World Population Prospects: 2019 Revision.
States has 20–31 beds per 100,000
people, more than all other countries
in that study, including Canada’s 13.5, Denmark’s 6.7–8.9, Outcomes in severely ill patients cared for in ICUs are also
Australia’s 8.0–8.9, Sweden’s 5.8–8.7, Japan’s 7.9, the United reported as superior in the United States. The journal Lancet
Kingdom’s 3.5–7.4, and New Zealand’s 4.8–5.5.57 Statista Infectious Diseases reported a study of more than 25,000 ICU
8 Hoover Institution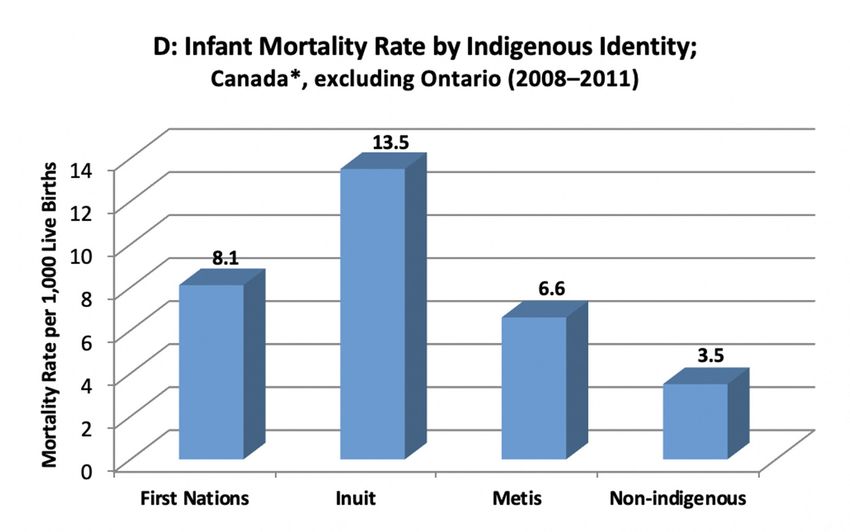
patients with sepsis, a severe illness due to infection typically        of survival in ICUs and in hospitals were significantly higher
requiring ICU care, in which the odds of hospital death were             in the “high-income rest-of-world countries” than in high-
between 51 percent and 65 percent higher in Europe than in               income European countries.68
the United States.62 Although their reported “adjusted” odds
for death were only 5 percent to 19 percent higher in Europe             Outcomes from serious disease. Long waits in single-payer
than in the United States, those researchers asked “is the               systems for diagnosis, treatment, drugs, and technology have
higher mortality rate in Europe than in USA due to a lower               major consequences for patients, as documented throughout
number of ICU beds available in Europe.” Other analyses have             the peer-reviewed medical journals. In single-payer systems,
shown that there is a strong correlation between ICU beds                patients are often waiting months, even after their doctors
and hospital death in ICU patients,63 including in patients              recommended urgent treatment for the most life-threatening
specifically with sepsis and severe respiratory illnesses, many          illnesses. The ultimate consequence of single-payer care’s
of whom need mechanical ventilators for assisted breathing.              hyper-regulation and restricted access is worse health outcomes
                                                                         compared with the US system for nearly all of the most serious
Numerous studies have consistently demonstrated mortality                diseases—the illnesses that cause the most deaths, as well as
rates from severe sepsis in Western Europe and Japan to                  the most important chronic diseases that lead to the most
be significantly higher than in the United States. 64 In one             disability, including cancer,69 heart disease,70 stroke,71 high
global study of 1,794 patients in sixty-two countries with               blood pressure,72 and diabetes73 (figs. 9–11). As one indicator
severe sepsis in which 1,545 (86 percent) were admitted to               of outcomes, Barua, Esmail, and Jackson calculate that among
the ICU, the overall hospital mortality was 28.4 percent.                women in Canada alone over a sixteen-year period, more
Among regions with more than 100 patients, North America                 than 44,000 additional patients died due to Canada’s wait
(98 percent were US patients) had the lowest hospital death              times for medically necessary nonemergency treatment.74
rate (24.2 percent).65 Acute respiratory distress syndrome               Although potentially stressed beyond any foreseeable need,
(ARDS), another life-threatening condition that depends on               the US system is uniquely prepared to care for patients with
mechanical ventilators as the mainstay of patient management,            life-threatening diseases.
comprises 10 percent of all
ICU admissions. ARDS has
a high global mortality rate
of 35 percent to 46 percent.66
Although it is difficult to find
international comparison
data, the American fatality
rate was at the lowest end
of that range, 34.8 percent,
in one 2011 study of 435
ARDS patients.67 A 2017
study in Lancet Respiratory
Medicine compared ARDS
outcomes in “high-income
European countries” (over
90 percent of cases from the
United Kingdom [1,441],
France [1,312], Spain [1,030],
Italy [752], the Netherlands
[412], Sweden [330], Ireland
[277], Germany [275], and
Portugal [247]) with ARDS
outcomes in “high-income
rest-of-world countries”
(over 90 percent of cases from
the United States [1,421],        Figure 9. Comparison of five-year survival rate, United States versus Western Europe, 2000–2002, from seven
                                  common cancers. The United States has superior survival from all common cancers compared with Western
Australia [695], Japan [643],
                                  European nations. Source: A. Verdecchia et al., “Recent Cancer Survival in Europe: A 2000–02 Period Analysis
and Canada [380]). The odds       of EUROCARE-4 Data,” Lancet Oncology 8, no. 9 (September 2007): 784–96.

The Costs of Regulation and Centralization in Health Care | Atlas                                                                           9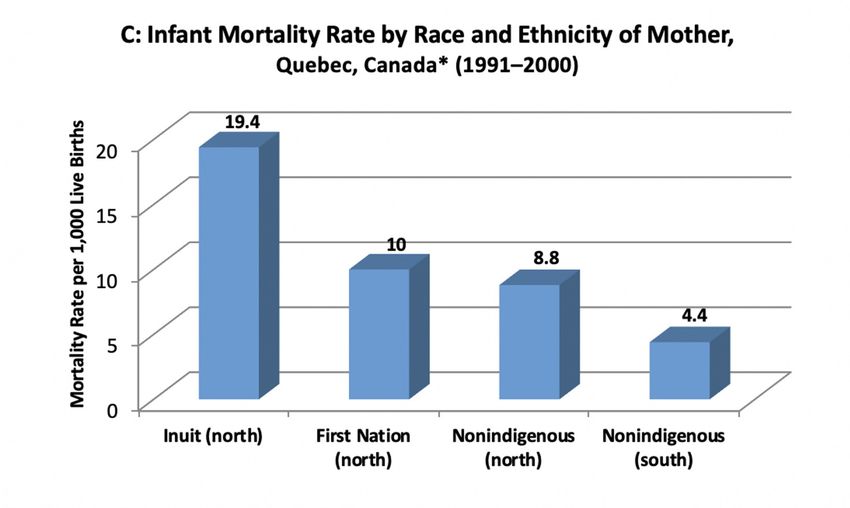
It should be noted that the superior
                                                                                                   disease outcomes in the United States
                                                                                                   are generally reported as group data for
                                                                                                   all affected patients. It is also true that
                                                                                                   some disease outcomes, as well as broader
                                                                                                   measures not necessarily reflective of only
                                                                                                   health care, including life expectancy and
                                                                                                   infant mortality, are worse for certain
                                                                                                   populations, including some minorities and
                                                                                                   lower socioeconomic groups in the United
                                                                                                   States.75 This is not unique to the United
                                                                                                   States.76 Throughout the developed world,
                                                                                                   and regardless of health care system, infant
                                                                                                   mortality rates, as one example, are far worse
                                                                                                   for minority and lower socioeconomic
                                                                                                   populations. For instance, racial-ethnic
                                                                                                   minorities consistently demonstrate
                                                                                                   significantly higher infant mortality rates,
                                                                                                   roughly double those of the majority
                                                                                                   population, in the government-run systems
                                                                                                   of Canada77 and the United Kingdom78
                                                                                                   (fig. 12). While these differences by race
                                                                                                   are among the most perplexing dilemmas
Figure 10. Comparison of five-year survival rates for men and women, United States versus
western European nations. Note the statistically significant increased survival for American men   and most serious problems in society, they
and women compared with the average Western European and especially the United Kingdom.            are likely multifactorial and identifiable
Source: Verdecchia et al., “Reent Cancer Survival in Europe.”                                      even when the effects of other risk factors
                                                                                                   (maternal age, marital status, parity, and
                                                                                                   education) are taken into account.

                                                                                                   As opposed to the new enthusiasm of
                                                                                                   some for a move toward single-payer care
                                                                                                   in the United States, those countries with
                                                                                                   decades of single-payer experience are
                                                                                                   now reducing their broadest regulatory
                                                                                                   constraints by overtly paying for private
                                                                                                   health care to solve their failures. In 2016,
                                                                                                   the UK government spent more than
                                                                                                   half of its total budgetary increase from
                                                                                                   taxpayers on private and other non-NHS
                                                                                                   providers.79 Even though England’s NHS
                                                                                                   is projected to hit a £30 billion funding
                                                                                                   shortfall in 2020–21, one of the very few
                                                                                                   areas where funding is increasing is to non-
                                                                                                   NHS providers. Sweden, often heralded as
                                                                                                   the paradigm of a successful welfare state,
                                                                                                   increased municipal government spending
                                                                                                   on private care contracts by 50 percent in
                                                                                                   the past decade as a deregulatory move to
                                                                                                   repair its single-payer system. Primary care
Figure 11 continued on the next page.
                                                                                                   clinics and nursing facilities are now run
                                                                                                   by the private sector or receive substantial
                                                                                                   public funding. Major deregulation in
                                                                                                   pharmacies80 to permit private sector

10                                                                                                                             Hoover Institution
competition has also been introduced into
Sweden’s previous government monopoly
on prescription and nonprescription drugs.
In a striking regulation pullback, Denmark’s
patients using taxpayer-funded single-
payer health care can choose a private
hospital—even outside the country—if
the waiting time for the treatment exceeds
one month.81 The governments of Finland,
Ireland, Italy, the United Kingdom, the
Netherlands, Norway, Spain, and Sweden,
all with single-payer care, also now spend
taxpayer money on private care, sometimes
even outside their own countries, to solve
their failures to deliver adequate care.
Medicare for All: Creating an American
Single-Payer System
Figure 11. High blood pressure: access to treatment by percentage of diagnosed patients receiving Single-payer systems hold down health
treatment, by country, ages thirty-five to sixty-four years (top); and successful control by percentage care costs by limiting availability of doctors,
of treated patients by country, ages thirty-five to sixty-four years (bottom). The United States has
more effective medical care for high blood pressure compared with other developed countries,
treatments, medications, and technology.
including those held as models for single-payer care. Sources: K. E. Thorpe, D. H. Howard, and K. Our own government’s Medicare and
Galactionova, “Differences in Disease Prevalence as a Source of the U.S.-European Health Care Medicaid programs employ similar
Spending Gap,” Health Affairs 26 (2007): w678–w686; E. M. Crimmins, K. Garcia, and J. K. Kim, methods to hold down costs. Data on
“Are International Differences in Health Similar to International Differences in Life Expectancy?,” payments to health care providers shows
in International Differences in Mortality at Older Ages: Dimensions and Sources, eds. E. M. Crimmins,
a significant underpayment from both
S. H. Preston, and B. Cohen, Panel on Understanding Divergent Trends in Longevity in High-
Income Countries. Committee on Population, Division of Behavioral and Social Sciences and Medicare and Medicaid for health care
Education, National Research Council. (Washington, DC: National Academies Press, 2010); K. (fig. 13).82 That underpayment—payment
Wolf-Maier et al. “Hypertension Treatment and Control in Five European Countries, Canada, for services below the cost of administering
and the United States,” Hypertension 43, no. 1 ( January 2004): 10–17. those services—has increased significantly
since the implementation of the ACA.
Underpayment for medical care has
consequences beyond shifting costs to
those with private insurance. Beyond the
limited access to doctors due to below-
cost payments by Medicaid, the medical
literature demonstrates that disease
outcomes under government insurance
are worse than those for medically similar
patients under private coverage (fig. 14);
race and income were not associated
with worse outcomes in several of these
studies (Medicaid patients are typically
using purely government insurance with
its restrictive coverage for medical care,
without supplemental private insurance). 83
Figure 13. Underpayment to hospitals for delivered care, Medicare and Medicaid, 2004–17. Note
the significant jump in the deficit to hospitals from payment below cost of services by government
insurance in 2012, after ACA regulations came into effect. Source: Analysis of American Hospital
Association Annual Survey data, 2018, community hospitals.
The Costs of Regulation and Centralization in Health Care | Atlas 11Figure 12A–D. Infant mortality rates of (A) United States, (B) United Kingdom, (C) Quebec, and (D) Canada by race and ethnicity of mother. Note significantly higher infant mortality rates of minority populations in these countries, with or without single-payer health care. *Canada calculations defined infants as “live birth” for all births 500g or larger birth weight. Sources: US Centers for Disease Control and Prevention, User Guide to the 2016 Period Linked Birth/Infant Death Public Use File, 80, ftp://ftp.cdc.gov/pub/Health_Statistics/NCHS/Dataset_Documentation/DVS/periodlinked/LinkPE16Guide. pdf; Office for National Statistics (UK), “Large Differences in Infant Mortality by Ethnic Group” June 24, 2008; Office for National Statistics (UK), “Pregnancy and Ethnic Factors Influencing Births and Infant Mortality: 2013,” October 14, 2015, https://www.ons.gov.uk/peoplepopulationandcommunity/ healthandsocialcare/causesofdeath/bulletins/pregnancyandethnicfactorsinfluencingbirthsandinfantmortality/2015-10-14; Z.-C. Luo et al., “Birth Outcomes and Infant Mortality among First Nations, Inuit, and non-Indigenous Women by Northern versus Southern Residence, Quebec, Journal of Epidemiology and Community Health 66, no. 4 (September 2012): 328–33; Public Health Agency of Canada, Key Health Inequalities in Canada: A National Portrait, 2018, 81, https://www.canada.ca/content/dam/phac-aspc/documents/services/publications/science-research/key-health-inequalities-canada- national-portrait-executive-summary/key_health_inequalities_full_report-eng.pdf. 12 Hoover Institution
Medicare beneficiaries. CMS calculated that most hospitals,
                           Comparison of Patient Outcomes with
   Medical Disorder                                                   skilled nursing facilities, and in-home health care providers
                            Medicaid versus Private Insurance
                                                                      already lose money per Medicare patient. It warned that “we
                          Need longer hospital care (42% longer),     expect access to Medicare-participating physicians to become
                          incur more hospital costs (26% more),       a significant issue in the long term under current law” even
                          and are almost two times more likely        without moving toward Medicare for All.84
                          to die in the hospital than those with
                          private insurance; 13% more likely to       A shift to the extreme regulatory milieu of Medicare for All
 Major surgery
                          die, stay in the hospital 50% longer;       or any similar single-payer system would almost immediately
                          and cost of care 20% more than those
                                                                      jeopardize access to timely medical care, as documented in
                          with no insurance
                                                                      the proposals themselves. By eliminating private insurance,
                          (LaPar et al., Annals of Surgery 2010;
                          893,658 major surgeries)                    Medicare for All imposes large and immediate reductions in
                                                                      payments to doctors and hospitals now treating patients under
                          50% more likely to die than patients        private insurance, including cuts of more than 40 percent
 Cancer of the            with private health insurance               for hospitals and 30 percent for physicians that would grow
 mouth and throat         (Kwok et al, Cancer 2010; 1,231             more severe over time. As Blahous states, we cannot know
                          patients)                                   with certainty the extent to which these cuts would disrupt
                                                                      the supply and timeliness of health care services.85 It is also
                          57% more likely to die postoperatively
                          than patients with private insurance,
                                                                      noteworthy that more than 70 percent of US seniors rely
 Colon cancer             a death rate not significantly different    on private insurance to supplement or replace traditional
                          from that of the uninsured                  Medicare, whether Medicare Advantage, Medi-Gap, and
                          (Kelz et al., Cancer 2004; 13,415 adults)   employer-sponsored coverage, and that millions more use
                                                                      private drug coverage.86 Abolishing private insurance, whether
                          More likely to die from strokes and         overtly by law or by the slower pathway of introducing a “public
                          heart attacks than patients with            option,” will radically alter the timely access and high-quality
                          private insurance and suffered the          health care that today’s Medicare beneficiaries enjoy.
                          same outcome as those who lacked
                          insurance altogether; more than twice       Strategic Deregulation in Health Care: Evidence before
 Heart procedures         the risk of death, heart attack, or other   and during the Trump Administration
                          serious cardiac event within one year of
                          cardiac surgery compared with privately
                                                                      The impact on the price that consumers are paying directly for
                          insured patients
                          (Gaglia et al., American Journal of
                                                                      medical care is illustrated in two cases: (1) medical procedures
                          Cardiology 2011; 13,573 patients)           not covered by insurance, and (2) insurance coverage with
                                                                      higher deductibles. Such simpler models of health care
                          Die sooner than patients with private       purchasing ultimately generate downward pressure on
                          insurance undergoing lung transplants       prices from doctors competing for patients. For instance,
                          for end-stage pulmonary diseases;           prices rapidly decreased when patients paid out-of-pocket
                          8.1% less likely to survive ten years       for LASIK corrective vision surgery and MRI or CT
 Lung transplants
                          after surgery than privately insured and    screening. Additional evidence from studies of consumers’
                          uninsured patients                          use of MRIs and outpatient surgery shows that introducing
                          (Allen et al., Journal of Heart and Lung    price transparency and defined-contribution benefits further
                          Transplantation 2011; 11,385 patients)      encourages patients to compare price.87
Figure 14. Comparison of medical outcomes by source of insurance.     Consumer spending on health care is significantly lower for
Even after standardizing for medical differences among patients,
                                                                      those using high-deductible coverage,88 without any consequent
Medicaid patients fare worse than those under private insurance,
                                                                      increases in emergency room visits or hospitalizations and
sometimes even worse than those with no insurance at all.
                                                                      without the hypothesized harmful impact on low-income
                                                                      families or the chronically ill.89 Health spending reductions
Owing to Medicare’s below-cost payment for care, access to            averaged 15 percent annually, and the savings increased with
care is already at risk, and this would undoubtedly worsen if         the level of the deductible and when paired with health savings
expanded to Medicare for All. The Office of the Actuary of            accounts (HSAs). More than one-third of the savings by
the Centers for Medicare and Medicaid Services (CMS) in               enrollees resulted from lower costs per health care utilization,
2019 warned of serious limitations in availability of care for        that is, value-based decision-making by consumers.90 While

The Costs of Regulation and Centralization in Health Care | Atlas                                                                  13
especially relevant to patients using high-deductible plans with The current presidential administration has also focused on
HSAs, these reforms pressure prices downward for all health improving price transparency to reduce the cost of health
care consumers. care. President Trump signed an executive order to require
providers paid by Medicare to post prices for a range of
The focus of the first years of the Trump administration in procedures. He also introduced a legal requirement barring
health care reform has been centered on strategic deregulation pharmacy gag clauses under Medicare Part D plans, 93 clauses
to increase competition and reduce prices, intended to improve that had prohibited pharmacists from volunteering that a
access to high-quality health care for patients, regardless of medication may be less expensive than an insurance co-pay
source of payment. Although legislative “repeal and replace” if purchased for cash—as was the case more than 20 percent
efforts aimed at reversing in entirety the regulatory burdens of the time.94 Data also reveals that prices vary tremendously
and taxes of the ACA have stalled, several directives and between drugstores for the same exact drug. According to a
agency-level initiatives have begun. Most can be considered December 2017 study, the national average price for a one-
deregulatory in nature, with specific objectives of improving month supply of five common generics ranged by a factor of
price transparency; reducing barriers to competition among twenty among different retailers for a given drug.95 Even in
insurers, providers, and sellers; empowering consumers with a single city, the thirty-day supply price showed a tenfold to
access to tools and information to assess value; expanding seventeenfold variation per drug. For the nearly forty million
choices; and decentralizing power from the federal government seniors taking five or more medications daily, the savings from
to the states. price comparison shopping could be hundreds of dollars per
month if patients were sufficiently informed and incentivized
Since 2017, specific deregulatory moves focused on health to consider prices.
insurance demonstrate the impact of deregulation and
included the following: (1) eliminating the individual mandate Meanwhile, the Centers for Medicare and Medicaid Services
by setting the regressive tax penalty to zero; (2) permitting (CMS) recently finalized its mandate requiring pharmaceutical
lower-cost, reduced-mandate group insurance offerings by manufacturers to disclose the list price of prescription drugs
broadening availability of Association Health Plans; and (3) in direct-to-consumer television advertisements. The Trump
reversing a regulatory limitation on lower-cost Short-Term administration also announced a proposal to do away with
Limited-Duration Plans. By expanding lower-cost-coverage complex behind-the-scenes arrangements that generate
choices for consumers and increasing competition among rebates96 of $179 billion to pharmacy benefit managers
insurers, these deregulatory actions are estimated to save (PBMs), replacing rebates with discounts to beneficiaries
Americans $450 billion over the decade.91 (patients) at the point of sale. PBMs are middlemen that
control “formularies,” the lists of drugs covered by a plan.
Insurance deregulation has also been implemented under Rebates from drug companies to PBMs are payments for
Medicare. Nationwide, a record 3,148 private insurance plans influence—either to position a drug on the formulary as
now participate in Medicare Advantage (MA), a private “exclusive” or to give it preferred status over competitors.
coverage alternative to traditional government Medicare PBMs act counter to patient interests while aggravating the
insurance selected by about one-third of seniors. After reversing lack of price transparency. These complex behind-the-scenes
a regulatory cap on MA plans, the average Medicare beneficiary rebates reward inflated list prices, on which patient premiums
can now choose from twenty-eight plans offered by seven are often based. This prevents patients from taking account of
firms in 2020. Nationally, the increase is 15 percent over 2019 price. A growing number of tools are now becoming available
and provides the largest number of plans in the history of the to compare prices. CMS finalized a rule in 2018 requiring
program. The continual increase in choices of coverage under Medicare Part D drug plans to provide electronic tools to
MA from nineteen in 2016 to twenty-eight in 2020 reversed doctors that would at least allow discussion with patients
the trend of reduced choices under the Obama administration, regarding out-of-pocket costs for prescription drugs at the
when thirty-three plans offered in 2010 declined to eighteen in time a prescription is written.
2015.92 These private plans provide extra benefits not covered
by traditional Medicare. HHS Secretary Alex Azar announced High drug prices represent an especially difficult issue in
that average premiums for MA plans will drop by 23 percent health care. Drugs are probably the most significant reason
compared with 2018—down to the lowest monthly premiums for the past half century’s unprecedented gains against the
since 2007—likely a result of competition among insurers. This deadliest, most debilitating diseases. Yet there is a long-
reduction in premiums reversed the increases seen from 2012 standing conundrum: the same policies that are associated
through 2015 under the Obama administration’s regulatory with the lower prices seen in other countries—price regulation
policies. and weaker patent rights—are also associated with delayed
launches and reduced access to drugs.97 Any regulatory policy
14 Hoover InstitutionYou can also read