Sustainable nutrition in company and educational facilities as well as prisons
←
→
Page content transcription
If your browser does not render page correctly, please read the page content below
Copyright!
Reproduction and dissemination – also partial – applicable to all media only
Peer Review | Sustainable Nutrition with written permission of Umschau Zeitschriftenverlag GmbH, Wiesbaden.
Sustainable nutrition in company and
educational facilities as well as prisons
Nutritional and ecological improvements of catering services
Henriette Knöbel+, Urte Grauwinkel+, Tanja Dräger de Teran, Kerstin Weber, Torsten von Borstel, Toni Meier
References
1. Rockström J, Sukhdev P: How food connects all the SDGs. 2016. https://stock ficiency and beyond. Molecular nutrition & food research
holmresilience.org/research/research-news/2016-06-14-how-food-connects-all- 2019; 63(6): 1801178.
the-sdgs.html (last accessed on 18 June 2019). 13. Frischknecht R, Büsser Knöpfel S: Ökofaktoren Schweiz
2. Willett W, Rockström J, Loken B et al.: Food in the anthropocene: the EAT–Lan- 2013 gemäß der Methode der ökologischen Knappheit.
cet Commission on healthy diets from sustainable food systems. Lancet 2019; Methodische Grundlagen und Anwendung auf die
393(10170): 447–92. Schweiz. Umwelt-Wissen Nr. 1330. Bern: Bundesamt für
3. Food Service: Die Branche und das Virus: Alle Artikel zur Corona-Krise. www. Umwelt 2013.
food-service.de/dossiers/coronavirus/ (last accessed on 28 August 2020). 14. WWF, UAW, INL: Abschlussbericht Essen in Hessen – auf
4. Meier T, Senftleben K, Deumelandt P et al.: Healthcare costs associated with an ad- dem kulinarischen Weg zur Nachhaltigkeit. World Wide
equate intake of sugars, salt and saturated fat in Germany: a health econometrical Fund for Nature (WWF), United Against Waste e. V.
analysis. PLoS ONE 2015; 10(9): e0135990. (UaW), Institut für nachhaltige Land- und Ernährungs
5. GBD 2017 Diet Collaborators: Health effects of dietary risks in 195 countries, wirtschaft e. V. (INL). 2019. www.nutrition-impacts.
1990–2017: a systematic analysis for the Global Burden of Disease Study 2017. org/files/hEssen/WWF_EssenInHessen_JederBiss_WEB.
Lancet 2019; 393(10184): 1958–72. pdf (last accessed on 21 August 2019).
6. Dräger de Teran T, Weber K, Meier T et al.: Das Projekt „Essen in Hessen“: Imple- 15. ISO 14067: Greenhouse gases – carbon footprint of prod-
mentierung der Themen „Ressourcenschonende Ernährung“ und „Vermeidung von ucts – requirements and guidelines for quantification and
Lebensmittelabfällen“ in der Außer-Haus-Verpflegung. In: Laux B; Stomporowski communication. Genf: International Organization for
S (ed.): Nachhaltigkeit in den Bereichen Tourismus, Hotelgewerbe und Ernährung. Standardization 2013.
Hohengehren: Schneider Verlag 2018. 16. ISO 14046: Environmental management – water foot-
7. WWF: Essen in Hessen – Hintergrundpapier Nachhaltigkeitsberichterstattung. print – principles, requirements and guidelines. Genf:
Berlin: World Wide Fund for Nature (WWF) 2019. www.nutrition-impacts.org/ International Organization for Standardization 2014.
files/hEssen/WWF_EssenInHessen_JedesWort_WEB.pdf (last accessed on August 17. Meier T, Christen O, Jahreis G et al.: Balancing virtual
21 2019). land imports by a shift in the diet: using a land balance
8. WWF, UAW, INL: Abschlussbericht „Essen in Hessen –Handlungsempfehlungen approach to assess the sustainability of food consump-
an Politik und Wirtschaft“. World Wide Fund for Nature (WWF), United Against tion. Appetite 2014; 74: 20–34.
Waste e. V. (UaW), Institut für nachhaltige Land- und Ernährungswirtschaft 18. T eitscheid P, Langen N, Speck M et al.: Nachhaltig außer
e. V. (INL): 2019. www.nutrition-impacts.org/files/hEssen/WWF_EssenInHessen_ Haus essen – Von der Idee bis auf den Teller. München:
JederSchritt_WEB.pdf (last accessed on 21 August 2019). oekom Verlag 2018.
9. Meier T, Gärtner C, Christen O: Bilanzierungsmethode susDISH - Nachhaltigkeit 19. Bohl A, Grabolle A, Kallsen-Mackenzie S: Gemeinschafts-
in der Gastronomie – Gesundheits- und Umweltaspekte in der Rezepturplanung verpflegung – Vegan. Potentiale und Herausforderungen.
gleichermaßen berücksichtigen. Institut für Agrar- und Ernährungswissenschaften, 2017. www.bzfe.de/_data/files/eif_2017_07-08_
Universität Halle-Wittenberg. Frankfurt (Main): DLG-Mitteilungen 01/2015. gemeinschaftsverpflegung-vegan.pdf (last accessed on 11
10. Meier T, Grauwinkel U, Forner F et al.: Gesundheitliche und ökologische Auswer- July 2019).
tung von 610 Rezepturen in der Außerhausverpflegung: Analyseergebnisse der Bilan- 20. DGE: Weniger Fleisch auf dem Teller schont das Klima.
zierungsmethode susDISH. In: Teitscheid P, Langen N, Speck M et al. (ed.): Nachhal- DGE unterstützt Forderungen des WWF nach verrin-
tig außer Haus essen – Von der Idee bis auf den Teller. München: oekom Verlag 2018. gertem Fleischverzehr. 2015. www.dge.de/uploads/
11. DGE: Umsetzung der D-A-CH-Referenzwerte in die Gemeinschaftsverpflegung – Er- media/DGE-Pressemeldung-aktuell-05-2015-fleisch.pdf
läuterungen und Tabellen. Bonn: Deutsche Gesellschaft für Ernährung 2013. (last accessed on 11 July 2019).
12. Ströhle A, Richter M, González-Gross, M et al., German Nutrition Society (DGE): 21. Volkhardt I, Semler E, Keller M et al.: Checklist for a
The revised D-A-CH-reference values for the Intake of vitamin B12: prevention of de- vegan lunch menu in public catering. Ernahrungs Um-
e22 Ernaehrungs Umschau international | 9/2020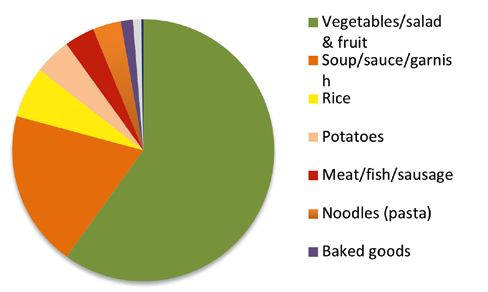
Copyright!
Reproduction and dissemination – also partial – applicable to all media only
with written permission of Umschau Zeitschriftenverlag GmbH, Wiesbaden.
schau 2016; 63(9): 176–84. 27. C erutti A K, Ardente F, Contu S et al.: Modelling, assess-
22. Meier T: Sustainable nutrition between the poles of health and environment Po- ing, and ranking public procurement options for a cli-
tentials of altered diets and avoidable food losses. Ernahrungs Umschau 2015; mate-friendly catering service. International Journal of
62(2): 22–33. Life Cycle Assessment 2018; 23(1): 95–115.
23. Mekonnen MM, Hoekstra AY: The green, blue and grey water footprint of crops and 28. Müller C, Stucki M, Zehnder P et al.: The “Menu Sus-
derived crop products. Value of Water Research Report Series No. 47. Delft/Nether- tainability Index”. Assessment of the environmental and
lands: UNESCO-IHE 2010. health impact of foods offered in commercial catering.
24. Bundesministerium für Landwirtschaft und Ernährung: Nationale Strate Ernahrungs Umschau 2016; 63, 198–205.
gie zur Reduzierung der Lebensmittelverschwendung. 2019. www.bmel. 29. E ngelmann T, Speck M, Rohn H et al.: Sustainability as-
de/DE/Ernaehrung/ZuGutFuerDieTonne/_Texte/Strategie-Lebensmittelver sessment of out-of-home meals: potentials and challenges
schwendung.html (last accessed on 07 August 2019). of applying the indicator sets NAHGAST Meal-Basic and
25. Jungbluth N, Keller R, König A: ONE TWO WE—life cycle management in canteens NAHGAST Meal-Pro. Sustainability 2018; 10(2): 562.
together with suppliers, customers and guests. International Journal of Life Cycle
Assessment 2016; 21(5): 646–53.
DOI: 10.4455/eu.2020.046
26. Pulkkinen H, Roininen T, Katajajuuri J M et al.: Development of a climate choice
meal concept for restaurants based on carbon footprinting. International Journal of
Life Cycle Assessment 2016; 21(5): 621–30.
Online-Supplement
Sustainable nutrition in company and
educational facilities as well as prisons
Nutritional and ecological improvements of catering services
Henriette Knöbel+, Urte Grauwinkel+, Tanja Dräger de Teran, Kerstin Weber, Torsten von Borstel, Toni Meier
Selection of the participating companies Prisons: The facilities were selected because, to
our knowledge, no comparable studies have
The selection of the participating kitchens was carried out by the been carried out in prisons to date. The three
Hessian Ministry for the Environment, Climate Protection, Agri- participating prisons are a women's prison, a
culture and Consumer Protection (HMECAC), which, with regard men's prison and a juvenile detention center.
to the selection of the prisons obtained the consent of the Hessian Company restaurants: In the case of company
Ministry of Justice. In selecting the companies, the following cri- restaurants managed by private catering com-
teria were considered. panies, care was taken to ensure that diffe-
- Catering of healthy adults: All participating facilities should pri- rent target groups – office staff and physical
marily work in the field of adult catering. Specific population workers – were included. Among the catering
groups (sick, elderly, pregnant/ nursing women, etc.), for which companies, preference was given to companies
specific nutritional recommendations apply, were not in focus. that manage several company restaurants
- Spatial focus: all participating companies should be located in
Hesse.
- CC segments: according to the HMECAC company restaurants,
educational institutions and prisons should be included. +
Shared first authorship.
Ernaehrungs Umschau international | 9/2020 e23Copyright!
Reproduction and dissemination – also partial – applicable to all media only
Peer Review | Sustainable Nutrition with written permission of Umschau Zeitschriftenverlag GmbH, Wiesbaden.
t hroughout Germany or worldwide, in order to enable easy mul- Combining the waste analysis
tiplication of the results. tool and the accounting and
Educational institution: Also, in case of the participating educa optimisation tool susDISH
tional institution preference was given to companies that manage
several facilities throughout Germany in order to enable easy To determine the environmental impacts of
multiplication of the results. the food waste, component-specific environ-
Further information on the selection of the participating facilities mental indicators were integrated into the
can be found in the final reports of the project [1]. waste analysis tool ( Table 1).
Life cycle assessment (LCA) approach
and system boundaries
Waste analysis tool from United Against In accordance with the ISO standard 14040/44
Waste (UAW) (2006), life cycle inventory data were calcula-
ted by attributive modeling and mass alloca-
Method of measuring food waste in four sections tion [3]. The system boundaries were defined
All food waste generated is collected daily in the kitchen and sorted in the project from cradle-to-fork, i. e. all
into four transparent collection containers. The four collecting environmental impacts along the food chain
containers represent the following kitchen process: (i) waste from from the primary agricultural production and
storage by expiration of the best before date, (ii) production waste processing to the use of the products in the
during processing (peeling of carrots, etc.), (iii) overproduction canteen kitchens including transport, packa-
and (iv) plate return. The waste volumes of the four containers are ging and preparation were considered. Credits
separately weighed daily and corresponding quantities documen- or additional environmental burdens from
ted. Subsequently, the daily results and the number of produced the recycling of food and packaging waste (in
dishes are transferred to the online-based waste analysis tool [2]. biogas or waste incineration plants) were not
Although coffee and tea residues as well as oil waste (grease traps) included.
are collected separately within the waste analysis tool of UAW,
these were not included in this project because the avoidable waste Carbon footprint
was in the focus. The accounting of the carbon footprint (green-
house gas emissions) is based on the ISO stan-
Online based-waste analysis tool dard 14067 (2013) [4] and IPCC (2006) [5].
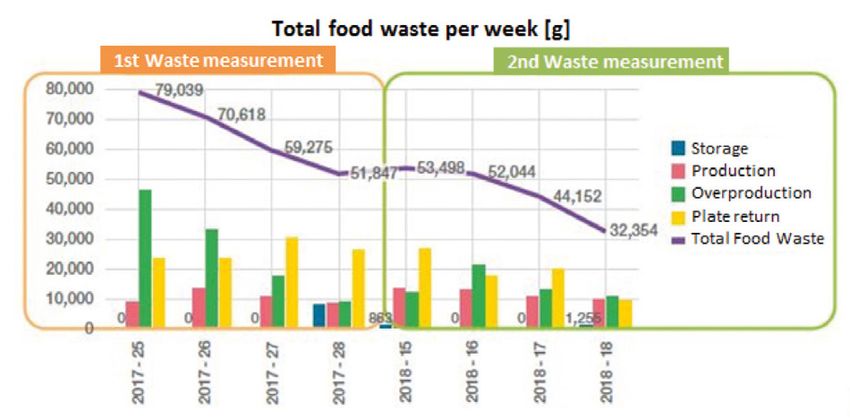
The kitchen staff enter their measurement results into the on- The following characterization factors (CH4
line-based waste analysis tool on a daily basis. The data entered = 25, N2O = 298) were used to calculate the
is used to visualize changes and thus the success and failure of greenhouse gas potential in CO2-equivalents
implemented measures in diagrams ( Figure 1). (CO2e)
Hence, employees can easily see where food waste is generated in
the kitchen process. Various measures – such as a changed offer Water footprint
(including various portion sizes, improved management of the The accounting of the water footprint is based
buffet and serving) – can thus be directly implemented and make on the ISO standard 14046 (2014) [6]. Ac-
a significant contribution to waste prevention. cordingly, only blue water is balanced. This
On the basis of the measurements carried out so far with the includes water used in agriculture, food in-
waste analysis tool, UAW was able to develop valid key figures dustry and gastronomy, which is used via
and average values in the area of food waste for out-of-home channels and pipelines for watering animals,
catering [2]. for irrigating vegetables in greenhouses and in
open-fields, for cleaning in the food industry
or for cooking, etc. Green water (direct pre-
cipitation) and grey water (sewage) are not
Average composition of food waste considered in the method.
As the individual components could not be analyzed separately Land footprint
when measuring the food waste, the calculation of the environ- The accounting of the land footprint is based
mental impacts of the waste is based on a defined composition on statistically recorded yields (t/ha), which
of a standard waste. The percentage values of this standardized were converted into corresponding area fac-
composition were generated on the basis of more than 250 mea- tors (m²/kg) [7]. A distinction is made be
surement results from company restaurants (n = 269), as well as tween several types of land (arable land con-
the exchange of experience with company and kitchen managers ventional/organic, grassland/conventional/
[2]. The exact composition of this standard waste by components organic, permanent crops/conventional/or-
is shown in Figure 2. ganic, forest area).
e24 Ernaehrungs Umschau international | 9/2020Copyright!
Reproduction and dissemination – also partial – applicable to all media only
with written permission of Umschau Zeitschriftenverlag GmbH, Wiesbaden.
Fig. 1: Example for the presentation of the measurement results in the waste analysis tool [1]
Overall environmental indicator: Example recipes
Environmental impact points (eco-points)
The method of ecological scarcity used here takes into account 15 Example recipe 1: chicken fricassee
different environmental indicators (emissions of CO2, CH4, N2O, with rice ( Table 2)
NH3, NO, NMVOC, SO2, H2S, HCl, N-surplus, P- surplus, demand With 809 kcal and 20 g fat (optimum:
of blue water, use of pesticides, primary energy demand, land 28–32 g), the dish was evaluated in the ba-
use), which are evaluated with regard to the impact indicators seline survey as energetically balanced but
greenhouse gas effect, air pollution, acidification, eutrophication, low in fat. In addition, only low levels of vi-
human- and eco-toxicity, cumulative energy demand (CED) as tamin B1, vitamin C, calcium and iron were
well as biodiversity loss. Since 15 different environmental impacts present. By reducing the meat from 135 g to
cannot be communicated in a practicable way, these are weighted 120 g, the environmental impact (from 88 to
using the method of the ecological scarcity [8]. 82 Eco-points) was slightly reduced. By sup-
To this end, indicator-specific environmental impact points (eco- plementing the recipe with green peas the vi-
points) were derived on the basis of official material flows (refe- tamin B1 content and the fiber content could
rence year 2010) and corresponding political targets in Germany. be increased. The addition of lemon concen-
Hence, the method can be used to compare different environmen- trate increased the vitamin C content and the
tal impacts with each other and thus make them calculable. The absorption of the iron contained in meat and
carbon, water and land footprint are part of the overall indicator. green peas.
However, motivated by a recommendation for
a different recipe, the kitchen used bulgur in
the recipe instead of rice, whose cultivation is
associated with high water consumption and
high greenhouse gas emissions, and was thus
able to further reduce the Eco-points to 70 and
the carbon footprint to 0.9 kg CO2e.
Example recipe 2: beef goulash with
croquettes and broccoli ( Table 3)
The recipe beef goulash with croquettes and
broccoli ( Table 3) is characterized by a high
protein content of 53 g (optimum: 30–38 g).
Due to the beef content of 180 g, this recipe
in its baseline survey has the highest Eco-
Fig. 2: Composition of standard waste for the company catering sec- points, carbon footprint and the highest land
tor [2] footprint of all recipes examined in this ki-
Ernaehrungs Umschau international | 9/2020 e25Copyright!
Reproduction and dissemination – also partial – applicable to all media only
Peer Review | Sustainable Nutrition with written permission of Umschau Zeitschriftenverlag GmbH, Wiesbaden.
Compo- Carbon foot- Water foot- Land foot- Environmen- Notes
nentsa of the print print print tal impact
standard points
waste in the Greenhouse gas Water use (l/ Area (m2/kg)
company ca- emissions (kg kg) Eco-points/kg
tering [2] CO2e/kg)
Vegetables/ 1.56 111.95 0.49 58.47 Consisting of 50% of vegetables-EU
salad and fruit (prepared and fresh) and 50% fruit-EU
Soup/sauce/ 2.04 23.94 1.05 80.22 Consisting of 66% water,
garnish 19% vegetables-EU, 11% meat mix-DE,
3% oil mix, 1% salt
Rice 3.75 541.44 3.36 194.59 Origin: 50% from Thailand,
50% from Italy
Potatoes 1.64 16.53 0.33 32.39 Potato fresh, cooked
Meat/fish/ 9.64 50.08 9.54 593.19 Consisting of 40% of pork-DE,
sausage 20% poultry, 20% beef, 20% fish
Noodles 2.28 19.52 1.66 100.36 Based of durum wheat
(pasta)
Baked goods 1.92 14.62 1.66 96.81 Based of wheat
Dessert 2.63 20.57 1.89 120.47 Consisting of 79% milk,
18% sugar, 3% starch
Eggs/cheese 5.66 31.02 6.76 412.66 Consisting of 50% eggs, 50% cheese
Tab. 1: C
omponents of the standard waste and corresponding environmental indicators
a
in descending order
1chen. By reducing the meat content from 180 g to 120 g, the Example recipe 3: vegetable stew with
environmental impacts were reduced from 287 to 206 Eco-points. bread roll, apple ( Table 4)
A further reduction (from 206 to 80 Eco-points) was achieved by The dish was evaluated as low in protein (op-
the kitchen by using poultry instead of beef. The reduction of the timum: 30–38 g) with 20 g protein in the ba-
meat content also lowered the purchase price of the components. seline survey. Increasing the proportion of le-
The kitchen invested this economic saving for the purchase of gumes to 60 g, increases the protein and fiber
broccoli from organic farming. content. With only 4 g fat, the recipe was also
rated as very low in fat (optimum: 28–32 g).
By adding 20 g rapeseed oil, the amount of
fat in one portion was increased to 24 g. With
HP Eco-Points Carbon foot- Water Land foot- 21 g (2.5 g/100 g vegetable stew) of salt, the
print [kg CO2e] footprint print [m²] recipe was classified as too salty in the base-
[L] line. A gradual reduction of the salt content
BASELINE 9.7 88 1.1 77.3 1.3 was recommended in order to maintain the
Recommendations: taste acceptance by the guest.
• reduce poultry meat from 135 g to 120 g
• add 15 g pulses (e. g. green peas) to the recipe
• add 3 g lemon concentrate
TARGET 10.2 82 1.1 77.0 1.2
Implementation by the kitchen:
• meat component reduced from 135 g to 120 g
• recipe supplemented with 15 g green peas
• 3 g lemon concentrate added
• use of bulgur instead of rice
FINAL 12.0 70 0.9 8.4 1.1
Tab. 2: C
hicken fricassee with rice
(the numbers presented are referred to one portion; total planned
portions: 850)
e26 Ernaehrungs Umschau international | 9/2020Copyright!
Reproduction and dissemination – also partial – applicable to all media only
with written permission of Umschau Zeitschriftenverlag GmbH, Wiesbaden.
References HP Eco-Points Carbon foot- Water Land foot-
print [kg CO2e] footprint print [m²]
1. WWF, UAW, INL: Abschlussbericht „Essen in Hessen [L]
–Handlungsempfehlungen an Politik und Wirtschaft“. BASELINE 13.1 287 5.0 33.4 5.2
World Wide Fund for Nature (WWF), United Against
Recommendations:
Waste e. V. (UAW), Institut für nachhaltige Land- und
• reduce beef component from 180 g to 120 g
Ernährungswirtschaft e. V. (INL). 2019. www.nutri-
• enrich goulash with maize and legumes (e.g. runner beans, lima beans or
tion-impacts.org/files/hEssen/WWF_EssenInHessen_
kidney beans)
JederSchritt_WEB.pdf (last accessed on 30 October
TARGET 13.0 206 3.7 26.9 3.6
2019).
2. UAW: Ein Drittel landet in der Tonne, Zwischenbilanz Implementation by the kitchen:
2017: Fakten und Messergebnisse zum deutschlandweiten • meat content reduced from 180 g to 120 g
Lebensmittelabfall in der Außer-Haus-Verpflegung. • beef replaced by poultry-meat
United Against Waste e. V. (UAW), Biberach Riss 2017. • use of organically grown broccoli
www.united-against-waste.de/der-verein/zwischenbi END 13.6 80 1.3 14.7 1.1
lanz (last accessed on 12 November 2019).
3. ISO 14040/14044: Environmental management – Life
Tab. 3: Beef goulash with croquettes and broccoli
Cycle Assessment – principles and framework. Genf: (the numbers presented are referred to one portion; total planned
International Organization for Standardization 2006. portions: 850)
4. ISO 14067: Greenhouse gases – carbon footprint of prod-
ucts – requirements and guidelines for quantification HP Eco-Points Carbon foot- Water Land foot-
and communication. Genf: International Organization print [kg CO2e] footprint print [m²]
for Standardization 2013. [L]
5. IPCC. 2006 IPCC Guidelines for national greenhouse gas BASELINE 9.3 36 0.5 63.4 0.4
inventories. Volume 4, Japan 2006.
Recommendations:
6. ISO 14046: Environmental management – water foot-
• increase the amount of fat by 20 g (e. g.: by adding 20 g of vegetable
print – principles, requirements and guidelines. Genf:
margarine or 20 g rapeseed oil)
International Organization for Standardization 2014.
• increase the green pea and bean content to 30 g each
7. Meier T, Christen O, Jahreis G, et al.: Balancing virtual
• gradual reduction of the salt content
land imports by a shift in the diet: using a land balance
TARGET 10.2 40 0.6 68.4 0.5
approach to assess the sustainability of food consump-
tion. Appetite 2014; 74: 20–34. Implementation by the kitchen:
8. Frischknecht R, Büsser Knöpfel S: Ökofaktoren Schweiz • addition of 20 g rapeseed oil
2013 gemäß der Methode der ökologischen Knappheit. • increase the green pea and bean content to 30 g each
Methodische Grundlagen und Anwendung auf die • gradual reduction of the salt content
Schweiz. Umwelt-Wissen Nr. 1330. Bern: Bundesamt FINAL 10.3 38 0.6 64.4 0.4
für Umwelt 2013.
Tab. 4: Vegetable stew with bread roll, apple
(the numbers presented are referred to one portion; total planned
portions: 240)
Ernaehrungs Umschau international | 9/2020 e27You can also read