Structural and Optical Properties of Calcium Titanate Prepared from Gypsum
←
→
Page content transcription
If your browser does not render page correctly, please read the page content below
Hindawi
Journal of Nanotechnology
Volume 2022, Article ID 6020378, 9 pages
https://doi.org/10.1155/2022/6020378

Research Article
Structural and Optical Properties of Calcium Titanate
Prepared from Gypsum

 Massaud Mostafa ,1,2 Z. A. Alrowaili ,1 M.M. Al Shehri ,1 M. Mobarak ,1,3
 and Ahmed M. Abbas 4,5
 1
 Physics Department, College of Science, Jouf University, Sakaka, Saudi Arabia
 2
 Laser Technology & Environment Laboratory, Physics Department, Faculty of Science, South Valley University,
 Qena 83523, Egypt
 3
 Physics Department, Faculty of Science, South Valley University, Qena 83523, Egypt
 4
 Biology Department, College of Science, King Khalid University, Abha 61413, Saudi Arabia
 5
 Department of Botany and Microbiology, Faculty of Science, South Valley University, Qena 83523, Egypt

 Correspondence should be addressed to Massaud Mostafa; mmostafa@ju.edu.sa

 Received 1 January 2022; Revised 26 February 2022; Accepted 1 March 2022; Published 24 March 2022

 Academic Editor: Jagpreet Singh

 Copyright © 2022 Massaud Mostafa et al. This is an open access article distributed under the Creative Commons Attribution
 License, which permits unrestricted use, distribution, and reproduction in any medium, provided the original work is
 properly cited.
 Ceramic materials have been used in various human health-related applications for considerable time. One of the important
 applications of ceramic materials is in electronics. Our work focuses on calcium titanate (CaTiO3). CaTiO3 is typically created via
 sintering. Gypsum particles is used to form calcium hydroxide, which is then combined with titanium dioxide to form rutile
 crystals. Thereafter, calcination is performed at 900°C, 1000°C, and 1100°C for 2 h. X-ray diffraction is employed to track the
 evolution of the CaTiO3 phase. Scanning electron microscopy is used to characterize the morphologies of the different preparation
 steps. As the calcination temperature increases from 900°C to 1000°C, the crystallite size of CaTiO3 increases from 35 nm to 45 nm.
 Furthermore, the energy gaps of the CaTiO3 powders obtained after calcination at 900°C and 1000°C are 5.32 eV and 5.43 eV,
 respectively, and their particle sizes are 150–200 nm and 200–300 nm, respectively.

1. Introduction the most widely used method. CaTiO3 exhibits excellent
 qualities as a multifunctional material, including optical
The general formula of perovskites is ABO3 (A is a rare or properties, high dielectric constant, ferroelectricity, chem-
alkaline earth metal and B is a first-row transition metal). ical stability, small dielectric loss, low cost, and environ-
Calcium titanate (CaTiO3), which is considered as the mental friendliness [11]. Several properties of CaTiO3 have
“founding father” of the perovskite family of titanium-based been explored owing to its broad applications. CaTiO3 shows
perovskite-type oxide photocatalysts [1–7], is attracting electrical properties when it is applied to electronic devices
increasing attention. CaTiO3 is a chemically stable n-type such as capacitors and thermistors. Hence, it has been ex-
semiconductor with a broad bandgap of 3–3.5 eV [8]. Ca tensively explored as an electroceramic material. In addition,
ions are located at the corners (1/2, 1/2, 1/2), Ti at the body it is known as a microwave ceramic owing to its dielectric
center (0, 0, 0), and oxygen at the face center (1/2, 0, 0; 0, 12, response in the microwave spectrum. The photocatalytic
0; 0, 0, 1/2) [9]. CaTiO3 is an alkaline earth metal titanate activity and dynamic efficiency of CaTiO3 have been in-
composed of earth-abundant nontoxic elements. It is fab- vestigated in decomposing organic dye waste in aquatic
ricated using various methods [10], e.g., solid-state, copre- environments and water splitting for H2 production, CO2
cipitation, mechanochemical, sol-gel, hydrothermal, and reduction, and other applications. CaTiO3 has been devel-
solvothermal processes. Among these, the sol-gel process is oped as an implant material for biomedical applications in
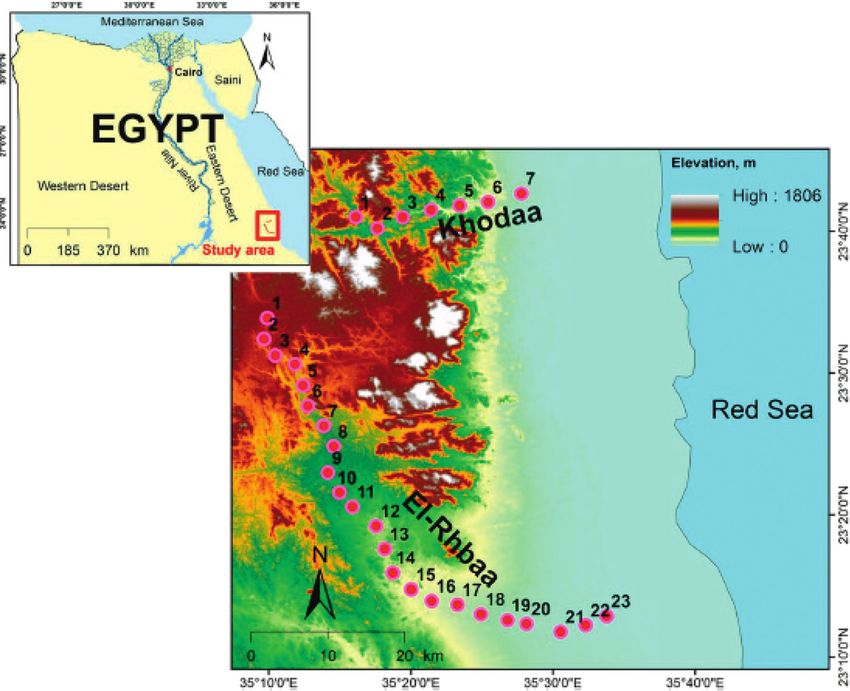
2 Journal of Nanotechnology

composites with hydroxyapatite [12]. Furthermore, it is a 30 mA with CuKα radiation using a monochromator. Op-
good substitute for the commercial titanium dioxide (TiO2) tical properties of the nanoparticles were studied by a UV-
catalyst in photocatalytic applications. The property of visible spectrophotometer (UV2300II). The Fourier trans-
volume growth caused by water absorption is observed in mission infrared (FTIR) spectra of the samples were
rocks containing clay minerals and anhydrite. Rock swelling recorded by using FTIR (Shimadzu, model DF 803) in the
is a term used to describe this phenomenon. The origin of wave range 400–4000 cm. Scanning electron microscopy
swelling in anhydrite is chemical, and it depends on the (JEOL, JSM 5500LV) and transmission electron microscopy
transformation of anhydrite into gypsum [13]. The solid- (JEOL, JEM 1010) were employed to reveal the micro-
solid reaction of CaO or Ca(OH)2 with TiO2 at a specific structure of the synthesized powders, whereas the elemental
molar content is the basic principle of the synthesis of analysis was studied using energy dispersive spectroscopy
CaTiO3 perovskite material [14]. Calcium can be obtained (Oxford Instruments, ISIS Link).
from a low-cost source such as gypsum. Aside from the
benefits of using gypsum as a low-cost calcium source, this
research attempted to manufacture CaTiO3 perovskite 3. Results and Discussion
material from gypsum and test it on a laboratory scale as a
simple and low-cost ceramic material. 3.1. XRD Characterization. Figure 4 shows the XRD patterns
 The goal of this study was to synthesize CaTiO3 using a obtained at different steps during the preparation of CaTiO3.
sol-gel technique with calcium hydroxide (Ca(OH)2) and Broad XRD peaks suggest the presence of nanocrystalline
TiO2 as starting materials and ethanol as the dispersion particles. The XRD patterns were used to calculate the
medium. Gypsum rock samples were collected from a crystallite sizes and strain were using Scherrer’s formula and
specified site in Gebel Elba National Park in southeastern the Williamson–Hall equation. The results are given in
Egypt, as shown in Figure 1, and Ca(OH)2 was obtained Table 1.
from treated gypsum rocks. The gels disintegrated into Figure 4(a) shows the XRD patterns of gypsum
CaTiO3 precipitates. Crystalline CaTiO3 powders were ob- (CaSO4·2H2O). XPert HighScore was used to analyze the
tained by calcining the precipitate at 900°C, 1000°C, and XRD results to obtain the Miller indices and crystallographic
1100°C for 2 h. Transmission electron microscopy (TEM), parameters of mineral gypsum, as given in Table 1.
X-ray diffraction (XRD), and scanning electron microscopy Figure 4(b) shows the XRD patterns for CaSO4. The
(SEM) were performed to study the microstructural and Match software was used to identify CaSO4 peaks.
morphological behavior of dried CaTiO3 sol-gel powders. Figure 4(c) shows the main compounds present in the three
 analyzed Ca(OH)2 samples. The peaks are assigned to KOH
 (α) in addition to Ca(OH)2. This may be because KOH and
2. Materials and Methods CaSO4 did not fully react. This indicates that the reactants
 may need to be stirred for longer than 2 h. However, this step
First, the raw material was collected from gypsum stones
 of the preparation was not returned because of the expec-
washed using distilled water and then ground with a heavy
 tation that KOH will evaporate during calcination.
grinder. Next, the small stone pieces were milled using a ball-
milling machine to obtain gypsum powder with the chemical CaSO4 + 2KOH ⟶ Ca(OH)2 + K2 SO4 . (1)
formula of CaSO4.2H2O. Commercially available rutile ti-
tanium dioxide (TiO2) was used to synthesize CaTiO3 In this reaction, calcium sulfate joins with potassium
powders via combustion. Calcium sulfate (CaSO4) powder hydroxide, a base. The OH− from the base joins to form
was obtained by calcining the gypsum powder at 500°C to calcium hydroxide, while the SO−4 and K+ ions join to form
evaporate H2O particles. Then, the powder was mixed with potassium sulfate. A chemical filter paper is used to separate
potassium hydroxide (KOH) for 1 h using a magnetic stirrer calcium hydroxide and remove potassium sulfate, as shown
at a temperature of 80°C. The mixture was filtered to obtain in Figure 2.
Ca(OH)2. Figure 2 shows the preparation steps. The XRD patterns were analyzed to assess the crystal
 The sol-gel method was used to produce CaTiO3 powder structure. Figure 4(d) shows the XRD patterns of the CaTiO3
from Ca(OH)2 powder and TiO2. These were added to powder produced after calcination at 900°C for 2 h. The
distilled water and stirred for 2 h at 80°C to obtain all re- diffraction patterns of CaTiO3 are consistent with the JCPDS
actants in the form of a gel. The gel was dried at 70°C for 20 h card (no. 22-0153). A few minor peaks (denoted by β) are
to obtain a powder, which was sintered at 900°C, 1000°C, and caused by TiO2 impurities, which are associated with an
1100°C for 2 h. The final powder was pressed into pellets and incomplete reaction. In addition, we assume an ortho-
sintered at 1000°C. The powder samples were characterized rhombic phase because of the Pbnm space group. The
using XRD, SEM, and TEM, as shown in Figure 3. crystallographic variables obtained from the XRD analysis
 are given in Table 2.
 The XRD patterns were analyzed to assess the crystal
2.1. Measurements. All prepared particles were character- structure. Figure 4(e) shows the XRD results of the CaTiO3
ized by XRD. Particles were observed with a Zeiss LEO 912 powder produced via calcination at 1000°C for 2 h. The
OMEG operated at 100 kV accelerating voltage. Crystal diffraction patterns are consistent with the JCPDS card (no.
structures of the particles were measured with an X-ray 22-0153). Additionally, a few small peaks (denoted by β) are
diffractometer (Rigaku RU-200A) operated at 40 kV and due to the presence of TiO2 impurities, indicating an
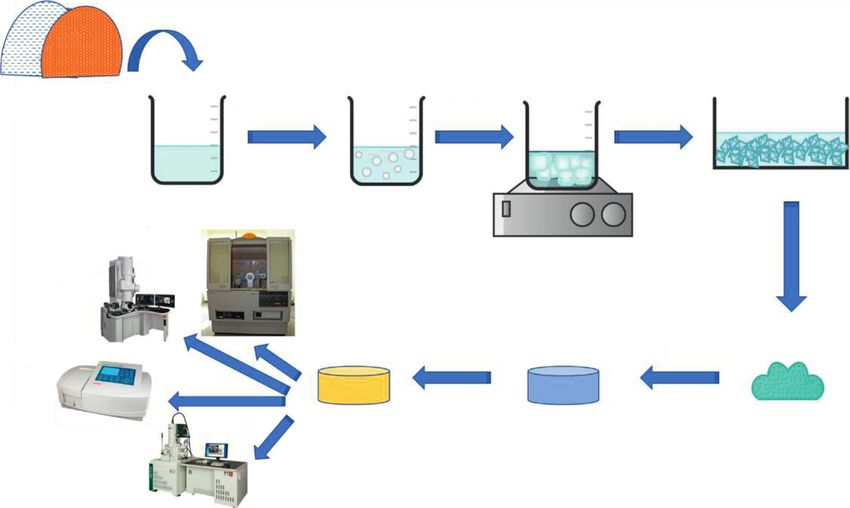
Journal of Nanotechnology 3

 Figure 1: Site map of the collected gypsum samples (Gabal Elbah) [15].

 Gypsum powder CaSO4 powder
 Gypsum rock
 Washing
 then
 cracking Ball milling Calcination

 500 ºC

 Plant extract

 Filtration
 Mixture
 TiO2 Dried Ca (OH)2 Graduated burette
 Ring stand Ring stand
 Ca (OH)2
 Filter Ca (OH)2 Clamp
 Dry paper
 Ring K (OH)

 80ºC
 CaSO4
 Filtrade K2SO4
 Calcination Magnetic stirrer
 900ºC, 1000ºC, and 1100ºC,

 CaTiO3

 Figure 2: Preparation of CaTiO3 powders via the sol-gel technique.

4 Journal of Nanotechnology

 TiO2
 Ca(OH)2

 Raw materials Condensation Gelation Dry

 Xerogel
 Solution of
 Sol Colloid
 precursor

 Gel Calcination
 XRD
 SEM

 UV spectroscopy Sintering Press

 Final product Pellet Powder

 TEM

 Figure 3: Block diagram of the sol-gel preparation method.

 Table 1: Crystal size values derived using the average Scherrer,
 (f) γ γ TiO
 (110)

 Ca Scherrer straight line, and Williamson–Hall methods.
 γ
 (200)

 (211)

 γ
 (220)

 γ
 Scherrer Williamson–Hall
 Material Strain
 (nm) (nm)
 β TiO2 CaSO4.2H2O 40 45.4 2.2 × 10⁻³
 (110)

 (e) β CaTiO3 (1000 °C)
 CaSO4 68.7 60 8.5 × 10⁻⁵
 β
 (100)

 (211)
 (111)

 (200)

 (210)

 β β β Ca(OH)2 39.9 40.2 1.5 × 10⁻³
 CaTiO3 (900°C) 35.4 30.2 1.006 × 10⁻⁶
 CaTiO3
 (d) β TiO2 45.2 46 7.3 × 10⁻⁴
 β CaTiO3 (900 °C) (1000°C)
 (110)
 Intensity (a.u.)

 (111)

 β
 (100)

 (200)

 (210)
 (103)

 (211)

 β
 β β
 Figure 4(f ) shows the XRD patterns of the powder
 (c) α K (OH) Ca (OH)2 produced via calcination at 1100°C for 2 h. These patterns
 (100)

 show that CaTiO3 is not formed. This may be because the
 (002)

 (110)
 (003)

 α
 (200)

 α α α bonds between Ca(OH)2 and TiO2 are destroyed at a high
 temperature. The XRD patterns show calcium (Ca) ions and
 TiO. We can assume that the phase of the Ca ions is cubic
 (020)

 (b) CaSO4
 with the Im-3m space group. The crystallographic param-
 (121)

 (022)
 (301)
 (131)
 (220)

 (032)

 (331)
 (123)

 eters obtained from the XRD analysis are given in Table 2.
 The expected reaction may be as follows:
 Ca(OH)2 + TiO2 ⟶ Ca + TiO + 2H2 O↑. (2)
 (002)
 (-202)

 (a)
 (-141)

 Gypsum
 (121)

 (131)
 (-251)
 (-112)

 (-242)
 (031)

 (-352)
 (-211)

 (-143)
 (-253)
 (060)

 Understanding the tolerance factor aids in the devel-
 opment of novel perovskite compounds. Goldschmid’s
 tolerance factor t was used to classify the synthesis of pe-
 20 30 40 50 60
 2 Theta (Deg.)
 rovskite-type compounds:

Figure 4: XRD patterns obtained at different CaTiO3 preparation r r
 t � √� A+ O , (3)
steps. 2 rB + rO
 where rA, rB, and rO are the effective ionic radii of A and B
incomplete reaction. The Pbnm space group indicates the sites and the oxygen ion sites, respectively, where
orthorhombic phase. The crystallographic parameters ob- rCa2+ � 1.48 Å, rTi4+ � 0.745 Å, and rO2− � 1.21 Å indicate
tained from the XRD analysis are given in Table 2. radii values. A site and B site cations’ bonding requirements
Journal of Nanotechnology 5

 Table 2: Crystallographic parameters of different materials.
Material Crystal system Space group Space group number a � b(A)_ _
 c(A) c/a α � Y(° ) β(° )
Gypsum Monoclinic 12/a 15 5.6 6.51 1.16 90 118.4
CaSO4 Orthorhombic Bmmb 63 6.992 6.24 0.89 90 90
Ca(OH)2 Orthorhombic Bmmb 136 4.58 2.95 0.69 90 90
CaTiO3 (900°C) Orthorhombic Pbnm 136 4.58 2.95 0.46 90 90
CaTiO3 (1000°C) Cubic Im-3m 229 4.47 4.47 1 90 90

 Ca2+ (A)
 Ti4+ (B)
 O2- (O)

 (a) (b)

Figure 5: (a) Ideal cubic perovskite structure for ABO3 (cyan, BO6 units; yellow, A atoms) (Reprinted with permission from reference
[18]-[11] copyright from Elsevier). (b) Illustration of the crystal structure of CaTiO3.

in the ABO3 perovskite is measured quantitatively by the where increased magnification resulted in visual blurring at
tolerance factor which reflects the distortion structure that higher magnifications.
contains the octahedral rotation and tilt. As the substituent
radii Ca2+ ion is at A site and radii Ti4+ ion at B site, the
tolerance factor calculated values of the CaTiO3 is 0.972. 3.3. TEM Characterization. Figures 7(a) and 7(b) show the
Hence, the general the structures tend to be in the perovskite TEM micrographs of CaTiO3 powders obtained after
structure as the calculated tolerance factor t ∼ 1 [16]. calcination at 900°C and 1000°C, respectively, and a
 The cubic structure of CaTiO3 is shown in Figure 5(b), spherical morphology is observed. Figures 6(c) and 6(d)
with Ca ions occupying the A site, Ti ions occupying the B show the length distribution histograms of these powders.
site, and O representing the oxygen anion [17–19]. However, In the CaTiO3 powder obtained after calcination at 900°C,
with CaTiO3 calcined at 900 C, the perovskite structure the size of most particles is 150–200 nm, and there are a
deviates from cubic symmetry and transitions to ortho- few agglomerated particles. The average particle size of the
rhombic phase, as given in Table 2, in order to fit the Ca2+ CaTiO3 powder obtained after calcination at 1000°C is
cations, which are smaller in size than the ideal ions for site 200–300 nm.
”A.” The tolerance factor is used to calculate the degree of
distortion in the ideal cubic structure (t). 3.4. Optical Properties. The UV-vis absorbance spectra (at
 room temperature) of CaTiO 3 powders are shown in
 Figure 8. The wavelength of the spectra is 200–800 nm.
3.2. SEM Characterization. Figure 5(a) shows the SEM The absorption decreases rapidly for a wavelength of
micrographs of gypsum powder; the particles are either 200–250 nm but remains almost constant for
rectangular or rod shaped. Figure 5(b) shows the SEM 250–800 nm.
micrographs of Ca(OH)2; the particles are either rectangular Wood and Tauc [20] demonstrated the relationship
or rod shaped. between the absorption curve and energy gap of a material.
 Figures 6(c) and 6(d) show the microstructures of The bandgap values were obtained by extrapolating the
CaTiO3 obtained after calcination at 900°C and 1000°C, linear region of the curve. According to this method, the
respectively. We can deduce that this substance appears energy dependence of the gap and optical absorbance can be
foamy. The microstructures of the particles are almost expressed as follows:
nonexistent. All of the CaTiO3 powders had an ultra-ag- 2
glomeration powder, and because of the chemically active hvα � hv − Eopt
 g ,
 (4)
particles, they agglomerate quickly. This is why it was so
difficult to achieve greater magnifications, as we had pre- where α is the absorbance, h is Planck’s constant, m is the
 opt
viously done with gypsum and calcium hydroxide samples, frequency, and Eg is the bandgap of a material.

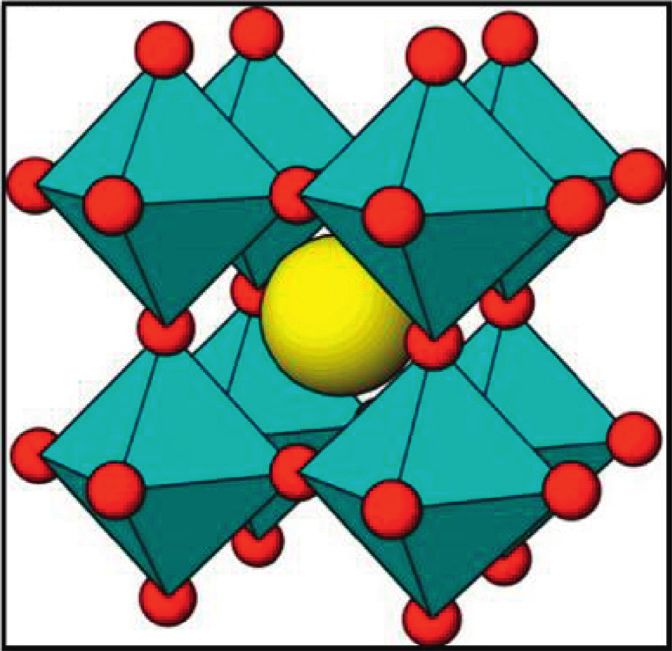
6 Journal of Nanotechnology

 (a) (b)

 (c) (d)

Figure 6: SEM micrograph of (a) gypsum, (b) Ca(OH)2, (c) CaTiO3 obtained after calcination at 900°C, and (d) CaTiO3 obtained after
calcination at 1000°C.

 100 nm 100 nm
 200 kV X25000 200 kV X25000

 (a) (b)
 Figure 7: Continued.

Journal of Nanotechnology 7

 16
 15 7
 14
 13 6
 12
 11 5
 10
 9 4
 count

 count
 8
 7 3
 6
 5 2
 4
 3
 2 1
 1
 0 0
 50 100 150 200 250 50 100 150 200 250 300 350 400
 Length (nm) Length (nm)

 length length
 (c) (d)

Figure 7: TEM micrographs of CaTiO3 obtained after calcination at (a) 900°C and (b) 1000°C. Length distribution histograms of CaTiO3
obtained after calcination at (c) 900°C and (d) 1000°C.

 0.7

 0.6

 0.5
 Abs (%)

 0.4

 0.3

 0.2

 200 300 400 500 600 700 800
 Wavelength (nm)

 900 °C
 1000 °C
 Figure 8: UV-vis absorbance spectra of CaTiO3 obtained after calcination at 900°C and 1000°C.
 (αhv)2 (cm-1 .eV)2

 5.32 eV 5.43 eV

 1 2 3 4 5 6 7
 hv (eV)

 900 °C
 1000 °C
 Figure 9: Energy gaps for CaTiO3 obtained after calcination at 900°C and 1000°C.

8 Journal of Nanotechnology

 the hydroxyl group and the stretching vibration of the
 adsorbed OH group.

 4. Conclusions
 CaTiO3 was successfully prepared from gypsum using a sol-
 gel method and characterized via TEM, XRD, and SEM.
 XRD analysis confirmed the presence of the pure crystalline
 CaTiO3 phase after calcination at 900°C and 1000°C for 2 h,
 along with unreacted TiO2 particles. According to TEM
 Intensity (a.u)

 observations, the CaTiO3 powder obtained after calcination
 at 900°C had a particle size of 150–200 nm and exhibited
 agglomeration of nanoparticles. The CaTiO3 powder ob-
 tained after calcination at 1000°C had a particle size of
 200–300 nm. SEM observations showed that CaTiO3 par-
 ticles did not have a specific microstructure. The energy gaps
 for CaTiO3 powders obtained after calcination at 900°C and
 1000°C were 5.32 eV and 5.43 eV, respectively. Infrared
 bands were analyzed to identify the functional groups of
 CaTiO3. The bands at approximately 570 cm−1 were due to
 the signature peak of the CaTiO3 bond. The band at 567 cm−1
 was due to Ti-O stretching vibration. Furthermore, the
 bands close to 460 cm−1 were attributed to the Ti-O-Ti
 500 1000 1500 2000 2500 3000 3500 4000
 bending mode.
 Wavenumber (cm-1)
 Data Availability
 1000 °C
 900 °C Data collected from the literature can be consulted in the
Figure 10: FTIR spectra of CaTiO3 obtained after calcination at relevant articles; the authors’ data are available upon request
900°C and 1000°C. to Dr. Massaud Mostafa at mmostafa@ju.edu.sa.

 Conflicts of Interest
 Figure 9 shows the calculated bandgaps for CaTiO3
powders obtained after calcination at 900°C and 1000°C, The authors declare that they have no conflicts of interest.
which are 5.32 and 5.43 eV, respectively.
 Egap values were measured in previous research, and the
results were calculated by extrapolating the linear section of
 Acknowledgments
the curve using linear regression to arrive at Egap values of The authors are thankful to the technician members
about 3.51 eV [21]. An increase in the bandgap may be (H. Mohamed, A. Ibrahem, N. Maghrabi, H. Barakat, and
identified for the current CaTiO3 when compared to pre- F. Elrashedi) of the Central Laboratory, South Valley Uni-
vious works, which can be due to the existence of TiO2 versity, for providing XRD and electron microscope
secondary phase, which can cause defects such as distortions facilities.
along CaO linkages, which result in localized electronic
levels in the band gap.
 References
 [1] R. Acharya and K. Parida, “A review on TiO2/g-C3N4 visible-
3.5. Fourier-Transform Infrared Spectroscopy Analysis. light- responsive photocatalysts for sustainable energy gen-
Fourier-transform infrared spectroscopy (FTIR) analyses eration and environmental remediation,” Journal of Envi-
were performed for CaTiO3 powders obtained after cal- ronmental Chemical Engineering, vol. 8, no. 4, Article ID
cination at 900°C and 1000°C. The results are shown in 103896, 2020.
Figure 10. The band at 570 cm−1 is assigned as the sig- [2] P. A. Owusu and S. Asumadu-Sarkodie, “A review of re-
nature peak of the CaTiO3 bond. The absorption peak at newable energy sources, sustainability issues and climate
460 cm−1 is due to the bending mode of the Ti-O-Ti bond. change mitigation,” Cogent Engineering, vol. 3, no. 1, Article
 ID 1167990, 2016.
The absorption peak at 567 cm−1 is characterized as Ti-O
 [3] K. Qi, B. Cheng, J. Yu, and W. Ho, “A review on TiO2 -based
stretching vibration. This implies the existence of TiO6 Z-scheme photocatalysts,” Chinese Journal of Catalysis,
octahedra and the formation of a CaTiO3 perovskite-type vol. 38, no. 12, pp. 1936–1955, 2017.
structure [22]. For the CaTiO3 powder obtained at 1000°C, [4] L. Finegold and J. L. Cude, “Biological sciences: one and two-
the broad bands observed above 3644 cm−1 and 3429 cm−1 dimensional structure of alpha-helix and beta-sheet forms of
are related to the superposition of the vibration band of poly(L-alanine) shown by specific heat measurements at low
Journal of Nanotechnology 9

 temperatures (1.5-20 K),” Nature, vol. 238, no. 5358, [19] G. Zhang, G. Liu, L. Wang, and J. T. S. Irvine, “Inorganic
 pp. 38–40, 1972. perovskite photocatalysts for solar energy utilization,”
 [5] H. Wang, L. Zhang, Z. Chen et al., “Semiconductor hetero- Chemical Society Reviews, vol. 45, no. 21, pp. 5951–5984, 2016.
 junction photocatalysts: design, construction, and photo- [20] J. Tauc, “Optical properties of amorphous semiconductors,”
 catalytic performances,” Chemical Society Reviews, vol. 43, in Amorphous and Liquid Semiconductors, J. Tauc, Ed.,
 no. 15, pp. 5234–5244, 2014. Springer US., Boston, MA, USA, pp. 159–220, 1974.
 [6] J. Wen, X. Li, W. Liu, Y. Fang, J. Xie, and Y. Xu, “Photo- [21] L. H. Oliveira, J. Savioli, A. P. de Moura et al., “Investigation of
 catalysis fundamentals and surface modification of TiO2 structural and optical properties of CaTiO3 powders doped
 nanomaterials,” Chinese Journal of Catalysis, vol. 36, no. 12, with Mg2+ and Eu3+ ions,” Journal of Alloys and Compounds,
 pp. 2049–2070, 2015. vol. 647, pp. 265–275, 2015.
 [7] A. Kumar, C. Schuerings, S. Kumar, A. Kumar, and [22] S. A. U. Portia, R. Srinivasan, E. Elaiyappillai, P. M. Johnson,
 V. Krishnan, “Perovskite-structured CaTiO3 coupled with and K. Ramamoorthy, “Facile synthesis of Eu-doped CaTiO3
 g-C3N4 as a heterojunction photocatalyst for organic pol- and their enhanced supercapacitive performance,” Ionics,
 lutant degradation,” Beilstein Journal of Nanotechnology, vol. 26, no. 7, pp. 3543–3554, 2020.
 vol. 9, pp. 671–685, 2018.
 [8] L. H. Oliveira, A. P. De Moura, F. A. La Porta et al., “Influence
 of Cu-doping on the structural and optical properties of
 CaTiO3 powders,” Materials Research Bulletin, vol. 81, pp. 1–9,
 2016.
 [9] M. Rizwan, Z. Usman, M. Shakil et al., “Electronic and optical
 behaviour of lanthanum doped CaTiO3 perovskite,” Materials
 Research Express, vol. 7, no. 1, p. 015920, Article ID 015920,
 2020.
[10] M. M. Maroneze, L. Q. Zepka, J. G. Vieira, M. I. Queiroz, and
 E. Jacob-Lopes, “A tecnologia de remoção de fósforo: ger-
 enciamento do elemento em resı́duos industriais,” Ambiente
 & Água-An Interdisciplinary Journal of Applied Science, vol. 9,
 pp. 445–458, 2014.
[11] C. Karthikeyan, M. Thamima, and S. Karuppuchamy,
 “Structural and photocatalytic property of CaTiO3 nano-
 sphere,” Materials Science Forum, vol. 979, pp. 169–174, 2020.
[12] A. K. Dubey, B. Basu, K. Balani, R. Guo, and A. S. Bhalla,
 “Multifunctionality of perovskites BaTiO3 and CaTiO3 in a
 composite with hydroxyapatite as orthopedic implant ma-
 terials,” Integrated Ferroelectrics, vol. 131, no. 1, pp. 119–126,
 2011.
[13] K. Kovári, C. Amstad, and G. Anagnostou, “Design/con-
 struction methods–tunneling in swelling rocks, key questions
 in rock mechanics,” in Proceedings of the 29th U.S. Key
 Questions in Rock Mechanics Symposium, P. A. Cundall,
 R. L. Sterling, and A. M. Starfield, Eds., Balkema, Minneapolis,
 MN, USA, 13–15 June 1988.
[14] G. S. Kaliaraj, K. Kirubaharan, G. Pradhaban, P. Kuppusami,
 and V. Vishwakarma, “Isolation and characterization of
 biogenic calcium carbonate/phosphate from oral bacteria and
 their adhesion studies on YSZ-coated titanium substrate for
 dental implant application,” Bulletin of Materials Science,
 vol. 39, no. 2, pp. 385–389, 2016.
[15] A. M. Abbas, M. Al-Kahtani, S. J. Novak, and W. S. Soliman,
 “Abundance, distribution, and growth characteristics of
 three keystone Vachellia trees in Gebel Elba National
 Park, south-eastern Egypt,” Scientific Reports, vol. 11, no. 1,
 p. 1284, 2021.
[16] M. Mostafa, Z. A. Alrowaili, G. M. Rashwan, and
 M. K. Gerges, “Ferroelectric behavior and spectroscopic
 properties of La-modified lead titanate nanoparticles prepared
 by a sol-gel method,” Heliyon, vol. 6, no. 2, Article ID e03389,
 2020.
[17] P. Kanhere and Z. Chen, “A review on visible light active
 perovskite-based photocatalysts,” Molecules, vol. 19, no. 12,
 pp. 19995–20022, 2014.
[18] J. Shi and L. Guo, “ABO3-based photocatalysts for water
 splitting,” Progress in Natural Science: Materials International,
 vol. 22, no. 6, pp. 592–615, 2012.
You can also read