STATISTA CONTENT MARKETING COMPASS 2021 - Statista Content & Design
←
→
Page content transcription
If your browser does not render page correctly, please read the page content below

STATISTA CONTENT MARKETING COMPASS 2021

// F OR E WOR D
WELCOME TO THE CONTENT
MARKETING COMPASS
CON T EN T M A R K E T ING: and interpretation for every decision, are steadily gaining a studies of this exciting market that generates specific
S OON TO BE A T EN - B ILLION EURO M A R K E T competitive edge: for better understanding market mecha- added value for those in the market. For this reason and as
nisms, further professionalizing this marketing discipline, part of our series, we have created a separate compass for
Ten billion Euros. That is the level that content marketing and for making improved and quantified decisions regar- the topic of content marketing.
investments by companies in the German-speaking region ding your future content marketing decisions.
alone will soon surpass. This prediction can be derived We hope you will discover many illuminating insights that
from the results of a baseline study that has been regularly contribute to your content marketing success!
conducted by the Content Marketing Forum e.V., or CMF for A PR ELIMIN A RY NOT E ON T HE ME T HODOLOG Y
short. (cf. CMF 2020). Best regards,
The Content Marketing Compass is not a primary source
Ten billion Euros – that is the content marketing budget but is instead to be understood as a compendium of sorts Dr. Sandra Gärtner // Forschung & Beratung
that covers the production and distribution of content and that compiles the results of the most important studies mediaresearch42
increases by an average of 8% every year. And it is an eco- about content marketing. In addition to the aforementio-
nomically relevant reason to offer a showcase for the most ned baseline study by the CMF, other studies included are
key results and insights available from studies about this the study by the U.S.-American counterpart to the CMF, Sebastian Schurz // Senior Director,
marketing field in this comprehensive report. “Annual Content Marketing 2020 – Benchmarks, Budgets, Statista Content & Information Design
and Trends – North America,” which has been updated and
The objective of the Content Marketing Compass is to pro- released every year since 2010. Of course, our own Statista
vide you with conclusive and data-based facts and all in- study in partnership with CMF’s “Content Marketing Trend
sights about the most important content marketing studies Study” as well as its international version “Content Marke-
in the German-speaking region as well as to summarize ting Trend Study 2020” play important roles as well. Howe-
as the most crucial trends from North America. Data-sup- ver, we are convinced that it is the combined examination
ported strategies, which rely on thorough data analysis and comparison of the various facets of many different
TABLE OF CONTENTS

                                         CON T EN T M A R K E T S T R AT EG Y –
                                                                                   01
                                                          A NO - BR A INER?
                                                                                             ME A SUR ING SUCCE S S –
                                                                                        03
                                                                                             ACHIE V ED GOA L S ? !
                                  Strategizing as a Critical Success Factor    5

                                                                                             30   The Must-Haves of Success Measurement
        Successful Companies Demonstrate their Successes Systematically        8

                                                                                             32   From AIDA to ROI Measurement
                                              Goals in Content Marketing       9

                                              Content Marketing Budgets       13
                                                                                             ORG A NIZ AT ION , PROCE S SE S , A ND T E A M S T RUC T UR E S –
                                                                                        04
                                                                                             I T ’ S A LL A BOU T PEOPLE
               Employer Branding as the Third Pillar of Content Marketing     16

                                                                                             37   Size and Organization of CM Teams

                            CON T EN T CR E AT ION A ND DI S T R IBU T ION –
                                                                                   02        39   The Job Market in Content Marketing
                                                        A PER FEC T PA IR

                           Disseminating Content: Paid, Social and Digital    18
                                                                                             CH A LLENGE S A ND T R ENDS –
                                                                                        05
                                                                                             A SM A LL LOOK IN TO T HE FU T UR E
                             The Most Important Social Media Platforms        22

                                                                                             41   Content Analysis #ContentMarketing
                                      The Anatomy of Successful Content       25

                                                                                             43   Three Concluding Hypotheses
01

CONTENT
MARKET
STRATEGY
A strategy is the basis for goal-oriented and promising corporate action. In other words:
A strategy is the basis for success. As self-explanatory as this knowledge may appear, the
gap between theory and practice is all the more astonishing. This chapter shows you why.

// 01 CO N T EN T M A R K E T S T R AT EG Y
STRATEGIZING AS A CRITICAL SUCCESS FACTOR 5
DEFINI T ION CON T EN T M A R K E T ING documented in writing. A strategy is the basis for goal- way that requires significantly less time, energy, and con-
oriented and promising corporate action and should for flict. The reason lies in the focus on clearly defined target
Before we dive into the availability of data, it makes sen- this reason not be absent from any discipline. Practically groups and effects that one would like to achieve with
se to define the term which is at the center of this Statista speaking, the opposite is frequently apparent: in particu- them through content. Whether a new social media chan-
Compass. We draw upon the definition by CMF, which is as lar, when a new marketing trend appears on the horizon nel is suitable for the content marketing strategy of defi-
follows: and throws the market as well as its protagonists into an ned goals and target groups can be much more easily and
”
uproar, blind actionism often appears to be the remedy successfully determined than not having a strategy accor-
Content marketing is the communication discipli- of choice as opposed to a deliberate consideration against ding to which one must act. In other words:
ne that uses editorial content to advance strategic the backdrop of one’s own strategic goals.
corporate goals. All content generates a measura- A S T R AT EG Y M A K E S F OR MOR E SUCCE S SFUL
ble effect on the channels used.
“ (cf. CMF 2016) Time for an example? Think about the emergence of a new
social media channel: the first question from management
OPER AT ION S .
Thus it is all about producing content with a certain level is “What is that?”; the second is “Could that be the next By all means, the successes are clear: As the Content Mar-
of quality and to distribute it across channels in order to Instagram?” – which is invariably said with an undercurrent keting Trend Study confirms, 73% of decision-makers from
generate an effect that is conducive to the company’s ob- of accusation that “we are still hanging onto Facebook and B2B companies and 82% of those from B2C companies
jectives and targeted to a specific audience. might have missed the boat.” An energy-draining round characterize their content marketing strategy as successful
ensues: of research, decision papers, and discussions (cf. Statista et al. 2020a, p.4)
about not (yet) needing to be active in the new channel –
A S T R AT EG Y I S T HE NUMBER ONE not to mention the follow-up in the next quarter. This decision, however, assumes that decision-makers also
SUCCE S S FAC TOR pursue a strategy. But this is far from being the case.
With a content marketing strategy, such decisions for
A question that is formulated in nearly every marketing or against engaging with this new social media channel
decision-maker survey involves a strategy – preferably with one’s proprietary corporate account are made in a
www.statista.design/en // content-design@statista.com
// 01 CO N T EN T M A R K E T S T R AT EG Y
6
S TR ATEGIZING A S A CRITIC AL For in spite of the realization that a strategy is the
SUCCESS FAC TOR central factor for success, and in spite of the in-
creasing professionalism of content marketing, the
It is a bit surprising that the question of a strategy – percentage of those who can refer back to a content
one that is documented in writing – in the annual marketing strategy that is documented in writing
study by the Content Marketing Institute in 2015 (na- is increasing rather slowly or not as strongly as the
HOW SUCCESSFUL IS YOUR CONTENT MARKETING STR ATEGY? mely, over five years ago) was only affirmed by 27% growth rates of the budgets suggest. Regarding the
(B2C) and 35% (B2B) of the content marketing deci- percentage of those who have a strategy, the study
not so / less than successful very / generally successful
sion makers who were surveyed. Against the back- results vary widely, evidently due to different defi-
ground that a written strategy is crucial for success, nitions of strategy. Thus, in North America in 2020,
the CMI already concluded in its study that: an average of 41% of the B2B decision makers and
precisely a third of the B2C decision makers have
18%
27%
”If we had to pick one key theme that has
emerged from this year’s B2B research, it
a content strategy documented in writing, which is
hardly more than it was five years ago.
would be this: If you want to be more effective
at content marketing, document your One result that repeatedly appears and is manifes-
strategy.
“ (cf. CMI 2015, p.34) ted in the CMI benchmark study is the significantly
larger share of an existing strategy in the group of
The CMF also attested that strategizing plays a those who self-assess their content marketing stra-
decisive but also challenging role in successful tegy as (very) successful – the so-named top per-
B2C B2B
73% content marketing (CMF 2020, p.2) formers. Of the successful content marketers, two
thirds have a strategy that is documented in writing,
82% The CMF’s baseline study attested that seven out of whereas the percentage among the unsuccessful is
ten companies have a defined, clear, and long-term at a mere 16%. (cf. fig. p.7)
content marketing strategy to which management
and employees feel committed, and yet at this level The percentage of B2B marketers with a written con-
there is much catching up to do. tent marketing strategy has increased only slightly
Source: Statista et al. 2020a, p.4; base: people who work in companies that conduct digital content marketing themselves and pursue a strategy for
over the last few years. But year after year, it has
customer retention; n=195 in total; n=76 B2C companies; n=119 B2B companies
www.statista.design/en // content-design@statista.com
// 01 CO N T EN T M A R K E T S T R AT EG Y
7
become consistently clear that a strategy is a key factor for content marketing avoiders fear is confirmed by the active
the success of content marketing. (cf. fig.) parties: “The greatest problem with content marketing for
companies of all sizes is the relation between effort and
In order to also examine this connection, perhaps even the return.” (Bächler et al. 2020, p.3)
causality, between strategy and success in content marke-
ting for the German market, the question was posed in a The Swiss authors then conclude:
”
PERCENTAGE OF B2B MARKETERS WITH A similar form for the first time in the Content Marketing Ent-
WRITTEN, DOCUMENTED CONTENT MARKETING scheider Analyse – COMAE for short. The result was clearly The most urgent task for all Swiss companies in
STR ATEGY confirmed for German content marketing decision-makers content marketing is either to increase efficiency
as well: The majority of successful decision-makers (61%) or efficacy. A content strategy as well as a clear
80 Most Succesful All Respondents Least Successful
had a significantly higher proportion of content marketing definition of KPIs are decisive prerequisites for this
“
69% strategies documented in writing than the less successful optimization.
70 65%
(Bächler et al. 2020, p.3)
62% decision-makers (23%). Thus, the studies clearly confirm:
60 For the results also demonstrate that those who have
T HOSE W HO H AV E A S T R AT EG Y A R E MUCH MOR E recourse to a written strategy are confronted with notably
50 LIK ELY TO BE IN T HE C AT EGORY OF SUCCE S SFUL fewer problems in day-to-day work and, in addition, are
41% COMPA NIE S IN CON T EN T M A R K E T ING . less dependent on external service providers.
39%
40 37%
To recognize that many companies do not (against their bet-
30 ter judgement) follow a content marketing strategy, we need
not look across the Atlantic but only as far as Switzerland.
20 16% 16%
14% One of the conclusions of a study about the inventory of
content marketing by the Zürich School of Applied Sciences
10
(ZHAW) was that content marketing is present, yet four out
0 of five companies do not use it. This high avoidance rate of
2020 2019 2018 81% along with 75% having no plans to implement content
marketing indicates that major concerns are at play. The
Source: CMI 2020a, p.12; base: B2B content marketers (* from the 2018
and 2019 reports); n=679 in total in 2020; of which most successful (a.k.a. top most important rationale for this rejection is that success
performers)=ca. 26% und least successful=ca. 16% is uncertain and not quantifiable. What the vast majority of
www.statista.design/en // content-design@statista.com
// 01 CO N T EN T M A R K E T S T R AT EG Y
SUCCESSFUL COMPANIES DEMONSTRATE THEIR SUCCESSES 8
SYSTEMATICALLY
T HE SUCCE S S FAC TOR OF SUCCE S S ME A SUR EMEN T DO YOU HAVE A CONCEPT FOR MEASURING YOUR CONTENT TOP PER F OR MER S
MARKETING ACTIVITIES?
In addition to strategy, the second factor for success that became As previously mentioned, the CMI study refers to those
Yes* Somewhat No
apparent in equal parts in the CMI benchmark study as well as the who rate their content marketing activities as (very) suc-
COMAE survey is the fact that documented goals are also measured – cessful. They take the two success factors of strategy and
and thereby demonstrated. As the figure shows, the topic of success 7% success measurement into account much more frequently
measurement occupies a central role among successful content mar- than average: with this, top performers in content marke-
keters with three statements: 80% use metrics to measure perfor- ting are those who routinely assess their degree to which
mance (95% among the successful) and 65% have developed key per- they have achieved their goals based on a strategy docu-
formance indicators – KPIs for short – to measure content initiatives 31% mented in writing. In other words, with a slowly but steadi-
10%
(83% among those who are successful). The ultimate discipline, howe- 17% ly increasing percentage of those who have a content mar-
ver, appears to be the return on investment, or ROI. On average, 62% keting strategy and attentively measure their documented
43% do not report measuring ROI, whereas more than two-thirds of strategies, the percentage of successful content marketers
successful companies do. is likely to increase with time.
Here too, COMAE reports similar values for content marketing in Yet the profiles of top performers also possess other cha-
Successful
Germany, and similar to the topic of strategy, successful companies racteristics: According to COMAE, the third success factor
(61%) also have a clear plan to systematically measure the achievement of successful content marketers is an efficient distribution
of their content marketing goals – six times more than unsuccessful 73% strategy for displaying content. That is why in addition to
companies. the factor of success measurement, an entire chapter of
Unsuccessful this report is devoted to the success factor of distribution
strategy.
Source: mediaresearch42 2017, p.18; base: n=85 total; n=55 successful (grade for CM success down to
good) n=30 unsuccessful (satisfactory or worse); *significant group differences (p ≤ .05)
www.statista.design/en // content-design@statista.com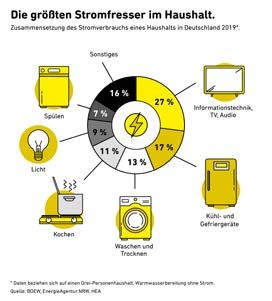
// 01 CO N T EN T M A R K E T S T R AT EG Y
GOALS IN CONTENT MARKETING 9
S T R AT EGIC GOA L S IN CON T EN T M A R K E T ING approach and gain new customers, and retain exis- DEGREE TO WHICH STRATEGIC OBJECTIVES ARE MET
T END TO A PPE A R AT T HE BEGINNING OF ting customers at the same time. The results of the THROUGH CONTENT MARKETING
T HE FUNNEL content marketing trend study can also serve as an
Brand knowledge Brand preference Hunting & farming
example here. (cf. Statista et. al 2020)
The basis of every strategy is the definition of stra-
tegic goals that every company would like to achieve If marketers have to decide upon a strategic goal,
by using content marketing. content marketing in B2B as well as B2C primarily Gain new customers Improve image
serves to strengthen the brand image and only
According to the CMF baseline study, content mar- secondarily to acquire new customers. 98%
91%
keting has a high momentum of over 90% approval
Generate Improve
along the entire customer journey – however, the Yet even when additional strategic goals are pursu- impulse awareness
greatest degree of goal attainment is accomplished ed, there is no reason for concern, for research in purchases 92% 97%
at the beginning of the funnel. Above all, 97% favor advertising effectiveness does not at all see a con-
the increase in awareness through content marke- flict: Those who wish to gain new customers cannot
ting. (cf. fig.) do so without first working on branding, namely, to 93% 96%
make themselves known and to generate an image Brand product
Retain customers 95% information
Based on their high level of relevance. strategic in the minds of the people. And what could be bet-
goals are surveyed in nearly every decision-maker ter suited for this than good content marketing?
study. At the same time, the results consistently ref-
lect a certain disconnect among marketers, for only
Boost
a small fraction of them can concentrate on one
preference
major strategic goal. Instead, they would prefer to
do everything at once: bolster their own brand, Source: CMF 2020, p.61; base n=319 CM decision-makers; Top 3 Boxes: excellent, very good, good
www.statista.design/en // content-design@statista.com// 01 CO N T EN T M A R K E T S T R AT EG Y
10
GOALS THAT HAVE BEEN SUCCESSFULLY ACHIEVED WITH CONTENT MARKETING IN B2B VS. B2C
B2C B2B
Increase brand awareness
84%
86%
GOA L S T H AT SUCCEED W I T H CON T EN T M A R K E T ING
Inform target groups
75%
79% That content marketing is above all implemented at the beginning of
Create trust and credibility the customer cycle is emphasized by the CMI results. These show that
65% to start with, content marketing has a positive influence on brand awa-
75% reness – this is confirmed by 84% and 86% of those surveyed. More
Generate demand/leads
over, with regard to the objectives of informing the audience, genera-
61%
70% ting credibility and trust, and acquiring newsletter subscribers, those
Acquire interested parties/e-mail subscribers surveyed agree that content marketing performs an important service.
49% In that sense, B2C decision makers are somewhat more reserved with
68% regard to estimating the effectiveness of content marketing – with the
Strengthen brand loyalty and customer contact exception of the aim to call attention to a new product. Here, B2C
55%
63% decision makers lead with 51% agreement, compared to B2B decision-
Generate event participants makers (45%). (cf. fig.)
36%
52%
Create a community
38%
45%
Support product launches
51%
45%
Source: CMI 2020a, p. 33 & C MI 2020b, p. 30; base; n=679 B2B content marketers in North America; n=179 B2C content marketers in North America;
multi-pick
www.statista.design/en // content-design@statista.com// 01 CO N T EN T M A R K E T S T R AT EG Y
11
DIFFER EN T S T R AT EGIE S IN B2B V S . B2C STR ATEGIC CHAR ACTERISTICS IN B2B VS. B2C
B2C and B2B communications each account for one-third
of annual content marketing investments. (CMF 2020, p.2)
STORYTELLING
TOPICALITY
TOPICALITY
CONSEQUENT LEAD-
To understand the different results of B2B and B2C content
NUTURING MODEL
PERSONALIZED
marketing decision-makers, it helps to consider the parti- SIMPLE EXPLANATIONS
B2C B2B
AUTHENTIC
culars of their respective strategies: Whereas B2C is very REPORTS FOR COMPLEX SUBJECTS
CONTENT
much focused on setting oneself apart from advertising
with authentic reports and storytelling, content marketing
in B2B is primarily used to disseminate information and
deliver true, customized insights.
GENUINE INSIGHTS
The action goals that are derived from the strategic goal EMOTIONAL PROPRIETARY, REGIONAL
CROSS-CHANNEL NETWORKING
vary according to the strategic goal, but B2B and B2C deci-
STORIES CONTENT PRODUCTION
sion-makers also tick differently here: B2B decision-makers
in particular focus on communicating industry news and
trends with a view to strengthening their brands, whereas INDIVIDUALIZATION
B2C decision-makers focus on targeted SEO measures with AUTHENTICITY, NOT ADVERTISING
KNOWLEDGE TRANSFER
the strategic goal of acquiring new customers. (cf. fig. p.12)
Source: Statista et al. 2020a, p.20; base: n=198 CM decision-makers; people who work in companies that do their own digital content marketing and have a successful strategy for their content marketing;
open mentions; selection of answers; answers edited
www.statista.design/en // content-design@statista.com// 01 CO N T EN T M A R K E T S T R AT EG Y
12
THE THREE MOST IMPORTANT CONTENT MARKETING GOALS AND IMPLEMENTED MEASURES IN B2B AND B2C
B2C B2B
86% 82% 71%
89% 78% 68%
Goals:
Strengthening Acquiring Strengthening
the brand new customers connections to
customers
Measures: News and industry trends Targeted SEO measures Explanatory content
52% 74% 67%
74% 66% 55%
Source: Statista et al. 2020a, p.4 & p.6; base: CM decision-makers n=76 B2C- and n=122 B2B companies and n= min. 83 B2B and n=54 B2C who pursue the respective strategic goal
www.statista.design/en // content-design@statista.com// 01 CO N T EN T M A R K E T S T R AT EG Y
CONTENT MARKETING BUDGETS 13
BUDGE T DE V ELOPMEN T content, 40% is invested in distribution, especially in paid CONTENT MARKETING INVESTMENTS:
media, and 10% should be calculated for measuring suc- ACTIVITIES INCONTENT MARKETING CYCLE
In our introduction, we mentioned the ten-billion-euro cess. A look at the CMF's baseline study also confirms this
mark reached by content marketing investments in DACH. order of magnitude, where the areas of production and
Here, we will take a closer look at the composition of the- distribution are subdivided once again (see fig. right).
se investments in the DACH region, the situation in North Success measurement & analytics
−1 PP 12%
America, and what this means for each individual company.
Content production
The biennial baseline study of the Content Marketing Fo- 27% ±0 PP
rum has been reporting about the development in the Content promotion
DACH region since 2010. According to this survey, CM +4 PP 20%
investments have increased by 111% since then – which DEVELOPMENT OF CONTENT MARKETING
corresponds to an average annual rate of 8%. And now it INVESTMENTS IN DACH IN € BILLION
stands at €9.4 billion in DACH. (cf. fig. left).
10 9.4
8.0
Of this, Germany accounts for around €7.8 billion, Switzer- Content distribution
6.9
land for €920 million, and Austria for €590 million. 5.8 Strategy development & −1 PP 19%
4.4 4.7
content planning
The COMAE study also shows not only how the budget is 22% −3 PP
distributed online and offline, but also how much is inves-
1
ted in production, distribution, and performance measu-
2010 2012 2014 2016 2018 2020
rement within content marketing. According to this, appro-
ximately 50% of the budget flows into the production of Source: CMF 2020, p.7; base: n=319 CM decision-makers in DACH, weighted Source: CMF 2020, p.8 base: n=319 CM decision-makers in DACH, weighted
www.statista.design/en // content-design@statista.com// 01 CO N T EN T M A R K E T S T R AT EG Y
14
T HE AV ER AGE COMPA N Y BUDGE T F OR By comparison, the SEMrush study of 1,200 content
CON T EN T M A R K E T ING marketers in 39 countries indicates a similar distri-
bution of budgets, although these are significantly
When it comes to budgets, an essential question for lower than in North America. Close to half invest
every company is how to determine the annual ab- less than €10,000 per year in content marketing,
solute amount. As a point of reference, the CMF's whereas a mere 10% invest more than US$100,000
AVER AGE CONTENT MARKETING AVER AGE CONTENT MARKETING INVEST- baseline study shows an average value across all annually.
INVESTMENTS IN DACH MENTS IN NORTH AMERICA IN B2B companies that engage in content marketing.
It becomes apparent that the amount of the absolu-
Less than $100,000 $1,000,000 or more ”Companies that use content marketing invest
an average of €640,000 per year in their
te budget hinges upon various framework factors –
company size above all else. It is therefore worth
“
$100,000–$500,000 No specification/
no fixed budget
activities. (CMF 2020) breaking down the average budget by company size,
$500,000–$750,000
where the clear causality between company size and
$750,000–$1,000,000
The CMF baseline study also provides a differentia- budget can be seen. (cf. fig. p.15)
ted breakdown of the markets, recipient groups, and
Germany
€7.83 billion media channels into which investments are distribu-
Ø CM budget €640,000 ted. As the figure shows, German companies alone
19% account for €7.83 billion of the €9.4 billion in total
CM investments in Germany, Austria, and Switzer-
47%
land. (cf. fig. left)
The overview of all B2B companies surveyed in the
3% 2% 2% CMI study shows how the budgets are staggered, at
least for the companies in North America. Although
Switzerland Austria just under half of the respondents invest less than
€920 million €590 million
Ø €760,000 Ø €610,000 27% US$100,000 per year, more than one in four compa-
nies has an annual CM budget above this figure.
Source: CMF 2020, p.7; base: n=319 CM decision-makers in DACH,
And 7% invest more than US$500,000 in their
weighted Source: CMI 202a. p.35 base: n=679 B2B content marketers content marketing:
www.statista.design/en // content-design@statista.com// 01 CO N T EN T M A R K E T S T R AT EG Y
15
AVER AGE CONTENT MARKETING INVESTMENTS, AVER AGE ANNUAL BUDGETS GROUPED
WORLDWIDE ACCORDING TO COMPANY SIZE
$10,000 or less $500,001 to $1 million
$10,001 to $25,000 $1.01 million to $5 million
BUDGE T PROGNOSI S: OP T IMI S T IC decision makers were still expecting a somewhat
$25,001 to $50,000 More than $5 million
(INCLUDING COV ID -19 SCEN A R IOS ) significant increase in content marketing budgets for
$50,001 to $100,000 I don't know
2020 back in the summer of 2019, 53% of respon-
$100,000 to $500,000
Large $405,000 There seems to be no end in sight to investment dents reported a year later that their spending on
companies growth in content marketing, and the mood just pre- content marketing had not changed, at least in the
(1,000+ employees)
ceding the coronavirus crisis clearly shows this: first half of 2020. Another 29% reported a decrease
in spending, whereas 18% had actually increased
< 1% 15%
COMPA NIE S E X PEC T A N A DDI T ION A L 10 % their spending. This relatively low-level budget im-
1%
1% INCR E A SE IN IN V E S T MEN T PER Y E A R OV ER pact of the first COVID-19 wave was largely indepen-
T HE NE X T T HR EE Y E A R S: dent of company size. (see fig., next page)
6%
46%
This was the optimistic outlook in February 2020 The forecast for the second half of the year was re-
5% Mid-sized $213,000 before the pandemic struck. For the period following assuring: almost one-third of respondents estimate
companies
(100–999 employees)
the coronavirus crisis, there are three scenarios: In that their company would spend even more on con-
8%
the uppermost one, investments of €9 billion achie- tent marketing by the end of the year in comparison
vethe forecast level almost equal to the one without to the first half. However, the majority anticipate
17% the coronavirus crisis; in the middle one, they are that spending would remain unchanged for the re-
€8.4 billion; in the lowest one, investments could be mainder of 2020, with only twelve percent expecting
Small $81,500 reduced by more than 40% (CMF 2020, p.2) a decrease in CM spending. (see CMI 2020c, p.41)
companies
(1–99 employees)
A look across the Atlantic reveals the first actual
Source: SEMrush 2020, p.43; question: How much did your company invest in budget effects from the pandemic in the freshly
content marketing in 2019? („Wieviel hat Ihr Unternehmen in 2019 in Content- Source: CMI 2020a, p.35; Basis: n=679 B2B-content marketers;
Marketing investiert?“); base: n=1,200 content marketers in 39 countries annual budgets in USD grouped according to company size published 11th CMI study: While nearly half of B2B
www.statista.design/en // content-design@statista.com// 01 CO N T EN T M A R K E T S T R AT EG Y
16
R AMIFICATIONS OF COVID-19 ON THE TOP TEN B2B AREAS IN WHICH CONTENT MARKETERS WILL INVEST
ACTUAL AND ESTIMATED CM BUDGETS IN 2021
70% Content creation
At the time of the most recent CMI B2B survey in July 2020, the mood 18% 66% Website improvements
appeared optimistic, with half of respondents estimating that the pan- Increase
30%
demic would have only a moderate long-term impact on their organiza-
tion and content marketing success. Only 15% assumed a high (estima- 48% Digital/personal/hybrid events
ted negative) impact. (cf. CMI 2020c, p.44)
29%
12% 46% Organic content distribution
Decrease
It will be interesting to see how the second wave of the pandemic will
influence the results in 2021 and how German marketers think. There-
fore, we will include this question in the next content marketing trend 39% Social media community expansion
study in early 2021.
38% Paid media content distribution
The higher the budgetary impact of the pandemic, the more import-
ant it will be to focus on content marketing measures that are both
57% Improved understanding of users
effective and promising. By a wide margin, the top predicted areas for 53% No change 31%
(personas, social media listening)
content marketing investment in 2021 are a return to the core: content
creation with 70% approval, and website adjustments with two-thirds 29% Customer experience
approval. In each case, half of the respondents are readying themsel-
ves for events with flexibility in digital and/or hybrid formats and a
focus on the organic distribution of content. This suggests that media 29% Earned media (PR/media/influencer relations)
spending in particular will be affected by budget cuts. (cf. fig.) Spending Estimated spending
H1 2020 H2 2020
24% CM technologies
Source: CMI 2020c, p.40/41; base: n=740 B2B content marketers;
survey July 2020 Source: CMI 2020c; p.45; base: n=740 B2B content marketers
www.statista.design/en // content-design@statista.com// 01 CO N T EN T M A R K E T S T R AT EG Y
EMPLOYER BRANDING AS THE THIRD PILLAR 17
OF CONTENT MARKETING
HOW CON T EN T M A R K E T ING PER F OR M S IN more on content marketing in personnel marketing, DISTRIBUTION OF CM INVESTMENTS ACROSS DIFFERENT RECIPIENT GROUPS
T HE WA R F OR TA LEN T both to convince new employees and to accompany
change management processes for employees.
Whereas B2C and B2B communications each ac- (CMF 2020, pp.30 & 31)
Total
count for roughly one-third of annual content mar-
€9,350 million
keting investments, investments in employee com- OV ER T WO -T HIR DS OF COMPA NIE S A R E
munications – known as B2E communications – have CON V INCED: CON T EN T- M A R K E T ING HELP S
Consumers (B2C) Business customers (B2B) Employees (B2E)
grown the most, with a 12% increase compared to TO W IN T HE WA R F OR TA LEN T S , E SPECI A LLY €3,130 million €3,110 million €1.580 million
2018, according to the CMF. The approximately W I T H CON T EN T- S AV V Y GENER AT ION Y. CAGR +9% CAGR +8% CAGR +12%
€1,580 million invested in this area accounts for
nearly a fifth of total CM investments. (see fig.)
The development of the results from the CMF baseli-
ne study emphasize that content marketing is beco-
ming the central instrument for achieving employer Investors
branding and recruiting goals. This is not surprising, €970 million
CAGR +6%
given that credible as well as helpful content are in
demand in the context of jobs and careers.
Content marketing makes it possible for a company Other
€560 million
to tell a consistent story about itself and its job of- CAGR ±0%
fers to potential employees – more than two-thirds
of companies are therefore relying increasingly Source: CMF 2020, p. 11; base: n=319 CM decision-makers in DACH, weighted
www.statista.design/en // content-design@statista.com02 CONTENT CREATION AND DISTRIBUTION Whereas ten years ago, the challenges for content marketing decision-makers all revolved around the processes and quality of content marketing, the most recent content shock phenomenon has led to the realization that the targeted dissemination of content is at least as important. For this reason, both also belong in one chapter.
// 02 CO N T EN T C R E AT I O N A N D D I S T R I B U T I O N

DISSEMINATING CONTENT: PAID, SOCIAL UND DIGITAL                                                                                                                                                                                                     19

W H Y CON T EN T CR E AT ION A ND I T S DI S SEMIN AT ION                      THE CONTENT SATUR ATION INDEX                                                                              Thousands upon thousands of content and com-
GO TOGE T HER                                                                                                                                                                             municative messages inundate the public on a daily
                                                                               The content saturation index describes the amount of search results                                        basis. This phenomenon has been outlined by Mark
In a growing market, the challenge is that more and more content pro-          about a topic.                                                                                             Schaefer and is known as content shock. In such
ducers are competing for the same user groups as the size of potential                                                                                                                    times, companies require an established strategy
recipients remains the same. This means that the barriers to entry are                                                                  Hypersaturation                                   in order to stage their content, which also includes
growing for those who currently intend to start with content marketing,                                                                                                                   an advertising context, by increasing the reach they
                                                                                                                                                          Over 1 million results:
yet it is also becoming increasingly difficult for established players to                                                                                 Hypersaturation
                                                                                                                                                                                          have established beyond their owned media target

                                                                            Reader acquisition effort
efficiently reach the desired personas with their content.                                                                                                                                groups.
                                                                                                                                                          100,000 to 1 million results:
                                                                                                                                                          Oversaturation
This connection is exemplified by what is known as the content satura-                                                                                                                    Only reach is able to ensure that content achieves
tion index.                                                                                                                                               10,000 to 100,000 results:      their goals and can allow their effect to take hold. To
                                                                                                                                                          normal saturation               expand this reach, the following are necessary:

                                                                                                       Low                                                0 to 10,000 results:
                                                                                                       saturation                                         low saturation                  •	detailed knowledge about users and their
                                                                                                                                                                                             information needs
                                                                                                                    Search results per topic
                                                                                                                                                                                          •	an established overview about paid media
                                                                                                                                                                                             options of individual channels
                                                                               W I T H INCR E A SING S AT UR AT ION , T HE EFF OR T TO                                                    • Knowledge about which combination of promo-
                                                                               PL ACE CON T EN T A ND GENER AT E LE A DS INCR E A SE S                                                       tions is suitable for a concreate communication
                                                                               OV ER PROP OR T ION A LLY.                                                                                    goal, and last but not least
                                                                                                                                                                                          •	a process and a plan about which contents should
                                                                            Source: CMF 2016 p.5; base: illustration inspired by Marc Schaefer 2015                                          be advertised over which platform.

www.statista.design/en // content-design@statista.com
// 02 CO N T EN T C R E AT I O N A N D D I S T R I B U T I O N
20
Otherwise, there is a high risk of simply wasting the high ONLINE V S . OFFLINE: T HE CH A NGING R EL AT ION - Thanks primarily to its tactile experience, which enhances
distribution share through botched experiments and mis- SHIP OF DIGI TA L TO PR IN T its media impact, print continues to play a very important
sing target formulations. role. This is particularly true for B2B and investor commu-
If one endeavors to reach the public in a targeted manner nications - where print shares are higher than in the B2E
Content media planning also fundamentally means: with content, the proper channels and/or platforms need and B2C sectors, which invest more than average in digital
to be addressed. These change continuously and hinge media. (CMF 2020, p.2)
”Content creation and marketing have to go hand in upon which factors are being observed: the platform’s
hand; both belong in a common editorial plan.
(CMF Content Promotion White Paper 2016, p.6)
“ growth factor, its net reach, and the length of time spent.
If one looks at the channels where content marketing
investments are sizable, these are also becoming increa-
Content production as well as marketing belong in a com- singly digital in nature: Ten years ago, most people still
mon editorial plan. Connecting both worlds requires a new thought of print with regard to the topic of content marke-
way of thinking, for in the past, many companies did not see ting (in the form of client magazines, for example). Nowa-
the necessity of marketing and focused predominantly on days, t hese are digital platforms, websites, and/or at least SHARES OF DIGITAL MEDIA AND PRINT MEDIA IN CM INVESTMENTS
the challenges of high-quality content production. a landing page where content is staged. OVER TIME
Print Digital
This about-face from print to digital is also reflected in
PA ID MEDI A A S A DR I V ER F OR INCR E A SING CM the results of the baseline study: Whereas in 2012, 60% of
IN V E S T MEN T S investments went into print, the ratio is now more than 38%
49% 45% 43%
reversed: 60%
Yet now, nearly two-thirds of decision makers are convin-
ced that content marketing does not work without a paid 6 2 % OF IN V E S T MEN T S A R E DIGI TA L , ME A NING
scope, a.k.a. pay to play. This is a clear increase in com T H AT CON T EN T M A R K E T ING I S INCR E A SINGLY 62%
51% 55% 57%
parison to 2018. (CMF 2020, p.3) TA K ING PL ACE ONLINE . 40%
In absolute numbers, this means that €1,880 million is Where print plays to its strengths: Since 2012, digital con-
invested each year in content promotion in the DACH tent management investments have more than tripled – 2012 2014 2016 2018 2020
countries – an increase of 20% in comparison to 2018. but print investments have also increased. Source: CMF 2020, p.22; base: n=319 CM decision-makers; weighted
www.statista.design/en // content-design@statista.com// 02 CO N T EN T C R E AT I O N A N D D I S T R I B U T I O N
21
S OCI A L MEDI A A ND PA ID SOCI A L A R E T HE MOS T WHICH OF THE FOLLOWING CHANNELS DO YOU USE FOR PAID MEDIA MEASURES APPLIED IN B2B AND B2C IN NORTH
IMP OR TA N T DI S T R IBU T ION CH A NNEL S CONTENT MARKETING? AMERICA IN THE PAST 12 MONTHS
B2C B2B B2C B2B
Over the past few years and alongside proprietary web-
sites, social media platforms have become the most im- Social media Proprietary Social media advertising / Sponsored posts
portant distribution channel for content marketing and channels website 89%
constitute part of the content marketing strategy for 95% 72%
of B2B and 88% of B2C companies (cf. figure, left). 88% 92% Sponsorships
95% 98% 44%
66%
According to the CMI report, social media, in addition to a
proprietary blog/website and e-mail, is the most import- Search engine marketing (SEM)
68%
ant organic distribution channel for nine out of ten B2B
61%
decision makers. Yet 84% of B2B decision makers and 85%
Display advertising
of those in B2C also use content promotion, i.e., paid dis- Blogs Separate
content 50%
tribution channels. Here too, paid social – particularly at 46%
pages
LinkedIn for B2B and at Facebook and Instagram for B2C Partner e-mails
(see next chapter) – plays the most important role 46% 30% 25%
(cf. figure, right). 52% 51% 32%
Native advertising / sponsored content
40%
31%
Source: Statista et al. 2020a, p.13: base: n=198 CM decision-makers in total; n=76 B2C companies; n=122 Source: CMI 2020a, p.27 & CMI 2020b, p.25; base: n=679 B2B content marketers, n=179 B2C content
B2B companies; multi-pick marketers
www.statista.design/en // content-design@statista.com// 02 CO N T EN T C R E AT I O N A N D D I S T R I B U T I O N
22
A PPLIED CON T EN T PROMOT ION ME A SUR E S For after all, media budgets flow to wherever the
target groups are, and at the same time, the pres-
At CMF, the list of applied content promotion ap- sure is on the marketing decision makers to demon-
proaches continues to expand with each passing strate the success of media issues via reliable data.
year. A whopping 61% of CM decision makers who
were surveyed use a newsletter, followed by paid First, the numbers have to show that media usage
CONTENT PROMOTION MEASURES APPLIED IN DACH 2020 COMPARED TO 2018 social and paid search. A strategy with the highest is shifting significantly. What is initially a gut feeling
growth quotas is the aforementioned influencer must be backed up with hard facts so that media
61% new Digital newsletters marketing, now used by 37% of CM decision makers. budgets can be allocated more efficiently.
57% +5% Social media advertising (cf. fig.)
• Which channel reaches which target group?
55% +9% Search engine advertising The Federal Association for a Digital Economy (Bun- • In which use situation are they located?
desverband Digitale Wirtschaft e.V. or BVDW) diffe- • Are the conditions for addressing the personas
49% +9% Traditional online advertising
rentiates among three types of content in its Content better as compared to other channels?
48% +4% PR / media relations Marketing KPI Finder (www.kpi-finder.com): explore,
evaluate, and engage. As a matrix, the model provi- Responses to this topic are provided by the excellent
40% new Print mailings
des a highly structured and clear basis for an over- and freely accessible ARD/ZDF online study, which
37% +7% Influencer marketing view of one’s own content marketing actions. Thus, shows developments in Germany with regard to me-
depending on the strategy, such content is distri- dia but also social media use. Since 1997, this funda-
34% +7% Online advertorials / sponsored articles
buted via diverse channels such as websites, blogs, mental study has provided outstanding represen-
33% +8% Content ads / sponsored recommendations online stores, e-mail newsletters, native ads, as well tative data on an annual basis about media use in
as numerous social media platforms. (cf. BVDW 2020) Germany. It is one of the most valuable sources for
24% +4% Content syndication describing the evolution of media use behaviors via
20% new Owned media In order to efficiently position social media within the arrival of the internet.
the context of a successful distribution strategy and,
6% +2% Other at the latest, as soon as a social media platform is
hyped, social media use studies serve as an argu-
2% −4% None
mentation aid and foundation for decision making
Source: CMF 2020, p.47; base: n=319 CM decision-makers; entries compared to baseline study in 2018 for paid content media planning.
www.statista.design/en // content-design@statista.com// 02 CO N T EN T C R E AT I O N A N D D I S T R I B U T I O N
THE MOST IMPORTANT SOCIAL MEDIA PLATFORMS 23
W HICH S OCI A L MEDI A PL AT F OR M I S IN structures and absolute numbers indicates: Instag- SOCIAL MEDIA PLATFORMS APPLIED IN DACH IN 2020 COMPARED TO 2018
T HE LE A D? ram has singularly knocked Facebook from its pede-
60%
stal among those aged up to 29 years, but among
+11%
Of all the social media offerings, Instagram has the above-30-set, Facebook continues to dominate
shown the highest spike in use as early as 2018 and the winner’s podium for social media. (cf. fig.) 51%
is used primarily by those under 30 years of age.
”
+13%
Among 14-to-29-year-olds, 62% use Instagram at Facebook continues to be used the most 44%
least once a month. This is followed at a conside- frequently. The chart toppers are Instagram +18% 41% 40%
rable distance by Snapchat, Twitch, XING, LinkedIn,
and Twitter. In general, Instagram and Snapchat are
und LinkedIn.
“ (CMF 2020, p.39) +10%
+15%
35% 34%
+9%
used especially frequently by 14-to-29-year-olds: The CMI study also delves into the use of social me- +7%
28%
TikTok, for example, reaches five percent of tho dia platforms and differentiates between organic
+1%
se between
the ages of 14 and 29 years every day. content and paid social as well as between B2B and
(Beisch et al., 2019) B2C. The results here are as follows: In B2B, LinkedIn 20%
+8% 17%
has the edge over Twitter and Facebook with regard
+10%
The CMF study also shows how social media plat- to organic content, whereas in B2C, Facebook with
forms have shifted over the last few years. Yet even over 90% paid and organic holds a significant lead 8%
if no allegedly clear winner emerges – Instagram over Instagram. new
3%
and WhatsApp in B2C und LinkedIn surpasses XING
new
and Twitter in B2B – one must always differentiate The CMI study also delves into the use of social me-
between target groups and targets. Facebook might dia platforms and differentiates between organic
demonstrate the greatest losses and Instagram the content and paid social as well as between B2B and
greatest percentual profits, but a glance at the age B2C. The results here are as follows: In B2B, LinkedIn Source: CMF 2020, p.39; base: n=319 CM decision makers; entries compared to baseline study in 2018
www.statista.design/en // content-design@statista.com// 02 CO N T EN T C R E AT I O N A N D D I S T R I B U T I O N
24
has the edge over Twitter and Facebook with regard to or-
ganic content, whereas in B2C, Facebook with over 90%
paid and organic holds a significant lead over Instagram.
In the B2C category, Instagram has clearly assumed greater
significance and occupies second place for the most popular
WHICH SOCIAL MEDIA CHANNELS DO YOU USE FOR YOUR CONTENT MARKETING? social media channels, but as has been the case in the past,
is far behind Facebook while leading YouTube. (cf. fig.)
B2C B2B
IN S TAGR A M BEFLÜGELT INFLUENCER- M A R K E T ING
GER INT GER INT GER INT GER INT Yet unrelated to which platform happens to be in the lead,
93% 90% 45% 57% 66% 78% 60% 61% the mechanics continue to be the same: As soon as user
66% 74% 88% 85% 44% 51% 66% 56% numbers go up, so does marketing spending. According to
the BVDW study, 61% of advertising drivers wish to increa-
setheir budgets for influencer marketing in 2019 and the
discipline of influencer marketing is already poised to cross
the billions threshold. (Goldmedia 2018)
Correspondingly, and according to Socialbakers, the num-
GER INT GER INT GER INT ber of influencers who use the hashtag “#ad” have marked-
43% 3% 46% 50% 18% 14% ly increased over the past few years. (Socialbakers 2020)
64% 1% 57% 71% 7% 13%
For all those who are interested in digging deeper into t he
current state of research with regard to influencer marke-
ting, the influencer marketing compendium summarizes
the most important studies about this topic. It illustrates
Source: Statista et al. 2020a, p.14; base: n=183 CM decision-makers total; n=67 B2C companies; n=116 B2B companies; multi-pick
the fact that influencer marketing has become a perma-
nent fixture in digital marketing and is taking on an
www.statista.design/en // content-design@statista.com// 02 CO N T EN T C R E AT I O N A N D D I S T R I B U T I O N
25
WHICH OF THE FOLLOWING STR ATEGIES HAVE YOU APPLIED WITHIN THE
FR AMEWORK OF YOUR INFLUENCER MARKETING STR ATEGY OVER THE
PAST YEAR?
increasingly important role as a distribution chan- INFLUENCER M A R K E T ING A S A DR I V ER IN CON T EN T
nel in content marketing and outlines how this has PRODUC T PRODUC T ION
Whitelisting: native
come to pass. (cf. GreenAdz 2020) proliferation of 59%
influencer posts Not only does the discipline of influencer marketing play an increasing-
For example, the COMAE study in 2017 already ra- ly important role as a distribution channel for content marketing. Over
ted influencer marketing as the only distribution the past two years, the trend in influencer marketing has emerged that
channel that is used significantly more frequently by applying this discipline is especially worth the effort for the reason that
successful companies, thereby making it the most Dark posting: influencers also serve as content creators and are increasingly evolving
important paid media trend alongside the use of deliberate playout of
39% into crucial sources for content production.
content by targeting
native advertising. specific audiences
14% Other 68% By focusing on enduring influencer relationships with a high brand fit,
Similarly, the CMF baseline study has also identified Boosting via the criteria used to select influencers are shifting from community size
influencer marketing as the most rapidly growing proprietary websites to qualitative aspects such as compatibility with brand values as well
distribution channel in content marketing since 2016 as the quality and creativity of content production. Along with spon-
(see: applied content promotion measures, cf. p.22). sored content, influencers have become the second most frequently
used "content creators only," in other words, not as distributors, but as
OOH & POS by content studios. Is this a cheaper option for content production? Becau-
22% using contents Display/banner 31% se by 2019, three-quarters of the U.S. marketing decision-makers who
for posters advertising
were surveyed were already using the content from their influencer
campaigns elsewhere, and, in particular, the incidence of multiple con-
tent (re-)use continues to increase from year to year. (cf. ACTIVATE 2019)
Source: ACTIVATE 2019, p.17; base: n=111 US marketing decision makers in total; multi-pick
www.statista.design/en // content-design@statista.com// 02 CO N T EN T C R E AT I O N A N D D I S T R I B U T I O N
THE ANATOMY OF SUCCESSFUL CONTENT 26
WHICH FORMATS DO YOU CURRENTLY USE FOR ONLINE CONTENT MARKETING?
GER current INT current
71% 71%
72% 65%
A PPLIED CON T EN T F OR M AT S IN B2C V S . B2B 30% 59% 19% 60%
28% 1 47% 28% 1 67%
B2C B2B
10 2 10 2
Although developing publication channels in order to optimally achieve
reach goals is indeed exciting, a section about the ways and means o f
content should of course not be left out. Here, a comparison between
87% 9 3
22% 91% 9 3
24%
B2C and B2B marketing is important, for target groups, their require- 71% 21% 74% 21%
ments for content function, as well as the context of its use vary con
siderably.
33% 8 4
32% 42% 8 4
28%
The differences are clearest with the white paper content format. 19% 28% 15% 23%
These are used by 56% of the B2B marketers (49% internationally),
whereas the share of white papers in B2C at 20% (and 15% internatio-
7 5 7 5
nally) amounts to only one-third of that. Similarly, studies are used by
nearly half the German B2B content marketing decision-makers, where- 78% 6 20% 70% 6 56%
76% 15% 74% 47%
as only a quarter of the B2C respondents use them. (cf. fig.) 26% 45%
27% 35%
By international comparison, white papers and studies are used very
frequently for content marketing within Germany’s B2B sector.
1 2 3 4 5 6 7 8 9 10
Videos Infographics Audio formats, Interactive Whitepapers Studies Image formats Microsites Text formats GIFs
e.g., podcasts websites
Source: Statista et al. 2020a, p.2; base: n=192 CM decision-makers in total; n=122 B2B companies / multi-pick; Statista et al. 2020a & 2020b, p.12; base GER/INT: n=198/374 CM decision-makers, of which
n=76/175 B2C and n=122/199 B2B companies
www.statista.design/en // content-design@statista.com// 02 CO N T EN T C R E AT I O N A N D D I S T R I B U T I O N
27
WHICH FORMATS WOULD YOU LIKE TO MAKE GREATER USE OF ONLINE FOR YOUR CONTENT MARKETING IN THE FUTURE?
GER future GER current INT future INT current
67% 70%
71% 75%
INCR E A SINGLY IMPOR TA N T F OR M AT S IN B2C V S . B2B 11% 41% 17% 48%
39% 1 60% 31% 1 63%
B2C B2B
10 2 10 2
It is also interesting to compare which formats are poised to gain grea-
ter traction from the perspective of survey respondents.
20% 9 3
41% 19% 9 3
39%
Taking on greater importance are video formats – more than two-thirds 43% 53% 41% 51%
of those surveyed would like to implement them more frequently – as
well as interactive websites and infographics for both target groups.
Moreover, studies and white papers are used more often at rates of 18% 42% 23% 37%
8 4 8 4
35% and 29% in B2B. (cf. fig.) 38% 62% 38% 56%
When compared on an international scale, it appears that there is a
7 5 7 5
greater need to catch up. Here, infographics, as well as studies and
white papers, are trending even more strongly than videos. (cf. fig.) 24% 6 20% 24% 6 35%
54% 31% 46% 46%
20% 29%
35% 53%
1 2 3 4 5 6 7 8 9 10
Videos Infographics Audio formats, Interactive Whitepapers Studies Image formats Microsites Text formats GIFs
e.g., podcasts websites
Source: Statista et al. 2020a, p.12; base: n=198 CM decision-makers total; n=76 B2C companies; n=122 B2B companies|multi-pick; Statista et al. 2020a & 2020b, p.12; base GER/INT: n=198/374 CM decision-
makers, of which n=76/175 B2C and n=122/199 B2B companies
www.statista.design/en // content-design@statista.com// 02 CO N T EN T C R E AT I O N A N D D I S T R I B U T I O N
28
T HE A N ATOM Y OF A LE A DING INDUS T RY BLOG AVER AGE CLICK PRICE FOR OFFERS FROM INDUSTRY KEY WORDS
The areas where advertising hits a wall are where content becomes the
most valuable source of leads and opportunities to gain the attention
of users. And where surveys hit a wall is where content analysis of soci-
almedia tool providers are called into action. These are in the position
to access user behaviors combined with analyzed content and with it,
enormous data pools. $17.55
Insurance
One example of such an analysis is the comprehensive SEMrush study $12.08
about the current state of content marketing worldwide. In conjunction Online education $6.45
with a large expert survey, the analysis illustrates which traffic sources Example:
Marketing
work best in each industry for selecting the correct publication paths
and advertising their contents. To this end, an analysis was carried out Led by an average click price of US$17.55 in the insu-
for over 1,000 English-language industry blogs that received the most rance industry, it is definitely worth bearing in mind
traffic in the ten industries between April and September 2019 within from an ROI perspective the cost of attracting a
the ten industries representing the most expensive digital markets. prospect in an industry such as insurance. Moreover,
(cf. fig.) $2.28 $2.18 $1.90 $1.81 $1.74 $1.40 $1.15 the SEMrush survey provides points of departure by
House and Automobile Jewelry Fitness and Travel Real estate Medication industry about the level of mobile traffic (42%), the
garden commerce health
percentage of searches on the webpage (64%), the
length of blog articles that generate the most traffic
(almost 4,000 characters), and which type of content
Source: SEMrush 2020, p.21; base: evaluation in the period from April to September 2019 is used the most (FAQs at 24%).
www.statista.design/en // content-design@statista.com// 02 CO N T EN T C R E AT I O N A N D D I S T R I B U T I O N
29
CON T EN T PER F OR M A NCE DR I V ER S twice as much than other types of blog posts), followed by
guides and how-to articles.
As already demonstrated, content performance can be
assessed using several different metrics. Yet the ways Are absolute values preferable? Perhaps you also feel
in which traffic, social shares, visibility, and interaction that instead of abstract pie charts and bar graphs, you
rates are influenced by the characteristics of the text – would rather refer to tangible comparative values in order
content length, time spent reading, or structure – is shown to define your goals based on such benchmarks and ca- INFLUENCE OF HEADLINES ON CONTENT
by the SEMrush study of content analysis, based on a tegorize your successes accurately. To this end, the study PERFORMANCE
good 700,000 articles appearing on blogs with 50,000 to indicates benchmarks for the average number of page
500,000 sessions. views as well as the number of shares for various content
formats.
PAGE VIEWS
203
The summary of the most important facts (SEMrush 191 182
2020, p.28). For this purpose, average individual page views per month
were calculated as well as shares on Twitter and Facebook
The longer, the better: Long reads of over 3,000 words with differently worded headings (questions and answers, 110
receive three times more traffic, four times the number of manuals, best-of lists, instructions, and more). It shows, 88
shares, and three-and-a-half times more backlinks than for example, that lists are shared an average of 37 times,
articles of average length (901–1,200 words). as opposed to 22 times for FAQ formats, and generate an
average of 262 page views. (cf. fig.)
Headlines can improve performance: Articles with long
headlines (more than 14 words) receive twice as much traf- Questions Manuals Lists Instructions Other
fic, five times the number of backlinks, and are twice as
likely to be shared as articles with short headlines (7–10
22 21 18
words). Of the articles with h2+ and h3 headlines, 36% per- 37 28
SHARES
form highly with regard to traffic, shares, and backlinks.
List articles yield shares and traffic: So-named listicles
Source: SEMrush 2020, p.21; base: average number of page views as well
are shared the most and receive the most traffic (up to as shares based on content type in 2019; evaluation in the period from
April to September 2019
www.statista.design/en // content-design@statista.com// 02 CO N T EN T C R E AT I O N A N D D I S T R I B U T I O N
30
PUBLIC AT ION FR EQUENC Y AT LE A S T SE V ER A L HOW FREQUENTLY DO YOU PUBLISH CONTENT?
T IME S A W EEK
B2C B2B
Through the shift to digital distribution channels, particularly social me-
dia, the frequency of content publication has also increased. Above all,
B2C companies are more active and a third of them publish content on
a daily basis. An additional 42% do so at least multiple times a week.
In B2B, the percentage of those who publish less than once a week – 33% Several times 42%
Daily
30% – is nearly twice as high as the percentage in B2C companies. 17% a week 44%
(cf. fig.)
By the way: by international comparison, the discrepancy between B2B
and B2C – at least with regard to this question – is not quite as large.
Once a 9% Less 16%
week 9% frequently 30%
Source: Statista et al. 2020a, p.10; base: n=198 CM decision makers in total; n=76 B2C companies; n=122 B2B companies; multi-pick
www.statista.design/en // content-design@statista.comYou can also read