STATE OF THE - Sweets and Snacks Expo

Page created by Alexander Chapman
 
CONTINUE READING
STATE OF THE - Sweets and Snacks Expo
STATE OF THE
 FRONT-END
STATE OF THE - Sweets and Snacks Expo
The Front-End experience has come a long way
STATE OF THE - Sweets and Snacks Expo
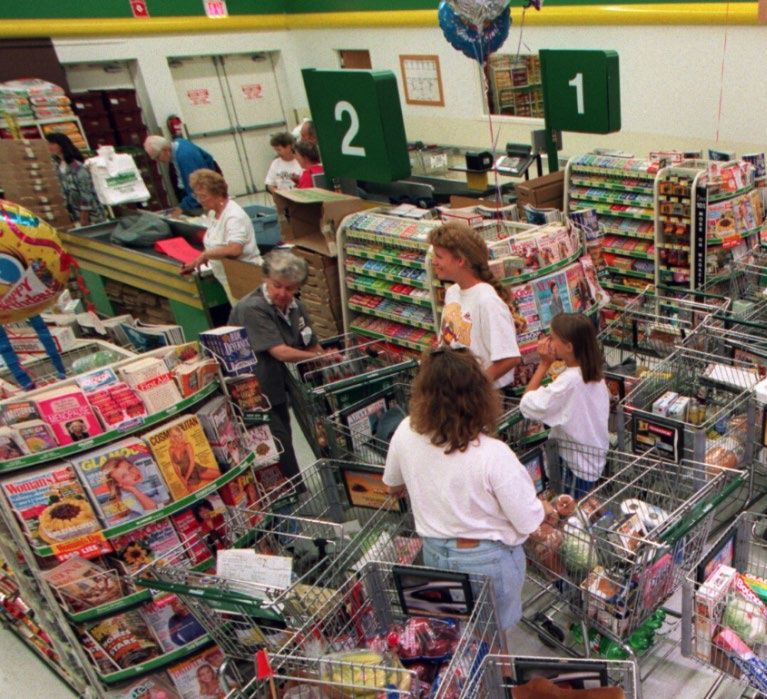
Evolution began with a conveyor belt and bar code
STATE OF THE - Sweets and Snacks Expo
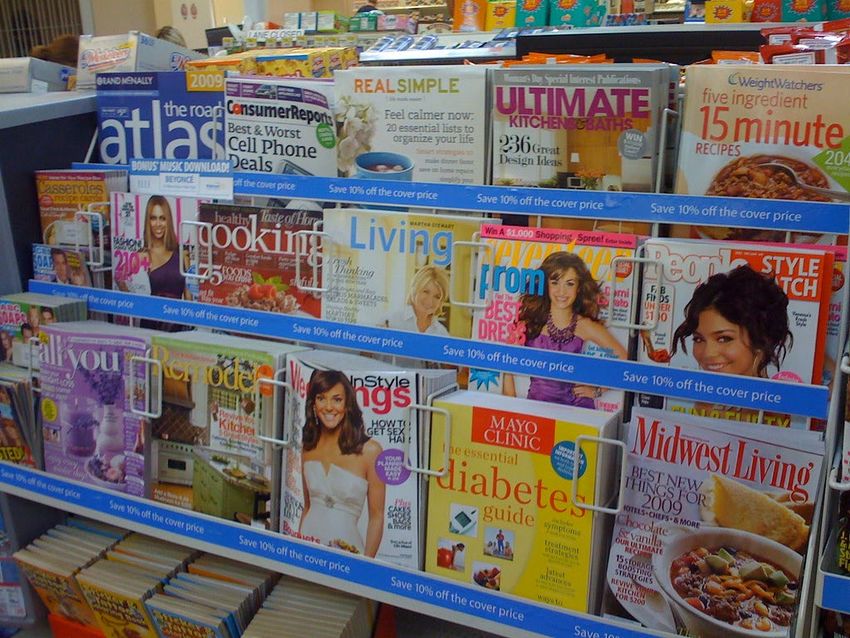
Merchandising followed and a category was born
STATE OF THE - Sweets and Snacks Expo
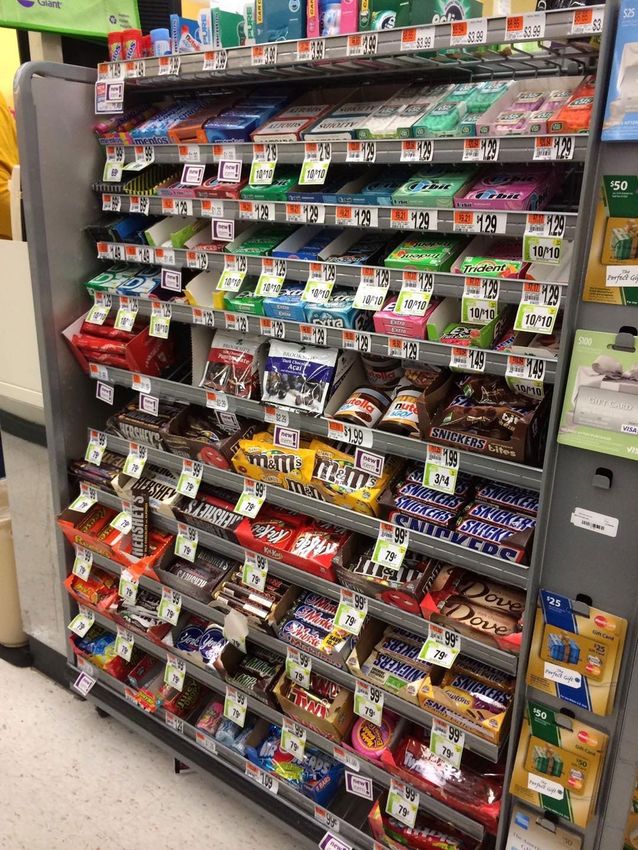
Initially, the offering was largely Magazines – with some Confection

https://stacker.com/stories/3984/history-
supermarket-industry-america
STATE OF THE - Sweets and Snacks Expo
Cigarettes also played a bit role

Source: blog.buffalostories.com/tag/cigarettes/
STATE OF THE - Sweets and Snacks Expo
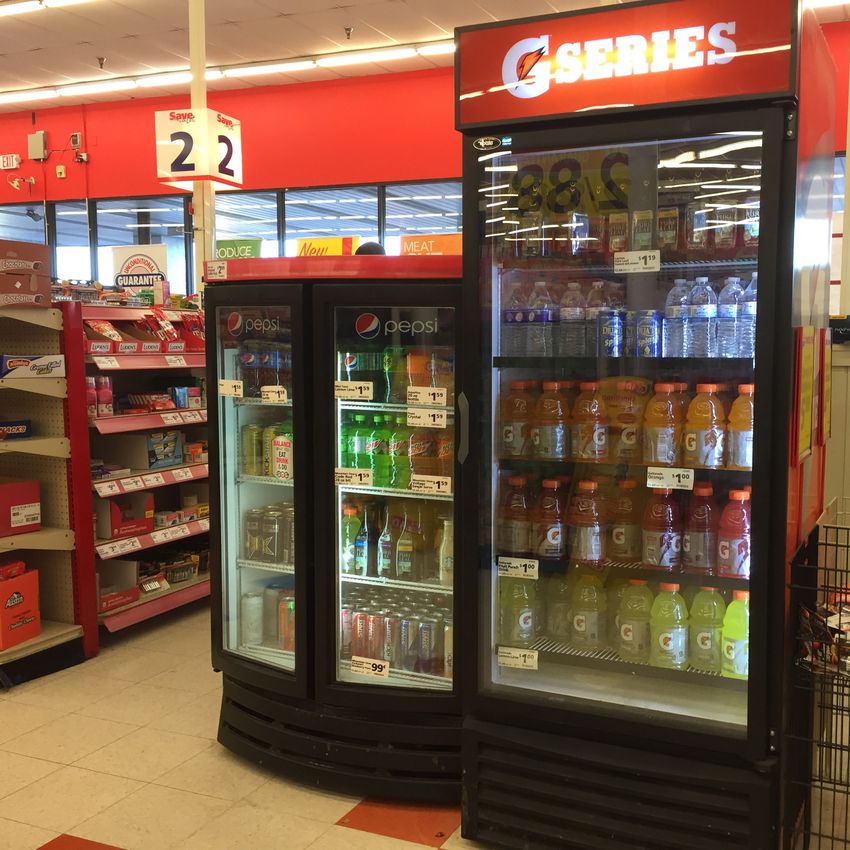
Beverages moved in and added opportunistically to checkout
STATE OF THE - Sweets and Snacks Expo
The first retail self-checkout system was installed in the 90’s

                                                                                Dr Howard Schneider developed
                                                                                the first retail self-checkout
                                                                                system - called “the service
                                                                                robot” which was installed in
                                                                                1992 at a Price Chopper
                                                                                Supermarket in New York

https://www.progressivegrocer.com/grocery-tech-look-past-centurys-innovations
https://qikserve.com/self-service-tech-a-history/Aug 6, 2018
STATE OF THE - Sweets and Snacks Expo
Self-checkout expanded over the years - often a love / hate relationship
STATE OF THE - Sweets and Snacks Expo
But our lives have changed significantly

                                                           Prioritizing Convenience:
                                                           • 45% of consumers claim
                                                             to eat snacks instead of
                                                             eating meals at home

                                                           • 72% do not plan when
                                                             they will eat snacks
                                                             during the day, but grab
                                                             one as needed (+5pts vs
                                                             5yrs ago)

                                                           • Consumers average 2.7
                                                             snacks per day
Source: IRI : Seesaw State of the US Snack Industry 2022
And, COVID has impacted shopping behaviors
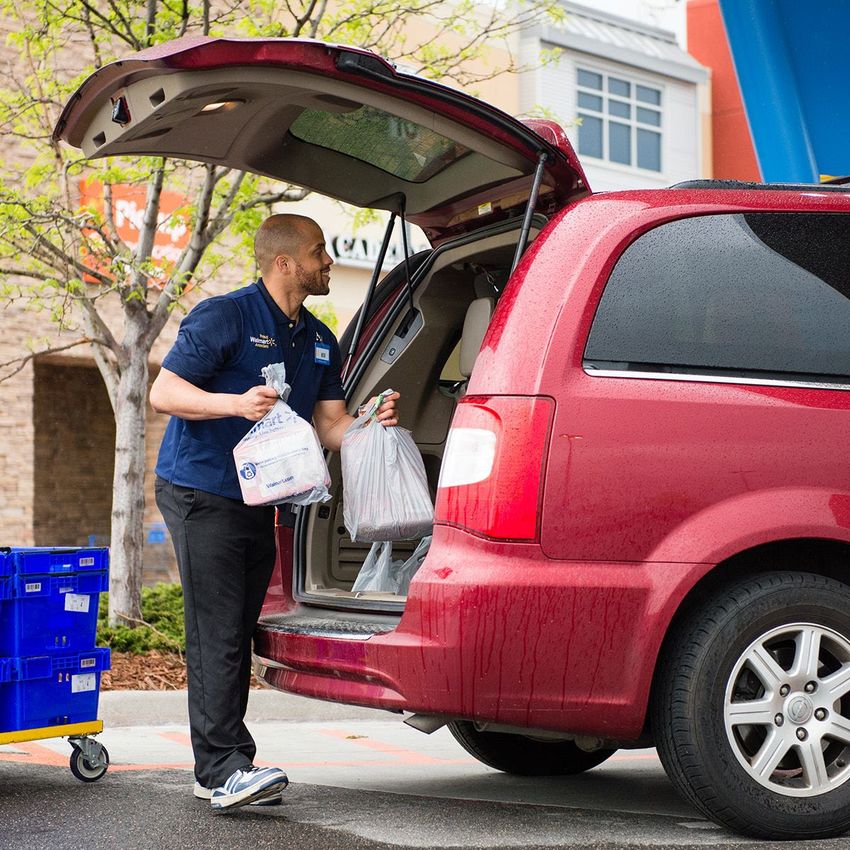
    Prioritizing
    Convenience … in a
    different way

    • Personal space
      and safety

    • Fast transaction

    • Increase in online /
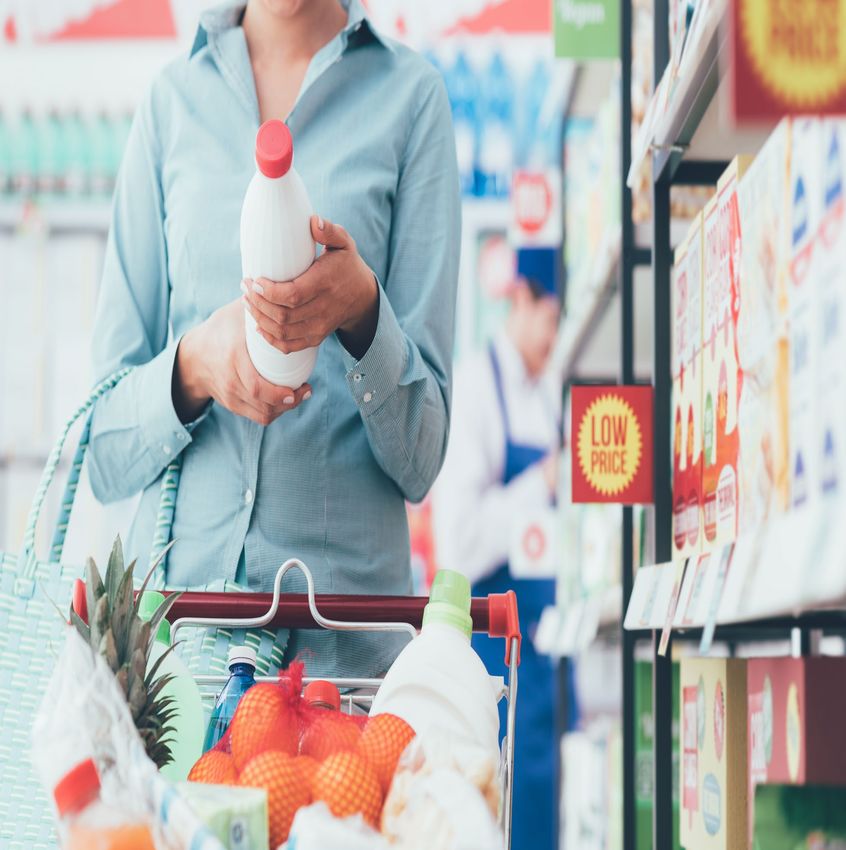
      mobile shopping
Inflation is also impacting how & where people shop

                                                                                                                  Changes in Shopping
                                                                                                                       Behavior
                                                                                                            Have you changed your shopping choices
                                                                                                            recently due to increased grocery prices?
                                                                                                                 (among those who noticed higher prices)

                                                                                                             45% Looking for sales/deals more
                                                                                                             often

                                                                                                             33% Cutting back on non-essentials
                                                                                                             21% Switching to store brand/private
                                                                                                             label

                                                                                                             20% Switching to lower cost brands
                                                                                                             13% Switching to lower cost retailer
Source: IRI OmniConsumer™ Survey Solutions, December 2021, n=1,069 total respondents, fielded 12/3-8/2021
While sales are growing online, consumers intend to shop in store
more in the next year
                                                                         Less consumers have purchased or are planning to
                                                                                 purchase groceries online in 2022
                                                                                    Online Grocery Purchased & Purchase Intent

                                                                                                                   62.5%
                                                                                                                           59.0%
                                                                                                                                         54.3%
                                                                                                           52.0%
                                                                                                                                49.5%
                                                                                                                                               46.9%

                                                                                                   39.5%
                                                                                           36.8%

                                                                                   25.8%
                                                                           23.1%

                                                                              2018            2019           2020             2021          2022
                                                                              Have purchased in the last 12m          Expect to buy in the next 12m

Source: Supermarket News: Share of US Shoppers buying groceries online
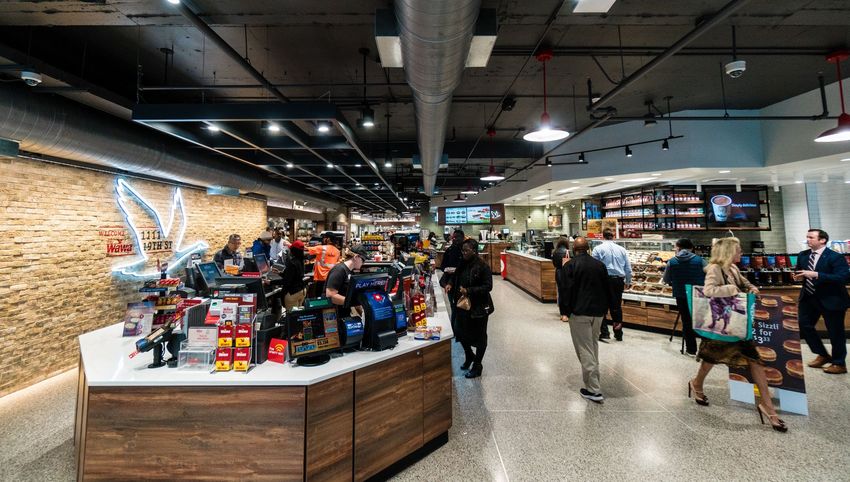
stabilizes 5/16/22
The checkout has evolved to become a very important part of the
in-store experience
Reducing friction for shoppers at checkout has become paramount retail
Checkout is important to the shopper

                                                                                             85% of shoppers say
                                                                                             checkout is important or
                                                                                              very important to their
                                                                                              shopping experience

                                                                                             58% of shoppers are
                                                                                           likely to change stores if the
                                                                                              primary difference was a
                                                                                            better checkout experience

Source: Forrester Research, “The State of Global Online Grocery Retail 2018”, March 2018
Checkout has been one of the biggest pain points for shoppers

                   Top 5 in-store Pain Points

   Product availability                                    69%

          Lines in store                             49%

       COVID safety in
           store                                     47%

          Wrong prices                         36%

            Lack of staff                  29%

Source: IHL Group/Intel Consumer Study 01/22
Shoppers desire an efficient transaction

   • Minimal Wait Time

   • Multiple transaction choices
     in-store

   • Efficient process – but
     immediate help when
     needed
And, Checkout is the one place in-store to satisfy the “me-moments”

                                        • Typical need states at checkout
                                          include:
                                            • Hunger Satisfaction
                                            • Reward
                                            • Forgotten Items /
                                              Convenience

                                        • Impulse purchases are less
                                          price sensitive

                                        • Items are consumed within 30
                                          minutes after leaving the store

                                        • Open to discovering something
                                          new
The balance of time and effort at self-checkout has proportionally been
on the efficiency side at the expense of the shopper need states

     Technology
     Operations
      Efficiency

                                                        Shopper
                                                     Personal Need
                                                         States
Self-Checkout installations accelerated due to COVID

                                                                                               Global shipments of
                                                                                               self-checkout
                                                                                               machines increased

                                                                                               by   25% in 2020

Source: Retail Customer Experience, Self-Checkout Machine Systems Jump 25% in 2020; December
2, 2021
Self-checkout usage has grown over the last few years

                                                      •   On average, 59% of shoppers
                                                          used cashiered lanes and 41%
                                                          used self-checkout

                                                      •   Some stores report as high as
                                                          70% of transaction now
                                                          occurring at self-checkout
                                                          depending on demographics,
                                                          training, # registers, open cashier
                                                          lanes, etc.

Source: IMC Proprietary Retailer Research 2021-2022
Self-checkout also helps retailers address labor challenges

                                                                                          “Every 1-percent shift to
                                                                                          self-checkout is $1 million
                                                                                          in labor expense that could go
                                                                                          back into the store for other
                                                                                          purposes"
                                                                                          Dave Wilkinson, President NCR

Source: Convenience Store News: Technology Experts Decode the Year’s Top C-store Trends
But, availability and labor issues persist - impact sales
Shoppers’ interest in Non-Traditional checkout is growing

                                                                   All groups also say they desire non-
                                                                    traditional checkout experiences –
                                                                   the highest being Gen Z at 86%
                                                                         and Millennials 80%

Source: PYMNTS.com Today’s Self-Service Shopping Journey Grocery
Results
Self-checkout and POS improvements are among top retailer technology
investments

              Top Grocery
          technology priorities
                in 2022

          67% Inventory visibility
          49% Adding self-
          checkout

          1 out of 5 grocers
            plan POS infrastructure
            upgrades – both in hardware
            and software
Source: IHL/Intel Consumer Survey 2021 of FDCM retailers
https://progressivegrocer.com/6th-annual-grocery-tech-trends-study
Retailers are responding with new investments in cashier less innovation
The Checkout Category is a big, growing category for retailers

                                      Annual US Supermarket Sales*
                                      = $804 Billion X .77%** of Sales                     Total Checkout Sales $
                                    = ~$6.2 Billion Total Checkout Sales
                                                             0.87%                                                  $6.16

                                0.77%                                              $5.54

                          % of Store Sales              % of Store Profit           2017                            2021

            Checkout is almost  1% of total store sales equaling            Category has increased      11.2%    since 2017

                            $6.2B in total category sales                          driven by gains over the 5 years

 Source: IMC Checkout Update 2022
And, Front-End items are in 21% of grocery baskets

                                                             Product Trips

                                             89.2     88.5

                                                                             17.8   18.6

                                              Total Store                     Checkout
                                                               2020   2021

Source: IRI Front-End Food 52 w/e 12/26/21
The key principles of checkout category merchandising are

                    Allocation                              Visibility
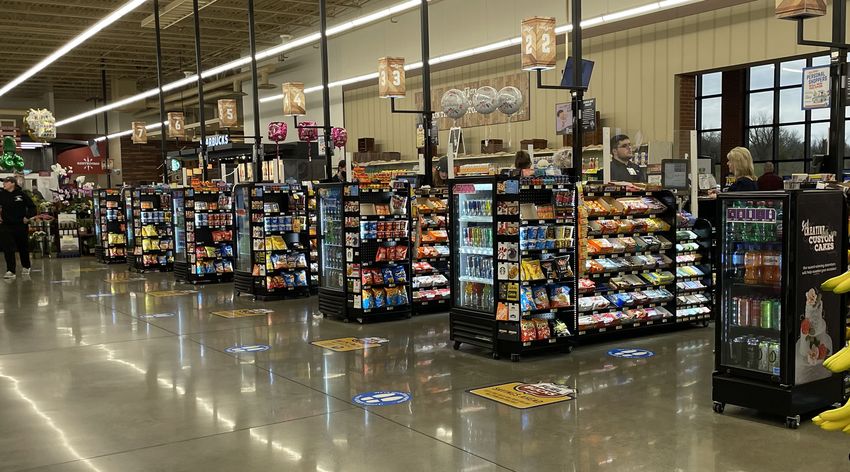
  Availability                         Location
Shopper need states don’t necessarily change based on how they
transact

   Shopper
   desires or need
   state no not
   change based
   upon
   transaction
   point ?
   Friction is
   added when
   shoppers can’t
   find what they
   want at
   checkout
Availability is a big issue at self-checkout

                                         •     Self-checkout areas tend to
                                               be optimized for transaction
                                               efficiency

                                         •     Terminals positioned so that
                                               candy, snacks, gum and
                                               beverages are not at arms
                                               length

                                         •     Terminals not positioned in a
                                               way to enhance customer
                                               flow, queuing and impulse
                                               sales
Consider the shopper’s experience
Without effective merchandising, conversion drops an average of 50%

                                                                      On average, the conversion difference between cashiered
                                                                                               and
                                                                           self-checkout lanes is              50% across all categories
                                                                                     % Average Conversion Difference by Segment
                                                                      10                                                                                  0%

                                                                      9                                                                                   -10%

                                                                      8                                                                                   -20%

                                                                      7     -29.3%                                                                        -30%

                                                                      6                                                                        -41.4%     -40%

                                                                      5                                                          -48.7%                   -50%
                                                                           9.3           -55.5%
                                                                      4                 7.8                                                               -60%

                                                                      3          6.5                                                                      -70%
                                                                                                      -73.7%
                                                                      2                              3.8                                                  -80%
                                                                                              3.5                               3.1
                                                                       1                                             -91.3%                               -90%
                                                                                                                                      1.6
                                                                                                           1.0      0.6   0.1                0.7    0.4
                                                                      0                                                                                   -100%
                                                                           Beverage      Candy      Gum & Mints    Magazines     Snacks            GM

                                                                                         Cashiered Lanes         SCO Lanes      SCO % Difference

*Source: IMC Proprietary Retailer Research 2021 – 6 retailers total
This is devastating for Confections in particular

                                               % Total Category $ Sold in Checkout

                                                                    86%

                                             28%
                                                         22%

                                                                                3%

                                             Total      Candy     Gum/Mints    Snacks
                                          Confections

 Source: IRI Front-End 52 w/e 12/26/21
Losses for retailers are significant

                      % Transactions                                 Average Conversion Difference
                                                                20
                                                                18
                                                                                                        Average transactions per day
                                                                16
                                                                14
                                                                                                         1,868
                  37.1%                                         12
                                                                10
                                                                                                        $1.90 average price
                                                                8
                                                                                                        Conversion gap worth $116 per
                                                62.9%
                                                                4
                                                                 6
                                                                             17.3
                                                                                                 8.8
                                                                                                         day per store
                                                                 2
                                                                0
                                                                                    Conversion

                           Cashiered     SCO                                  Cashiered     SCO

                                          $4.3M      Based on an average 100-store chain, this is
                                                            per year in profitable impulse purchases

*Source: IMC Proprietary Retailer Research 2021 – 6 retailers
This is a $1.5 billion dollar risk to a top 10 center store category

                                                    Rank       2021 Top Categories       Dollar Sales           $ % Chg

                                                           All Categories                    $374,036,572,770       -2.5%
                                                     1       BEER/ALE/ALCOHOLIC CIDER         $13,617,732,092       -4.4%
                                                     2       CARBONATED BEVERAGES             $13,142,560,145        4.6%
                                                     3       SALTY SNACKS                     $13,023,946,932        1.2%
                                                     4       NATURAL CHEESE                   $10,858,592,350       -3.7%
                                                     5       WINE                             $10,123,383,305       -5.6%
                                                     6       FRESH BREAD & ROLLS              $10,118,006,049       -2.5%
                                                     7       BOTTLED WATER                     $8,585,257,234        6.2%
                                                     8       DAIRY MILK                        $8,203,821,819       -4.2%
                                                     9       DINNERS/ENTREES - FZ              $6,683,116,331        2.5%

                                                    10         CHECKOUT                 $6,156,727,642             2.7%
                                                     11      COFFEE                            $5,844,808,669       -3.4%
                                                     12      YOGURT                            $5,367,870,129        1.0%
                                                     13      BREAKFAST MEATS                   $5,316,519,195       -3.1%
                                                     14      ICE CREAM/SHERBET                 $5,027,315,114       -8.6%
                                                     15      COLD CEREAL                       $4,952,709,777       -9.6%

*Source: IMC Checkout Update 2022
**IRI Total US Food Calendar Year Ending 12-27-21
Yet, it could be a big opportunity for growth

                                                                                           If retailers can increase Self
                                                                                           Checkout conversion to that
                                                                                                 of cashiered lanes,

                                                                                               this is a$3.1B
                                                                                               opportunity for the
                                                                                             immediate consumption
                                                                                                     category!

*Source: IMC Proprietary Research 2021 & IRI Category size Calendar Year Ending 12/26/21
How can retailers
 balance the need for
efficiency while solving
  for shopper needs?
What leading retailers do to optimize checkout category sales and profitability

 Establish a checkout
 category with a
 dedicated manager
 Develop a checkout
 category plan by pay
 point
 Evaluate each pay
 point and the entire
 checkout category
 annually

 Have on-going test
 and learn project plan
Analyze current business performance to identify gaps

              Category Conversion by Pay Point                                                                     % of Checkout Category Space
     26%
                                                                                                                                                          26.6%

                                                                                                                          23.4%
        20%                                                                                                                       22.7%
           19%19%                        19%
                                                                                                                                      20.5%
                                   18%                                                                         19.5%
                       16%                                16% 15%                                         17.8%
                             15%
                                               13%                                                                                            14.8%
                                                                                                                                                              14.1%
                                                                                                                                                                             12.4%

                                                                                        8%                             9.4%                       10.0%
                                                     8%                                      7%                                                                       8.7%
                                                                              7%
                                                                    6%             6%             6% 6%

                                                                         2%

           Candy             Snacks            Gum & Mints           Magazines                GM

                   Regular                 Self-Checkout                 Average              Top

       Merchandising Productivity                                                                          Category Space Analysis

Source: IMC Proprietary Research 2021
Create merchandising solutions that offer top sellers at all pay points
Impulse Marketing Co can help achieve success

                            Analyze                                                   Track

                 26%

                  20% 19%
                                 19%
                              18%
                    19%   16%
                                             16%15%
                            15%        13%

  Strategize                             8%
                                                      6%
                                                           7%
                                                             6%
                                                                  8% 7%
                                                                      6%
                                                                        6%   Design
                                                       2%

                  Candy    Snacks      Gum & Magazines               GM
                                       Mints
Thank You!

             impulsemarketingco.com
You can also read