Spatial Strategy Justification 2019 - County Durham Plan - Consultation Home
←
→
Page content transcription
If your browser does not render page correctly, please read the page content below
County Durham Plan

Spatial Strategy Justification 2019

Contents

    Region
1   Introduction                                                                        2
2   Historical Context and Spatial Legacy                                               6
3   Policy Context                                                                      9
4   Issues and Options and Preferred Options                                          10
5   County Durham - Where we are now                                                  15
           5.1 Sustainable Patterns of Development                                    15
           5.2 Addressing Economic Under-Performance                                  26
           5.3 Providing for the Right Homes in the Right Places                      33
           5.4 Sustainability Appraisal                                               45
6   Conclusion                                                                        50
7   How the Chosen Distribution Will Impact on County Durham                          51

                                                    0000001 Spatial Strategy Justification
1      Introduction

      1.1    The Spatial Strategy justification seeks to succinctly articulate why the strategy and spatial
      approach of the Plan is the most appropriate for County Durham. This paper brings together the
      various relevant strands of evidence base to clearly express what the council deems to be a sustainable
      and positive strategy to ensure the economic performance of the county is improved and to meet our
      need for new housing and the associated infrastructure, services and facilities to support our
      communities.

      1.2 County Durham has recently experienced some of the worst economic conditions in a generation
      which has impacted on all of our communities. The county's population is also projected to age
      considerably over the next 25 years and therefore changes to economic activity rates are critical in
      preventing a drop in the overall rate of employment. A sustainable solution is therefore required to
      ensure that we respond to the challenges presented to ensure a positive and vibrant future.

      1.3 In order to build a strong and competitive economy, business and industry require certainty
      through the Plan. Built on solid research and evidence the Plan seeks to identify a strategy and spatial
      approach which will meet housing need and improve economic opportunities by providing the conditions
      to attract new investment to the area.

      1.4 Business have told us that they need to be close to the A1(M) and A19 strategic transport
      corridors as key routes providing excellent links to our neighbouring conurbations as well as to the
      rest of the country. We also want to harness the opportunity presented by Hitachi’s investment in
      Newton Aycliffe, keeping as much of the benefits and the supply chain within the county as possible.
      The Plan will also support indigenous businesses and entrepreneurs by ensuring that a range of
      suitable employment sites are available across the county. The supporting Infrastructure Delivery
      Plan identifies the key elements that are needed to support delivery. As well as schools, health and
      social provision the Plan identifies the need for investment in sustainable transport infrastructure.

      1.5 In order to ensure sustainable patterns of development, locational benefits offered by Durham
      City and the largest towns of Consett, Chester-le-Street, Stanley, Bishop Auckland, Crook, Newton
      Aycliffe, Shildon, Spennymoor, Peterlee, Seaham and Barnard Castle need to be harnessed to ensure
      that new housing is built in areas where people want to live.

      1.6 Not withstanding the role of the largest towns, each settlement has a different role to play in
      the sustainable future of the county, each with different opportunities and aspirations for growth.
      Given the rural nature of many parts of the county it is essential that our rural communities are also
      given the opportunity to thrive whilst recognising the intrinsic character of the countryside within which
      they are located.

      1.7 The Plan needs to continue to improve the quality and choice for our residents, ensuring that
      new development meets the specific needs of our communities. New development needs to be
      provided in the most sustainable way, building on suitable, deliverable brownfield land where possible
      and ensuring that housing caters for all different groups in the community including families and older
      people. New houses need to be located in the right locations and where growth is supported by local
      infrastructure and can help to support existing services in towns and villages.

      1.8 The county has a unique environment and has developed a reputation for its quality of place.
      Our coast has won UK Landscape of the Year, Durham Cathedral, as part of the World Heritage Site,
      was recently voted the nation's favourite building, we also have two wonderful Dales making up part
      of the North Pennines Area of Outstanding Natural Beauty as well as many acres of forests, meadows
      and parks. The county's diverse landscape is a major asset which we need to continue to improve
      and enhance.

      1.9 We believe therefore that the strategy offers significant hope to those looking for jobs and
      decent homes by promoting sustainable development throughout the county whilst continuing to
      enhance the environment and improve the quality of life for existing and future residents.

    2 0000001 Spatial Strategy Justification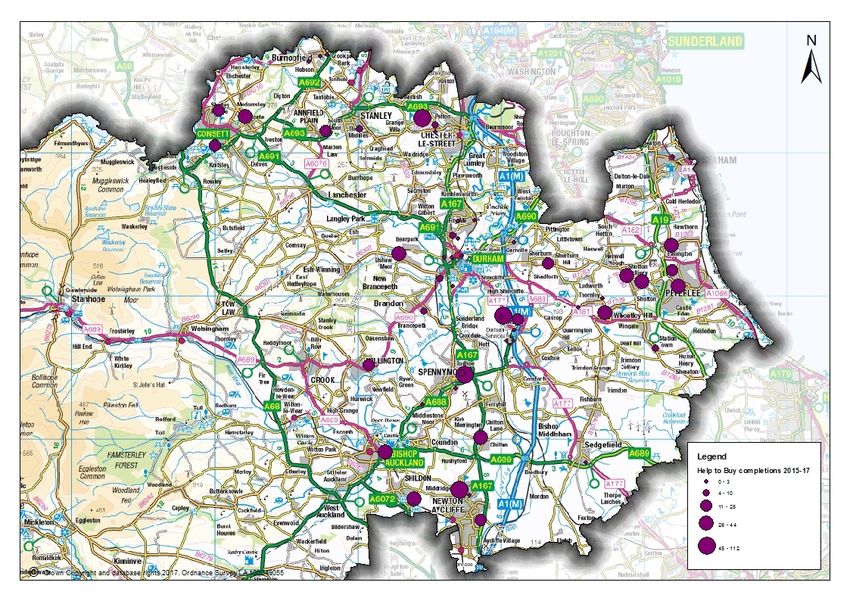
Introduction         1

Executive Summary

1.10 In identifying the preferred option for the spatial distribution of housing the comments made
during the consultation have been fully considered together with the following principles.

Sustainability

1.11 The National Planning Policy Framework (NPPF) makes it clear that the purpose of the planning
system is to contribute to the achievement of sustainable development in terms of its economic, social
and environmental impacts. Therefore patterns of growth should be managed so that significant
development is focused on locations which are or can be made sustainable. This limits the need to
travel and allows the fullest possible use of public transport, walking and cycling by maximising access
to services, facilities and employment opportunities.
                                                                      (a)
1.12 To this end The County Durham Settlement Study helps us understand the roles and the
access to services and facilities of each of the county's settlements. The Study also assists in
understanding the relationship between settlements and how they serve social and community needs,
where people shop and go to school, work and leisure. It shows that locating new housing in the
county's larger settlements would maximise the opportunity for residents to travel to work and to other
services and facilities by sustainable modes of transport. It also shows that Durham City has more
employment opportunities, services, facilities, cultural offer, leisure facilities etc. than any other
settlement in the county and should therefore play a major role in the spatial strategy for the county.
Other towns with a good range of services and facilities include Bishop Auckland, Consett, Newton
Aycliffe, Peterlee and Seaham.

1.13 The existing location of employment opportunities and associated commuting patterns (which
are likely to remain similar in the future) show that in order to maximise access to jobs, to minimise
the increase in commuting and to deliver sustainable patterns of development, the focus for
new housing should be the county's larger settlements.

1.14 The spatial strategy does however also identify appropriate quantities of development in other
settlements across the county, to sustain their vitality, support new and existing services and facilities
and to provide suitable housing for local communities.
                                             (b)
1.15 The Sustainability Appraisal assessed the options for the distribution of housing set out in
the Issues and Options and the decision to choose the Sustainable Communities option in the Preferred
options. Its conclusion was that 'overall the Sustainable Communities option provides greater
opportunities to deliver sustainable patterns of growth in comparison to the other housing distribution
options assessed'. It is therefore considered that the Sustainable Communities option is the most
sustainable option for the distribution of housing.

Impact on Economic Growth

1.16 The Government is committed to ensuring that the planning system should help create the
conditions in which businesses can invest, expand and adapt. NPPF states that plan-making should
positively and proactively encourage sustainable economic growth. It can do this by supporting the
delivery of the homes, industrial land and units, infrastructure and successful places that the country
needs. Every effort should therefore be made to identify and meet the development needs of an area,
and respond positively to wider opportunities for growth. Therefore any option for the distribution of
development should be considered in terms of its ability to support economic growth and the
regeneration requirements of County Durham.

a    http://durhamcc-consult.limehouse.co.uk/portal/planning/cdpev/
b    https://durhamcc.objective.co.uk/portal/planning/cdpev/

                                                                       0000001 Spatial Strategy Justification 3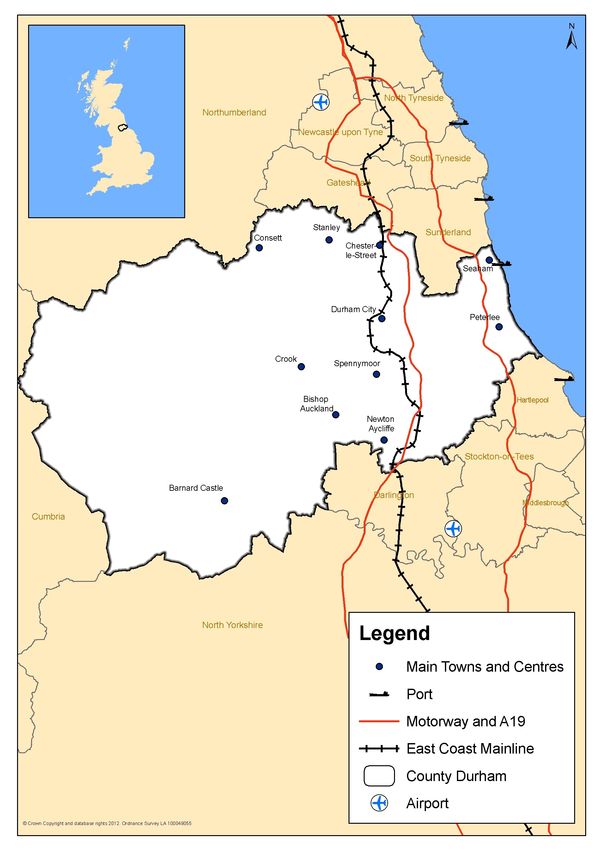
1 Introduction
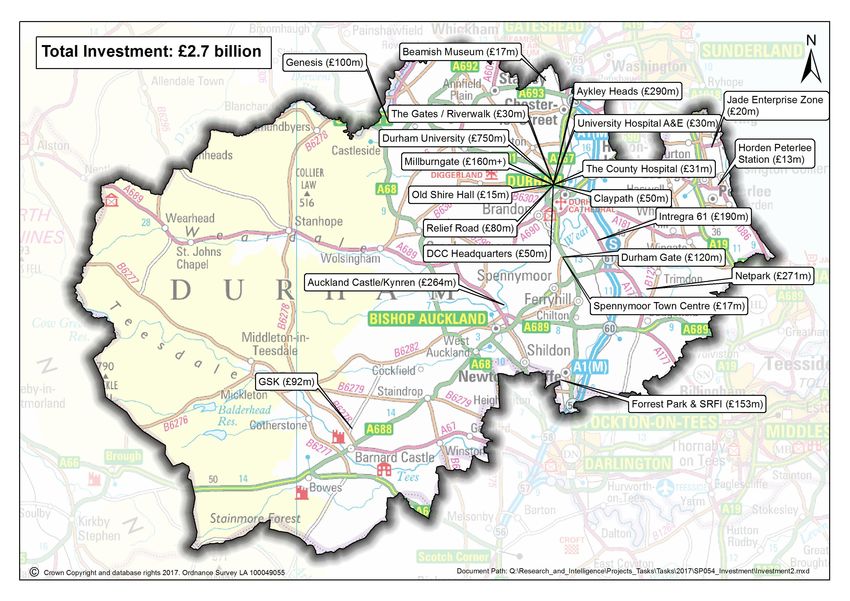
1.17 The County Durham Employment Land Review shows that the settlements in the A1 and A19
corridors are more likely to be a regional and national draw for business investment. Other settlements
such as Bishop Auckland and Consett serve a more local market. In addition some parts of the
county have recently or are currently experiencing significant new investment. This includes Hitachi
at Newton Aycliffe with over 1,000 jobs, a £92m investment by GSK in Barnard Castle, a £750m
masterplan for Durham University and Durham City Riverside with the new offices for the Passport
Office and NS&I and the redevelopment of Milburngate and The Gates.
1.18 To support our economic ambitions and the existing and future investment described above
we must also have a complementary housing offer with the right types of housing in the right locations.
It is therefore necessary to ensure that homes are being built which meet the needs and aspirations
of the county's existing and future population including by identifying sites in the right locations
including releasing some land in high value areas. This ensures that our housing market is not over
reliant on products such as Help to Buy and will secure additional affordable housing and other
supporting infrastructure.
1.19 It is therefore considered that the Sustainable Communities option is the most effective in
supporting economic growth as it recognises the importance of settlements in the main economic
corridors and those that can support continued investment in the county including by ensuring the
right homes are provided in the right places.
Viability and Delivery
(c)
1.20 Evidence within the Local Plan Viability Study , shows that viability and market attractiveness
varies significantly across the county with values fluctuating significantly across short distances. This
results in Highest Value areas mainly in Durham City and parts of Chester-le-Street, High Value areas
principally in Teesdale and South East Durham, Medium Value in much of the rest of the county and
Low Value areas mainly in many of the former coalfield communities. The delivery of development,
taking into account the reduced availability of public funding and market signals such as land prices
and housing affordability, is therefore an important consideration when comparing options for the
spatial strategy. Employment land and housing sites therefore need to be located in places where
businesses want to invest and people want to live.
1.21 The Local Plan Viability Assessment shows that sites in highest value areas have the highest
probability of being delivered. Elsewhere there are some settlements in Central Durham which have
potentially reached delivery capacity, suggesting that too much additional housing may ‘flood’ local
markets. Mid Durham is considered to be a fluctuating market which may reduce the likelihood of
schemes being delivered. The North and North West Durham monitoring areas are considered to
have a good track record of delivery as does the East on the proviso that the Help to Buy: Equity
Loan product is not withdrawn. West Durham is attractive to developers and delivery within the South
East monitoring area is relatively strong.
1.22 Therefore to ensure that the housing our existing and future residents need is built we must
provide a good spread of allocations across the county including in the highest and high value areas
where delivery is more certain. The Sustainable Communities option best reflects this approach.
The Chosen Spatial Strategy for the Distribution of Housing
1.23 As a result of the considerations set out above the Sustainable Communities option for
the spatial strategy for the distribution of housing is the council's chosen strategy for sustainable
development and informs the Plan's housing allocations. It is a dispersed pattern of development
located across key settlements in the county and principally focused in and around the county's towns
including Durham City, Consett, Newton Aycliffe, Bishop Auckland where the greatest opportunities
c http://durhamcc-consult.limehouse.co.uk/portal/planning/cdpev/
4 0000001 Spatial Strategy Justification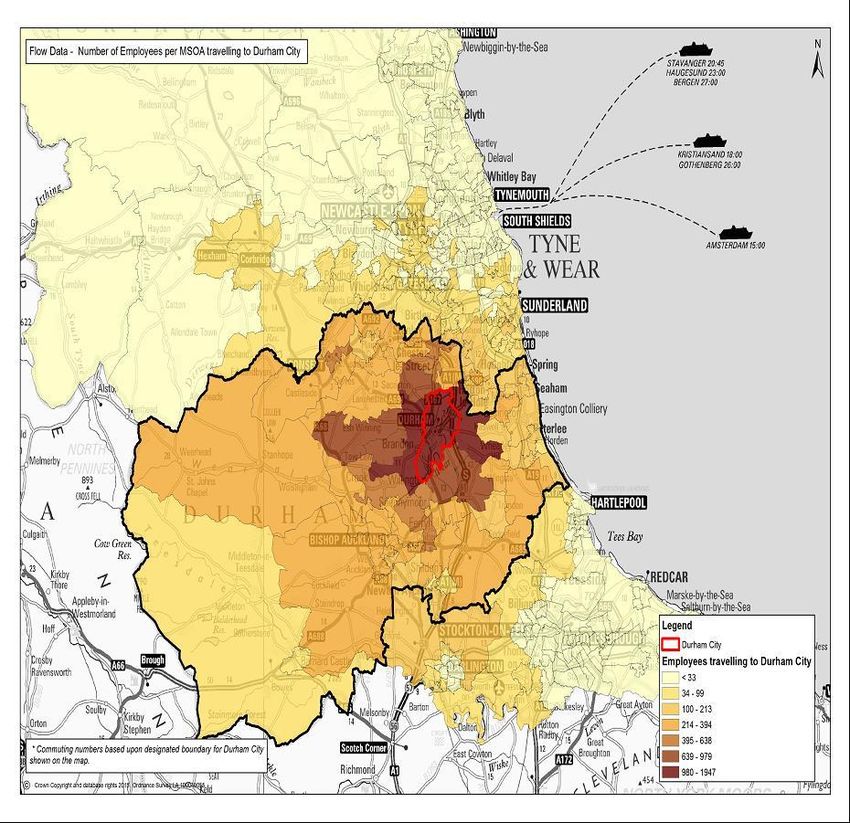
Introduction        1

for employment, services and facilities, public transport and other infrastructure such as healthcare
and education exist. This reflects the Plan's Sustainable Development Statement and will ensure we
have a balance of housing across the county taking into account the most sustainable locations,
market attractiveness and the prospects for regeneration to meet our objectively assessed need for
housing. In order to achieve successful places, an appropriate level of new housing is identified in
settlements to ensure they can be sustained and be vibrant places to live.

                                                           0000001 Spatial Strategy Justification 5
2      Historical Context and Spatial Legacy

        Key Messages
        Significant regeneration efforts to re-stabilise the county's economy resulting from the spatial
        legacy of the industrial past, have had only localised success despite significant financial support
        from Government. The focus for this support for economic development has, in the past, been
        the most deprived areas of the county. The council is now seeking a sustainable approach to
        addressing the economic challenges across the county.

      2.1   County Durham has a population of 224,000 households across 229 settlements and covers
      an area of 222,600 hectares. The county stretches from the North Pennines Area of Outstanding
      Natural Beauty (AONB) in the west to the North Sea Heritage Coast in the east and borders Gateshead
      and Sunderland, Northumberland, Cumbria and Hartlepool, Stockton, Darlington and North Yorkshire.
      Although commonly regarded as a predominantly rural area, the county varies in character from
      remote and sparsely populated areas in the west, to the former coalfield communities in the centre
      and east, while 90% of the population lives east of the A68 in around half of the county by area.

    6 0000001 Spatial Strategy Justification
Historical Context and Spatial Legacy                2

2.2 In order to produce a sustainable Plan for future needs, it is necessary to understand the spatial
legacy of the county. Historically the north of the county was dominated by heavy engineering and
in particular the steel industry in Consett, whilst the south was a centre of manufacturing within the
region with links to the Tees Valley. The south of the county also has a strong railway heritage rooted
in Shildon through the role it played in the birth of the railways. County Durham is a traditional coalfield
area which is underlain with extensive areas of coal. The presence of coal meant the structure of the
economy soon became reliant upon the coal mining industry employing more than 170,000 miners
in 127 collieries at the height of the industry in 1923. The growth of the coal mining industry determined
                                                                                         th
the county’s settlement types resulting in a series of dispersed settlements with 19 century terraced
housing typical of this industrial growth.

2.3 The county's dispersed settlement pattern of towns and villages is therefore a spatial legacy
of the rise and fall of the mining, steel and other heavy industries. This has left us with a built
environment which reflects this industrial past with settlements developed in isolation to house workers
predominantly for the local pit which transformed Durham and its landscape in the 19th Century.
Despite their attractive setting, many of the county’s settlements suffer from high levels of deprivation,
compounded by a range of accessibility and infrastructure issues. Between the early 1800s and 1930s
the population of the county increased almost ten-fold which led to the rapid development of new
communities close to collieries as well as the expansion of existing settlements. Our population has
fluctuated around 500,000 since the early 1900s despite economic conditions changing significantly.
Like many other coalfield areas, the deep mined industry declined in the second half of the 20th
century and the last of the two deep mines closed in 1993 in Easington and Seaham. Coupled with
a decline in steel and other heavy industries this meant a significant decline in the economy and
persistently higher levels of unemployment with the associated problems of social exclusion and
lower levels of spending power.

2.4 This has left us with around 229 settlements dispersed across the county, with even our largest
city and towns being relatively small in population terms. The housing offer in the county reflects
issues of its post-industrial history. Whilst there are some beautiful places to live in the county, with
a mix of traditional, older housing and more modern family accommodation, which are well connected
to labour markets; there remains an oversupply of poorer quality terraced housing and areas of low
demand and poor connectivity.

2.5 Significant regeneration efforts to re-stabilise the county's economy have been met with localised
success and whilst environmental improvements and decontamination of sites has occurred,
interventions such as the Single Regeneration Budget have not overcome the structural issues within
the economy with pockets of deprivation remaining. In response to the closure of major industries,
Government support has brought significant funding such as the regeneration of the steelworks site
in Consett and the Turning the Tide project on the Durham coast, which in turn has influenced
supporting policy and strategy including spatial policy.

2.6 Economic development in the county has been focused, for many years, on attracting industrial
and commercial activity to the most deprived areas of the county or on providing a catalyst to deliver
regeneration activity following industrial decline such as experienced in the mining, railway and steel
industries. This focus has been supported by significant public sector investment and interventions
such as the previous round of Enterprise Zones. However the scale and speed of reductions in public
sector expenditure in recent years and the current constrained funding environment has hit the most
deprived areas hard, making this type of approach much more difficult to deliver.

2.7 The previous approaches to regeneration and economic development did have some localised
success including guiding some development to the more deprived towns and improving housing,
physical environments, providing small business premises, improving housing, social care, and
education. This helped to reduce deprivation and mitigate the significant job losses experienced in
certain areas. However across the county, those areas that were the most deprived several decades

                                                               0000001 Spatial Strategy Justification 7
2      Historical Context and Spatial Legacy

      ago remain those with the most significant economic challenges now, in particular those which have
      poor accessibility to key infrastructure. Securing infrastructure to support the delivery of housing
      across the county is essential to the success of the strategy and bids for infrastructure funding will
      continue.

      2.8 Cuts to public sector budgets and the loss of Regional Development Agencies have meant
      there is less regeneration investment available, but the 2008 banking crisis also hit the county hard
      as banks and investors seek to limit their financial risks and maximise returns, communities across
      County Durham have seen less private investment. As a consequence of this and the growth of the
      Internet and e-commerce, many of our town and village centres have suffered from the loss of shops,
      banks, pubs, and public services. There is also a traditional imbalance within the economy, with the
      private sector being too small. This continued reliance on the public sector presents a risk in the face
      of reductions in public spending.

      2.9 Although qualification levels are improving across the county, residents need to be supported
      in pursuing further qualifications to help us develop a more skilled and educated workforce which will
      attract more innovative and productive businesses. Similarly, local businesses need to be encouraged
      to be more innovative and invest in the development of their products, services and workforce. The
      county's economy is growing, but there is need to bridge the gap with national performance, so
      through its strategies and investments the council is taking a pro-active approach to development to
      attract jobs and investment so that residents have more opportunities and are inspired to be more
      ambitious. The council is also seeking to facilitate better links between business and skills training.

      2.10 The regeneration and development of towns and villages across the county is now a very
      different challenge post local government review. As well as less overall funding available the emphasis
      has shifted from predominantly grant towards loans. The council is therefore less able to take forward
      traditional regeneration schemes with softer outcomes and less tangible returns as a result and has
      less ability to influence the location of new jobs. The public sector approach to investment has now
      shifted so that there is a far stronger focus on achieving financial returns.

      2.11 Previous regeneration programmes have helped set the foundations for future growth in some
      areas; the quality of natural and built environments across the county have particularly benefited.
      One key element of previous approaches is that there was an approach towards localised markets
      and seeking to address specific regeneration objectives. Now the council can take a more strategic
      approach to growth, we can address some of the local imbalances in different parts of the county
      and enable them to develop their economic, cultural, and social roles.

      2.12 The county has seen some successful regeneration in the past but our overall economy is
      the weakest in the North East, itself the poorest performing economy in England. Therefore we need
      a Plan that supports economic growth by facilitating private sector investment and utilising public
      funding where it exists to ensure that the jobs, housing and infrastructure that our existing and future
      residents need is actually delivered.

      2.13 Without a local plan, development including housing, will still happen given the context of a
      growing population and a national housing shortage. The County Durham Plan will therefore give us
      the ability to guide and direct where it goes and what it looks like to ensure the most sustainable
      future for the county's people and businesses.

    8 0000001 Spatial Strategy Justification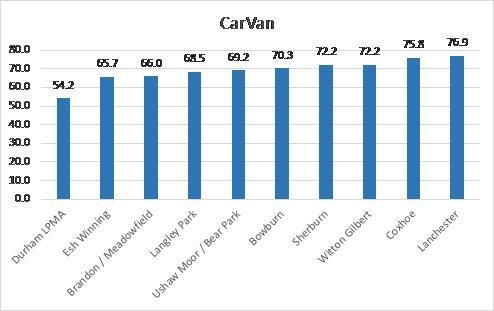
Policy Context          3

3.1 The National Planning Policy Framework (NPPF) requires all councils to produce a local plan
and keep it up to date. Since Local Government Review in 2009 we have been using saved policies
from the existing local plans produced by the previous local authorities. Without an up-to-date local
plan, the council have much less influence over the location of new development and the provision
of infrastructure. As a result sites are being promoted for development in locations that the council
and its communities want to protect and in locations that are unsuitable and unsustainable. Not having
an up to date local plan therefore creates uncertainty and makes it harder to resist inappropriate
development and secure new infrastructure such as schools and health facilities.

3.2 The Government continues to stress the need to build a strong and competitive economy and
to delivery a wide choice of high quality homes and has stated that if councils do not deliver this by
way of a local plan then the Government could potentially intervene in that area. The new local plan
is the opportunity for local communities and stakeholders to plan for how County Durham should
grow and improve.

3.3 The NPPF is clear that the purpose of the planning system 'is to contribute to the achievement
of sustainable development'. In order to do this we need to ensure that 'sufficient land of the right
types is available in the right places and at the right time to support growth'. One of the objectives of
the NPPF is that we should promote sustainable transport by actively managing patterns of growth
to make the fullest possible use of public transport, walking and cycling, and focus significant
development in locations which are or can be made sustainable.

3.4 In a local context the Plan should have regard to the Sustainable Community Strategy (SCS)
which is the overarching strategy for County Durham and is published by the County Durham
Partnership. It sets out our shared long-term vision for the county, our ambitions for the area and the
priorities that partners and communities believe are important. It provides the blueprint to deliver long
lasting improvements and sets the scene for the Plan. Similarly regard will be had to the County
Durham Regeneration Statement which supports the SCS and seeks to create places that are
attractive, well-designed, and well-managed, with good amenities and transport connections, providing
a focal point for business and social interactions.

                                                              0000001 Spatial Strategy Justification 9
4 Issues and Options and Preferred Options
Issues and Options
4.1 The Issues and Options was published for consultation in June 2016 to seek views on the
issues which are affecting the county and potential options for addressing these issues. The Issues
and Options was the first stage in the preparation of the County Durham Plan. The Issues and Options
proposed a draft Vision for the future development of County Durham and proposed four alternative
options for the spatial approach for housing:
A. Main Town Focus - would direct housing to the principal towns in the county, with a large
proportion of new development directed to our largest and most sustainable town, Durham City
(28%). South Durham is shown with 14% of the total predominantly focused around the towns
of Bishop Auckland of Newton Aycliffe reflecting their current scale and economic opportunities.
Mid Durham is shown with 11% which includes the large number of commitments within
Spennymoor. The 14% in East Durham again includes a number of commitments principally in
and around Peterlee and Seaham. The 10% in North West Durham again relates primarily to
the towns of Consett and Stanley. Towns and villages within the other areas receive an amount
of housing to meet their social and economic needs also reflecting the level of existing
commitments in each. As with all of the options there would be an amount of housing allocated
in the county's smaller towns and villages where housing would make them more sustainable.;
B. Sustainable Communities - the emphasis of the Sustainable Communities option is on ensuring
we have a balance of housing across the county. Our existing key employment locations are
Durham City, Newton Aycliffe, Bishop Auckland, Peterlee, Consett and Chester-le-Street which
account for over half of all jobs in the county between them. To continue to develop the economy
of these areas sustainably it is important that housing is provided in the right locations to reflect
demand, land values and to secure affordable housing and necessary infrastructure. As a result
this option directs 17% of the housing to Durham City. However this option also recognises the
benefits of development across the county for example locating 15% of new housing in East
and South Durham, 16% in Mid Durham and 13% in North West Durham.
C. Sustainable Communities with Central Durham Villages - this option is the same as the
Sustainable Communities option except it redistributes a significant proportion of the housing
from Durham City to the rest of the Central Durham villages including Brandon/Langley Moor
Meadowfield, Coxhoe, Langley Park, Sherburn, Ushaw Moor, Lanchester and Esh Winning. The
figure for Durham City is now 7% compared to 17% in the Sustainable Communities option and
that for Central Durham is 21% compared to 12%.
D. Wider Dispersal - This option redistributes the majority of the additional housing from Durham
City or the villages of Central Durham to the rest of the county. This results in 15% of housing
in North Durham principally around Consett and Stanley, 10% in Chester-le-Street and the
surrounding villages, 18% in Mid Durham around Crook, Willington, Spennymoor and Ferryhill,
18% in South Durham principally in Newton Aycliffe, Bishop Auckland and Shildon, a doubling
of the figure for South East Durham, principally in Sedgefield, to 2%, an increase in 5% in West
Durham principally around Barnard Castle and an increase to 16% in East Durham.
4.2 The Issues and Options also sought a view on whether there were any other potential distribution
options which should be considered as being reasonable. The Issues and Options also included
options around levels of housing need and amounts of employment land. Therefore, the housing
distribution options were presented in percentage terms and no specific allocations were identified.
Views were also sought on the where new employment sites should be located to attract investment.
A summary of the main issues raised in the consultation are set out below.
A. Main Town Focus
10 0000001 Spatial Strategy JustificationIssues and Options and Preferred Options 4
Just under 10% of respondents who expressed a preference chose this option.
Would cause traffic chaos and put pressure on local services.
Large areas of the green belt would be built on and it would stifle regeneration in the county as
a whole.
Would deliver more houses as many of the surrounding villages, especially in East Durham,
have a lot of existing houses already on the market that are taking time to sell.
Durham City has the best developed infrastructure and is a key location for employment.
Would cause unacceptable harm to the setting of the World Heritage Site.
Over-concentration at Durham City at the expense of badly needed investment elsewhere in
the county.
Too much housing in the immediate Durham area, not balanced by employment and business
opportunities or a transport system.
Reduces the carbon footprint including congestion on smaller roads and the need to travel.
Helps to maintain village sizes and identities without overwhelming them with unwanted
development.
Would concentrate houses in areas where they are the most desirable.
Most sustainable option in transport terms and therefore reduces the need to travel by private
car.
Will inflate land prices and competition for land, affecting viability.
Will safeguard the long term viability and sustainability of the University.
Will exacerbate existing inequalities across the county.
B. Sustainable Communities
Almost a quarter of respondents who expressed a preference chose this option.
Can help support existing social and community infrastructure, including pubs, particularly in
rural areas.
Looks to be the fairest and most balanced approach.
Is the only sensible option which gives a reasonable distribution for both living and employment
opportunities.
It is important to not just sustain the major towns but have a balance across the county.
Would deliver a balance of housing across the county, taking into account the most sustainable
locations, market attractiveness, where people want to live, and the reality of land values, house
prices and the need for and prospects of regeneration.
Highly sustainable pattern which directly addresses the critical need for employment opportunities
to be near where people already live so that female activity rates can improve.
Would be acceptable only if no deletions of Green Belt are involved.
Will place an unacceptable pressure on Durham City.
Would be more economical, easier to attract investment and infrastructure already exists.
Would help keep carbon footprints to a minimum and reduce overall pollution.
Sustainable Communities is considered to be a misnomer and could be interpreted as property
developers’ PR speak.
Recognises the unique potential for Durham City as a national and internationally recognised
city with employment, culture facilities and good transport links to drive the development of
County Durham as a whole.
If we want to use Durham City as a future commercial centre, we need housing near there.
No evidence that it would provide economic or social resilience.
The existing Durham City Green Belt is geographically restrained so any major increase in
population would have to come from increasing densities that would run contrary to the aesthetic
of the city.
Support the option but with more development in North Durham.
0000001 Spatial Strategy Justification 114 Issues and Options and Preferred Options
Reduces the need to travel by locating homes close to existing facilities and services.
Distributes growth in a sustainable pattern relative to a settlement’s role and function, capacity
to accommodate growth, market attractiveness and sustainability.
Clear need for Durham City, as the most sustainable settlement in the county, to accommodate
suitable levels of growth to meet housing needs and support economic growth.
Recognises the contribution that rural areas can make to the economy.
The distribution of development further from the centres of employment in and around Durham
City and the other main settlements of the North East will lead to longer commuting distances.
Appears to consider the whole county taking into consideration sustainability, market
attractiveness, community desires and viability in respect of housing prices/land value.
Would address the identified supply and demand imbalances and current market pressures
through a focus of development within Durham City but not at the expense of other settlements.
C. Sustainable Communities with Central Durham Villages
Just over 5% of respondents who expressed a preference chose this option.
There has already been too much development in Coxhoe.
Some villages such as Lanchester can not cope with huge housing estates being built because
of parking, flooding and school spaces.
Would require much better cycle routes.
Would ease the pressure on Durham City as it is a centre of historic interest which should be
preserved.
Scope for more beneficial regeneration, however, some of the villages have now reached their
physical limits.
The un-deliverability of this option provides the exceptional circumstances justifying limited
changes to the Green Belt.
Has good access to major roads and is close to future major job sites and would ease the
pressure on the Green Belt.
Would inject much needed money into the villages which would improve the infrastructure and
standard of living.
Most employment would not be in the local villages and people would have to travel to their
place of work causing more traffic.
Bearpark and Ushaw Moor contain a range of shops, services and facilities and have good bus
links into the city centre.
Will result in significantly more travel with its adverse environmental impact.
Will fail to focus on the county’s strongest housing market areas.
Would encourage the development of affordable housing.
Would support the vitality and vibrancy of many more existing settlements.
D. Wider Dispersal
Just over half of respondents who expressed a preference chose this option.
Would give opportunities for development of employment and activity in other parts of the county.
Will have little or no impact on the Green Belt land yet still provide homes in areas that require
regeneration.
Would relieve the traffic pressure on the main centres of population and obviate the need for
major road construction/improvements.
Lower land values in these outlying areas (as opposed to Durham City, Chester Le Street etc)
would lead the building of cheaper, more affordable housing.
Would have no impact on the historic core of Durham City.
Would allow the use of more brownfield land.
12 0000001 Spatial Strategy JustificationIssues and Options and Preferred Options 4
By enhancing local communities you open up the opportunity for small businesses to grow and
prosper.
Dubious about focusing on the wider dispersal as people may not want to reside in the
countryside/rural area.
Housing should be focused around Barnard Castle and Startforth.
Housing should be focused in Consett and Stanley together with economic regeneration.
Is too dispersed and would raise grave concerns over deliverability as well as sustainability.
By minimising the need for significant infrastructure spending, it allows time for changes in
working practices and technology to mature which may then reduce traffic and commuting.
It might help to decrease air/traffic pollution by enabling people to find employment near their
homes.
Places most growth in the south of the county, where there is a desire to grow.
There is significant potential for housing development located close to Durham’s border with
Gateshead to increase levels of outward commuting causing congestion.
Smaller sites spread around the county can be more easily accommodated within the environment.
Will result in significantly more commuting with its adverse environmental impact.
Might result in the regeneration of poor communities across the county.
Enables a move towards truly sustainable transport and greater levels of local sustainability.
Will fail to focus on the county’s strongest housing market areas.
The Durham City proportion should be increased slightly in this option.
Ensures that communities across the county will benefit from future development.
E. None of the above, an Alternative option.
Just over 5% of respondents who expressed a preference chose this option.
Support an amalgam of options b, c and d. This would assist in the regenerative process being
effective in towns and villages currently felt 'left behind' or considered to be 'under-performing'.
None of the options direct enough housing to East Durham.
An option between b and c should be considered as it would reduce the impact on the Green
Belt and would use more brownfield sites.
Merging options a and b would benefit the county whereas c and d are unsustainable given the
location of employment and transport.
Create a new garden city near the Durham coast.
A compromise between options b and c with less Green Belt deletions would be most appropriate.
There should be more development in north and north west Durham.
Create a new town in Central Durham based on one of the existing villages.
New housing should be sited and built with older people in mind.
The distribution to West Durham should be higher.
A combination of a and b will ensure that development is focused on the locations that are best
placed to accommodate growth.
A variation on Main Town Focus but with less in Durham City and more in South Durham.
A new settlement nearer to the A66/A1 between the A1 and the Barnard Castle area.
More housing should be located in:
Lanchester
Sedgefield
Chilton
Great Lumley
Seaham
Wolsingham
0000001 Spatial Strategy Justification 134 Issues and Options and Preferred Options
Newton Aycliffe
Ferryhill
Preferred Options
4.3 In the Preferred Options published in June 2018 the Sustainable Communities option was
identified as the chosen spatial strategy for the Plan however principally as a result of land availability
and additional commitments there was some variation from the detail set out in the Issues and Options
as follows Durham City 15% (-2%), Central Durham 12% (no change), North Durham 7% (no change),
North West Durham 12% (-1%), Mid Durham 16% (no change), South Durham 16% (+1%), South
East Durham 2% (+1%), East Durham 16% (+1%), West Durham 4% (no change). Question 9 asked
for comments on the chosen spatial strategy and a summary of some of the responses received is
shown below:
There was more public support for the Wider Dispersal option so the Sustainable Communities
option should not have been chosen.
General support for the Sustainable Communities option as the most appropriate for County
Durham.
The chosen option will have an unacceptable impact on Durham City.
Previously developed land should be used before greenfield and Green Belt land.
The Sustainable Communities option offers the greatest potential to support sustainable transport.
Houses should be brought back into use before new houses.
Should be a focus on settlements in the key economic corridors.
The Sustainable Communities option offers the greatest opportunity to ensure future sustainable
growth of the county's economy.
Concern over existing infrastructure's capacity to deal with this growth.
The chosen option does not support the viability of rural areas.
The Wider Dispersal option would better for the regeneration of our more deprived areas.
Submission Draft
4.4 Since the Issues and Options consultation and as a result of houses being built, sites being
granted planning permission and assessments of land availability and viability, the percentages for
the Sustainable Communities option have evolved slightly. However the Sustainability Appraisal has
concluded that it is sufficiently similar that it would have the same benefits and advantages. The
distribution is now as follows: Durham City 14% (-3%), Central Durham 12% (no change), North
Durham 8% (+1%), North West Durham 12% (-1%), Mid Durham 16% (no change), South Durham
16% (+1%), South East Durham 2% (+1%), East Durham 16% (+1%), West Durham 4% (no change).
14 0000001 Spatial Strategy JustificationCounty Durham - Where we are now 5
5.1 In order to understand which distribution option is the most sustainable strategy for the county,
it is necessary to understand the current circumstances facing the county.
5.1 Sustainable Patterns of Development
Key Messages
The Settlement Study is a key indicator of a settlement's sustainability and accessibility. It clearly
shows that the county's larger settlements should be the focus for new development including
housing. The scale and range of the services, facilities, culture offer, leisure facilites etc. in
Durham City means it plays a significant role in the chosen spatial strategy for the county.
The existing location of employment opportunities and associated commuting patterns (which
are likely to remain similar in the future) show that in order to maximise access to jobs, to minimise
the increase in commuting and to deliver sustainable patterns of development, the focus for
new housing should be its larger settlements and in particular Durham City.
The data and analysis in this section show that locating new housing in the county's larger
settlements and in particular, Durham City would maximise the opportunity for new residents to
travel to work, and the city's other services and facilities, by sustainable modes of transport when
compared with elsewhere in the county.
Settlement Study
5.2 County Durham has 224,000 households and a dispersed settlement pattern of towns and
(d)
villages. The Settlement Study seeks to provide an understanding of the number and range of
services available within each of the 229 settlements within County Durham. Taking into account
distances including settlement form and severance factors such as roads, rivers and railways, we
have identified a number of settlement 'clusters', each of which function effectively as a single entity.
Identifying the number and range of services and facilities available within a settlement is useful
context to inform decision making both for planning applications and policy formulation. The range
and number of services within a settlement is usually, but not always, proportionate to the size of its
population. The services within a settlement will generally determine a settlement's role and sphere
of influence. This baseline position provides one aspect for considering sustainability and should be
used alongside other relevant, local circumstances. The Settlement Study ranks the county’s
settlements using the following data sources :
Churches
Businesses
Community Centres and Village Halls
Education – Primary Schools
Education – Secondary Schools
Education – University and Colleges
Health Facilities
d https://durhamcc.objective.co.uk/portal/planning/cdpev
0000001 Spatial Strategy Justification 155 County Durham - Where we are now
Leisure Facilities
Play Areas
Police Stations
Post Offices
Shoppinig
Train Stations
Public Transport
Cinemas
Theatres
Museums
Libraries
5.3 Weightings were then applied to the different categories and proximity measured using the 10
minute walking distance (800 metre). Clusters were also used where a group of smaller settlements
act as one larger area. Using this methodology the top 20 highest scoring settlements in the county
were:
Settlement Score
Durham City Cluster 1217.6
Bishop Auckland 732.5
Cluster
Consett Cluster 646.7
Peterlee Cluster 469
Chester-le-Street 452.4
Newton Aycliffe 392.5
Cluster
Seaham Cluster 390.7
Stanley Cluster 346.5
Spennymoor Cluster 328.7
Barnard Castle 276.1
Cluster
Shildon 192.4
16 0000001 Spatial Strategy JustificationCounty Durham - Where we are now 5
Settlement Score
Ferryhill Cluster 187.9
Brandon Cluster 182.7
Crook 181.8
Murton 172.2
Easington Cluster 127.5
Willington Cluster 118.7
Annfield Plain 117.9
Cluster
Sedgefield 117.5
Blackhall Cluster 89.9
5.4 The Settlement Study shows that Durham City has access to more services and facilities then
anywhere else in the county. To give some context to this the city has some of the best sport and
leisure facilities in the county. Freeman’s Quay swimming pool is the busiest swimming pool in the
county operating at 83% of capacity. Durham City has 14 cricket pitches out of 94 (15%) and 76
football pitches out of 611 (12%) across the county. There is also the Gala Theatre which attracts
nationally recognised plays and entertainers and also contains a cinema. Two further cinemas, an
Odeon and an Everyman will also open within the next couple of years. The city also has a thriving
evening economy and has a number of independent and national chain restaurants which will be
significantly added to with the opening of the Gates and Milburngate developments.
5.5 The city is also a significant tourism destination and top visitor attractions include Durham
Cathedral, which is the most visited attraction in the county with 853,034 visitors in 2015 (includes
visitors and worshippers), the World Heritage Visitor Centre had 248,113 visitors in 2015, the Oriental
Museum 61,589 and the Palace Green Library 54,469 visitors.
5.6 University Hospital of North Durham provides a significant level of health services including
urgent care, cardiology, stroke services and maternity, to a large part of County Durham. It also has
one of only two Accident and Emergency (A&E) facilities in the county. To accommodate existing
and future growth in the number of patients an extension to the A&E department has been recently
approved. The city is also well served by GP practices.
5.7 Many of the secondary schools located within Durham City serve a wider catchment area and
have significant numbers of pupils who travel to the schools from surrounding areas, particularly the
villages around the city. For example in the Year 7 2017/18 intake almost 50% of the 267 pupils at
Durham Johnston School come from outside the Durham City cluster. For Belmont School and
Framwellgate School its higher at 57% of 162 pupils and 58% of 182 pupils respectively. The highest
of all is St Leonards where almost 75% of 244 pupils do not live with the Durham City cluster.
5.8 Other settlements that have a good range of services and facilities are; Bishop Auckland, which
also reflects its sub-regional role in the county's retail hierarchy and also has a rail station; Consett
which has a good range of businesses, retailing and a well used theatre; Peterlee that in addition to
the retail provision has a number of good primary schools; Chester-le-Street which has a range of
0000001 Spatial Strategy Justification 175 County Durham - Where we are now
retailing and a station on the East Coast Mainline; and Newton Aycliffe which is major centre for
businesses. Other settlements also have a variety of provision but generally the larger the settlement
the more services and facilities it has.
Conclusion
5.9 The Settlement Study is a key indicator of a settlement's sustainability and accessibility. It
shows that the county's larger settlements should be the focus for new development including housing.
What it also shows is that Durham City has a wide range of services, facilities, culture offer, leisure
facilities etc. It should therefore play a major role in the chosen spatial strategy for the county. However
it is also recognised that other settlements should also be a focus for new development because of
the existing services and facilities they currently have but also to support the provision of new services
and facilities.
Employment and Commuting
5.10 There are a number of locations across the county that are important centres of employment.
Durham City is the county's largest employment centre with 35,582 people (BRES, Lower Super
Output Areas, 2014) working in the city, almost three times the number in the next biggest
centre, and has a county-wide employment draw. Peterlee is the next major employer with 13,749
employees principally based at the North West and South West Industrial Estates. Newton Aycliffe
now has the largest industrial estate by area in the north east and these is reflected in the significant
number of employees, 12,143, in the town. Significant numbers of employees also work in Consett,
Chester-le-Street and Spennymoor. The numbers of jobs then generally reduces as the size of the
settlement decreases.
Number of Employees per Settlement
Settlement Employees
Durham City 35,582
Peterlee 13,749
Newton Aycliffe 12,143
Bishop Auckland 10,332
Consett 9,969
Chester-le-Street 9,193
Spennymoor 6,223
Stanley 4,776
Seaham 4,617
Barnard Castle 4,397
Shildon 2,442
Crook 2,170
18 0000001 Spatial Strategy JustificationCounty Durham - Where we are now 5
5.11 As would be expected there is a clear relationship between the location of employment and
commuting patterns. The table below from 'County Durham Travel Patterns – 2011 Census Data
(e)
Analysis' shows that Durham City attracts over 36,000 ‘in-commuting’ trips every day with a net
commuting figure of nearly 22,000 . The settlement with the next highest is Peterlee with just under
15,000 trips and a net commuting figure of just over 5,100 followed by Newton Aycliffe with just over
11,000 trips and a net commuting figure of just over 1,200. Consett, Chester-le-Street and Seaham
all have negative net commuting figures. When compared across the region, Durham City also has
more in-commuting trips than Sunderland city centre which has 28,000 trips and the Team Valley/Birtley
area which has under 22,000 trips per day. Newcastle is the only employment centre across the
region with more in-commuting trips with 88,000 trips per day.
Settlements Total Total Total Net
Population In-commuting Out-commuting commuting +/-
Durham City 43,200 36, 217 14,399 21,818
Consett 35,226 10,238 13,065 -2827
Peterlee 28,251 14,766 9,623 5143
Newton Aycliffe 25,727 11,371 10,123 1248
Chester-le-Street 24,433 7,308 9,509 -2201
Seaham 24,079 6,304 8,642 -2338
5.12 Although Durham County as a whole produces a greater number of out-commuting trips than
in-commuting, Durham City attracts over twice as many in-commuting trips as it generates
out-commuting journeys (over 36000 and under 14500 respectively)’ demonstrating that it is a
sustainable location.
5.13 The map below which shows Census 2011 Travel to Work data further illustrates the importance
of Durham City in terms of its employment draw and shows that commuters travel to the city from
across the county and beyond.
e https://durhamcc.objective.co.uk/portal/planning/cdpev/
0000001 Spatial Strategy Justification 195 County Durham - Where we are now
County-Wide Employment Draw
5.14 In conclusion, the existing location of employment opportunities and associated commuting
patterns (which are likely to remain similar in the future) show that in order to maximise access to jobs,
to minimise the increase in commuting and to deliver sustainable patterns of development, the focus for
new housing should be its larger settlements and in particular Durham City. This would accord with
the Sustainable Communities or Main Town Focus Options.
Enabling Sustainable Travel Patterns
5.15 The county’s dispersed settlement pattern means that the majority of its residents do not live,
work, shop or spend recreational time all in one place. It’s also a rural county where 68% of residents
regularly use the car to travel to work, either as a driver or passenger. However the county does have
a well developed public transport network including bus and rail and the county council and its partners
seek to encourage walking and cycling wherever possible.
Rail
5.16 Situated on the East Coast Mainline (ECML), Durham rail station is a major asset and performs
a strategic role for the county with 2.6 million people using the station in 2015-16. Passenger numbers
are growing on an annual basis and it is hugely important for business, the visitor economy and the
student population. After Newcastle, Durham (alongside Darlington) is the North East's most used
rail station to:
International gateways such as Newcastle and Manchester airports;
20 0000001 Spatial Strategy JustificationCounty Durham - Where we are now 5
Key employment and financial centres on the ECML such as London, Edinburgh and York; and
Cross Country corridors to urban centres in West Yorkshire, the North West and West Midlands.
5.17 The next most used rail station in the county is at Chester-le-Street which is also situated on
the ECML but with more limited services although it was still used by 223,000 people in 2015/16. The
next busiest is Seaham with 137,000 people using it in 15/16 mainly for local trips on the Durham
Coast Line.
5.18 The graph below shows that across the county around just over 1% of people choose to get
the a train to work. Not surprisingly Durham City is the settlement with the highest figure, nearly
3%. Also as would be expected the only other towns where the proportion of people travelling to work
on bus is higher than the average are Chester-le-Street and Seaham.
Bus
5.19 The county has an extensive bus network. It is generally focussed on the bus station in Durham
City although there are some links between other towns in the county and with the major urban areas
of Tyne and Wear and Tees Valley. Accessibility modelling shows that 247,388 households (70% of
current County Durham households) are within 60 minutes door to door bus travel of Durham City
bus station. The next most accessible locations by bus are Chester-le-Street where 43% of the
county's residents can access it within 60 minutes, Bishop Auckland where it's 41%, Consett with
25% and Peterlee with 26%. Although Chester-Le-Street and Peterlee, had a higher total volume of
residents that could access those individuals settlement within 60 minutes (349,000 and 317,000
households respectively) this is because their catchments include heavily populated areas of Tyne
and Wear.
0000001 Spatial Strategy Justification 215 County Durham - Where we are now
5.20 The graph below shows that across the county around 6% of people choose to get the bus
to work. Of the larger settlements Annfield Plain is the settlement with the highest figure, nearly 9%,
which is probably as a result of low car ownership. Other towns where the proportion of people
travelling to work on bus is higher than the average are Shildon, Seaham, Chester-le-Street, Ferryhill
and Durham City.
5.21 Durham City also has three Park and Ride sites which provide frequent links from outlying
areas of the city to the city centre which helps reduce congestion and pollutants in the city centre.
Walking and Cycling
5.22 The graph below shows that across the county 11% of people choose to walk to work. Barnard
Castle is the settlement with the highest figure, 33%, which is explained by the existence of Glaxo
Smith Kline (GSK) within the town which employs a significant proportion of the town's workforce and
is therefore with easy walking distance of many of its employees. Durham City is next with a figure
of 23%, over double the county average. Other towns where the proportion of people travelling to
work is higher than the average are Peterlee, Shildon, Bishop Auckland and Crook.
22 0000001 Spatial Strategy JustificationCounty Durham - Where we are now 5
5.23 In terms of cycling the county average is 1%. Newton Aycliffe has the highest figure of 3%
due to it being generally flat and having a good cycle network. Barnard Castle is next with just over
2% again explained by the presence of GSK. Durham City is next with twice the county average, the
hilly nature of the city and the large amounts of traffic are the likely the reasons this is not higher.
Other towns with higher than average figures are Peterlee, Shildon and Spennymoor.
0000001 Spatial Strategy Justification 23You can also read