Spatial Analysis of the Chemical Regime of Groundwater in the Karatal Irrigation Massif in South-Eastern Kazakhstan
←
→
Page content transcription
If your browser does not render page correctly, please read the page content below
water
Article
Spatial Analysis of the Chemical Regime of Groundwater in the
Karatal Irrigation Massif in South-Eastern Kazakhstan
Dinara B. Barmakova 1 , Javier Rodrigo-Ilarri 2, * , Vyacheslav A. Zavaley 1 , María-Elena Rodrigo-Clavero 2
and José E. Capilla 2

                                          1   Department of Hydrogeology, Engineering and Oil and Gas Geology, Geology and Oil-Gas Business Institute
                                              named after K. Turyssov. Satbayev University, 22a Satpaev St., Almaty 050013, Kazakhstan;
                                              d.barmakova@stud.satbayev.university (D.B.B.); v_zavaley@mail.ru (V.A.Z.)
                                          2   Instituto de Ingeniería del Agua y del Medio Ambiente (IIAMA), Universitat Politècnica de València (UPV),
                                              Camino de Vera s/n, 46022 Valencia, Spain; marodcla@upv.es (M.-E.R.-C.); jcapilla@upv.es (J.E.C.)
                                          *   Correspondence: jrodrigo@upv.es

                                          Abstract: Understanding the groundwater chemical regime on irrigated lands is relevant for assessing
                                          hydrogeological and reclamation processes. Water chemistry, natural and climatic conditions, and
                                          drainage characteristics define the complex hydrochemical connections which are formed between
                                          irrigation waters, soil, and water of the unsaturated zone and groundwater. This research paper
                                          presents the results of studies of seasonal changes in the chemical composition of groundwater in
                                          the Karatal irrigated massif. A detailed analysis of the salt regime and chemical composition of
                                          groundwater have been performed based on a large number of samples for 2019. Besides, data
                                          related to the Karatal River and drainage waters quality inside the basin have also been analyzed.

                                   Results demonstrate that the salinization processes in the massif are determined by hydrogeological
Citation: Barmakova, D.B.;                conditions and drainage availability. In the north-eastern part of the massif, a high risk of soil
Rodrigo-Ilarri, J.; Zavaley, V.A.;        salinization has been observed as a consequence of all the salinization processes which are determined
Rodrigo-Clavero, M.-E.; Capilla, J.E.     by its hydrogeological conditions and drainage availability. Data analysis over soil samples and
Spatial Analysis of the Chemical          irrigation and drainage waters show that the hydrochemical regime of groundwater on Karatal
Regime of Groundwater in the              irrigation massif is influenced by the presence of saline soil-forming rocks, the groundwater depth,
Karatal Irrigation Massif in
                                          the volume, and the quality of irrigation waters, the characteristics of the natural drainage, and
South-Eastern Kazakhstan. Water
                                          evaporation processes.
2022, 14, 285. https://doi.org/
10.3390/w14030285
                                          Keywords: groundwater; irrigated land; salinity; chemical composition
Academic Editors: Francesco Sdao
and Filomena Canora

Received: 24 November 2021
Accepted: 15 January 2022
                                          1. Introduction
Published: 19 January 2022                      Increasing salt concentrations is one of the most common environmental and reclama-
                                          tion problems in irrigated agriculture [1–3]. Due to the variability of water management
Publisher’s Note: MDPI stays neutral
                                          and economic conditions on irrigation systems, groundwater levels and geochemistry
with regard to jurisdictional claims in
published maps and institutional affil-
                                          transformations occur [4]. These changes have an impact on the reclamation state, which
iations.
                                          determines the productivity of the irrigated lands. The knowledge of the groundwater
                                          chemical regime is critical for assessing the reclamation status of irrigated land. Groundwa-
                                          ter chemical composition depends on: (i) the irrigation water quality; (ii) the water supply
                                          volume; (iii) the climatic and hydrogeological conditions; (iv) the lithological composition
Copyright: © 2022 by the authors.         of the aeration zone and (v) the drainage characteristics of the territory [5–9].
Licensee MDPI, Basel, Switzerland.              Hydrogeological conditions play an important role in the formation of all processes of
This article is an open access article    salt and water exchange on irrigated lands. Some recent studies describe that irrigation with
distributed under the terms and           superficial water induces a salinity increase in groundwater [10,11]. However, other studies
conditions of the Creative Commons        show that this type of irrigation reduces the salinization impacts over the aquifer [12,13].
Attribution (CC BY) license (https://     So, groundwater levels and soil geochemistry are closely interrelated with the soil cover
creativecommons.org/licenses/by/          characteristics and the irrigation conditions. Despite water resources being very limited
4.0/).

Water 2022, 14, 285. https://doi.org/10.3390/w14030285                                                         https://www.mdpi.com/journal/water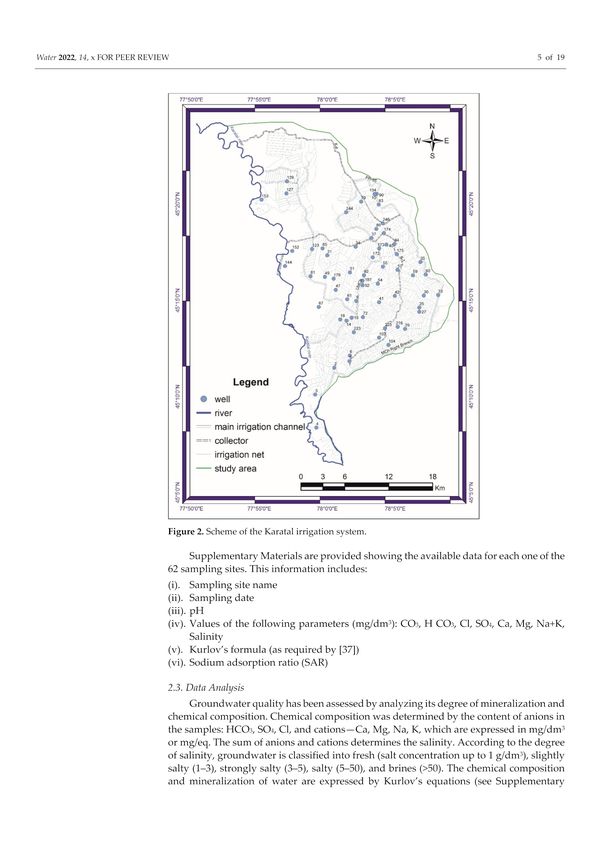
Water 2022, 14, 285                                                                                             2 of 18

                      in arid regions, groundwater quality is determined by its interaction with rocks and soil
                      profiles [14].
                            Groundwater, depending on its depth and degree of mineralization, drainage condi-
                      tions, lithological features, and other factors, represents the main source of salinization of
                      the upper soil cover. Therefore, the study of the groundwater regime on irrigated lands,
                      the identification of all factors influencing them, the determination of the conditions of
                      formation by type of regime, and the spatial boundaries of the impact should be given
                      important importance [15–17]. Based on these data, it is possible to predict changes in
                      hydrogeological and meliorative conditions, develop projects to improve the condition of
                      irrigated lands, and engineering and ecological reconstruction of irrigation systems.
                            Monitoring of irrigated lands is a system of stationary observations of the reclamation
                      condition of irrigated lands, carried out in order to timely identify changes occurring
                      on them, assess and make recommendations for improving and rational use of irrigated
                      lands. Efficient and well-managed irrigation water practice including quantifying the
                      groundwater table depth and monitoring water quality is of utmost importance for decision-
                      makers, growers, and experts [18]. Indicators of the reclamation state of irrigated lands
                      are: (i) hydrogeological conditions (level, mineralization, and chemical composition of
                      groundwater); (ii) salinity and degree of salinity of soils; (iii) engineering and geological
                      processes (subsidence, overexposure, irrigation erosion).
                            Monitoring irrigated lands allow assessing and forecasting their reclamation condi-
                      tions, identifying the causes of their deterioration as well as changes in the territories in the
                      zone of direct influence of irrigation.
                            The reclamation state of irrigated lands determines the state of the system: soils, soils
                      of the aeration zone, groundwater formed as a result of soil development, hydrogeological
                      and engineering-geological processes under the influence of various reclamation measures
                      and characterizing the degree of suitability of land for agricultural production [16]. The
                      content of chemical elements such as Cl, Na, as well as pH and mineralization indicators
                      do not affect the use of land at certain stages but can affect the productivity of land [19–21].
                      Lime can be used to increase soil pH, reducing trace element mobility and bioavailability
                      (like Cd, Co, Cu, Ni, Pb, Sb, and Zn) due to enhanced adsorption and/or precipitation [22].
                      Liming enhances the physical, chemical, and biological properties of soil through its direct
                      effect on the amelioration of soil acidity and its indirect effect on the mobilization of some
                      of the major and trace element nutrients, immobilization of toxic metals, and improvements
                      in soil structure and hydraulic conductivity [23].
                            The impact of agricultural practices on water quality has always been studied primar-
                      ily with an emphasis on surface waters. Groundwater is more difficult to study. However,
                      the impact on ground and surface waters is equally important. In non-irrigated areas, agri-
                      culture often leads to an increase in recharge, which sometimes leads to the leaching of salts
                      from the unsaturated zone into groundwater. In irrigated areas, groundwater salinization
                      may be the result of salty water irrigation, salt movement down in an unsaturated zone of
                      salt dissolution, as well as salt accumulation due to water uptake by plants.
                            The processes of redistribution of elements occur in the soil aeration zone. Rising
                      groundwater levels and salinity are considered to be the main cause of secondary saliniza-
                      tion of irrigated lands [24,25]. To date, 210,400 hectares of the Almaty region in Kazakhstan
                      are saline to varying degrees which is 36% of the available irrigated area. The deterioration
                      of the reclamation status of rice irrigation systems as a result of changes in irrigation and
                      economic conditions is a matter of great concern [26–28]. Methods for monitoring the
                      groundwater quality parameters and chemical element immigration are effective if there is
                      a high-quality source and regularly updated material in the database [19,29]. The use of
                      spatial analysis techniques significantly simplified the assessment of the hydrogeological
                      and reclamation state [30]. Groundwater studies are used to analyze site suitability, manage
                      available data and resources, assess soil vulnerability to salinization, model groundwater
                      runoff, solute transport, and leaching [31,32]. The results of this analysis are necessary for
                      creating systems to support spatial solutions using GIS [33,34]. Thus, in order to identify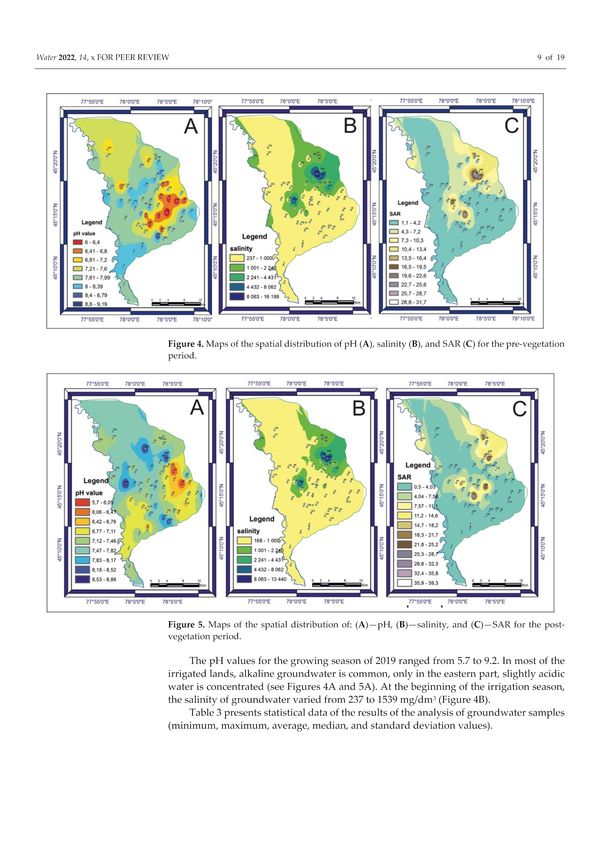
Water 2022, 14, 285                                                                                            3 of 18

                      the salinity distribution area, mapping of surface and groundwater quality was required.
                      The quality of groundwater depends on the evolution over time of various parameters, such
                      as pH, salinity, Ca, Mg, or Cl [35]. The map is often compiled using the inverse distance
                      weighting (IDW) method. Much of the research and development related to Earth sciences
                      has been done using spatial technologies. GIS software is an effective tool in mapping
                      the chemical composition of groundwater and is important for monitoring and managing
                      hydrogeological and reclamation processes [19,29,33,36].
                           Under this working scope, the objective of this research is to describe and understand
                      the chemical regime of groundwater in the Karatal irrigation massif.

                      2. Materials and Methods
                      2.1. Description of the Study Area
                           The study area is located on the territory of the Karatal district of the Almaty region
                      of the Republic of Kazakhstan (77◦ 53’1700 east longitude and 45◦ 23’2600 north latitude,
                      78◦ 00’4000 east longitude and 45◦ 06’4600 north latitude). The irrigation system is located in
                      the Karatal River valley, in the eastern marginal part of the South Balkhash depression. The
                      massif stretches along the Karatal River for 20 km and is about 12 km wide (Figure 1).

                      Figure 1. Location of the Karatal irrigation massif inside the Republic of Kazakhstan.

                           The climate in the study area is sharply continental, characterized by severe winters,
                      hot summers, and short springs and autumns. In 2019, the climatic conditions of the region
                      during the growing season were characterized by a dry and hot summer. The maximum
                      average monthly air temperature was observed in July (26.9 ◦ C). The coldest month was
                      December (−9.3 ◦ C). The sum of active temperatures (the sum of the average daily air
                      temperatures above +15 ◦ C) for the period May-August was 2755 ◦ C.
                           The total area of irrigated land was 11,845 ha. The terrain is calm, the slope does not
                      exceed 0.001 m/m and decreases in a north-westerly direction. The absolute elevation of the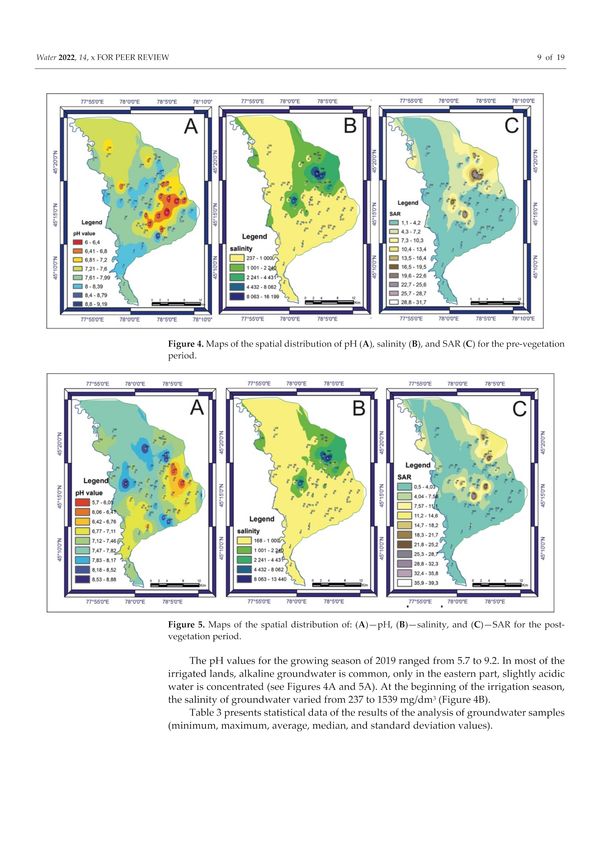
Water 2022, 14, 285                                                                                            4 of 18

                      terrain surface varies from 435 to 417 m. Soils are characterized as light chestnut gray soils,
                      composed mainly of sandy loam, slightly saline. Soda-sulfate by anions, calcium-sodium
                      by cations type of salinity chemistry is common in the eastern and northeastern parts of
                      the massif. Here, the salt content in the soil horizon is higher than 0.6%. In the area of the
                      PR-35 system (well 246), soils with chloride-sulfate magnesium-sodium with a salt content
                      of 0.6% were identified. Well 179 is located on lands with sulfate sodium-calcium chemistry,
                      where the salt content reaches 0.6%. In the northern and southeastern parts of the massif,
                      soils are salted with medium sulfate by anions and a type of chemistry mixed by cations.
                      On these soils, salt content varies from 0.3 to 0.5%.
                            On the territory of the massif, underlying rocks are alluvial deposits of the Quaternary
                      age, represented by alternating layers of loam, sand, and sandy loam. The thickness of
                      the cover deposits varies from 0.5 to 6 m and filtration coefficients from 0.02 to 0.3 m/day.
                      The water-bearing rocks of the upper water-saturated stratum include sandy loam, loam,
                      powdery and clay fine-grained sands, and lower-gravel-pebbles with sandy or sandy
                      loam aggregates.
                            Land use has significantly changed in recent years due to market demands, subsidies,
                      etc. The irrigated area is used entirely for agricultural crops. The water management
                      conditions of the district, due to the physical wear and tear of irrigation channels and
                      structures and the insufficient volume of repair and restoration work, are characterized as
                      unsatisfactory. For these reasons, the destruction of the main structures of the structures,
                      siltation, and overgrowth of weeds of the channels occur. The existing on-farm irrigation
                      and collector-drainage channels are unattended and repair work is practically not carried
                      out on them. All this leads to violations of the operating conditions of the irrigation system.
                            The research work described below was carried out in 2019 and included (i) observa-
                      tions of the chemical regime of groundwater in fields with rice crops and dry crops; (ii) deter-
                      mining the location of areas with the spread of brackish groundwater and (iii) determining
                      the water quality in the Karatal River at the site of water intake and after mixing with
                      collector and drainage waters.

                      2.2. Data Collection
                           Observations of the mineralization and chemical composition of groundwater were
                      carried out by sampling water from 10 m deep observation wells following the requirements
                      established by the monitoring rules of evaluation of irrigated lands in force at the Republic
                      oz Kazakhstan [37]. The data collection process on the irrigated lands of the Karatal
                      massif was done by the Zonal Hydrogeological and Reclamation Center of the Ministry of
                      Agriculture of the Republic of Kazakhstan.
                           This process was done two times, in spring and autumn of 2019. Groundwater samples
                      were taken from the existing 62 observation wells, irrigation wells located at the entrance
                      to the massif in its southern part, and at the discharge point of the idle K-4 collector in the
                      northern part (Figure 2).
                           Supplementary Materials are provided showing the available data for each one of the
                      62 sampling sites. This information includes:
                      (i).  Sampling site name
                      (ii). Sampling date
                      (iii).pH
                      (iv). Values of the following parameters (mg/dm3 ): CO3 , H CO3 , Cl, SO4 , Ca, Mg, Na+K,
                            Salinity
                      (v). Kurlov’s formula (as required by [37])
                      (vi). Sodium adsorption ratio (SAR)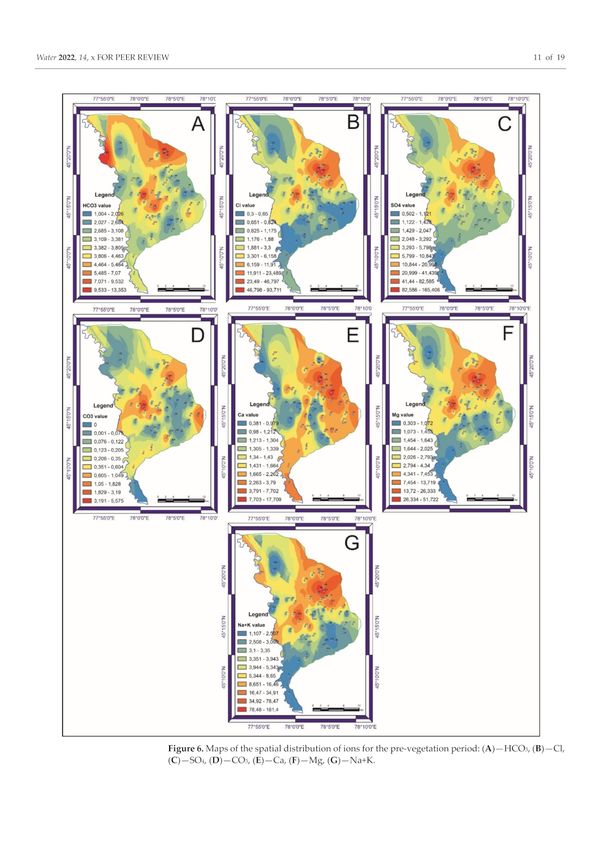
Water 2022, 14, 285                                                                                            5 of 18

                      Figure 2. Scheme of the Karatal irrigation system.

                      2.3. Data Analysis
                           Groundwater quality has been assessed by analyzing its degree of mineralization and
                      chemical composition. Chemical composition was determined by the content of anions in
                      the samples: HCO3 , SO4 , Cl, and cations—Ca, Mg, Na, K, which are expressed in mg/dm3
                      or mg/eq. The sum of anions and cations determines the salinity. According to the degree
                      of salinity, groundwater is classified into fresh (salt concentration up to 1 g/dm3 ), slightly
                      salty (1–3), strongly salty (3–5), salty (5–50), and brines (>50). The chemical composition and
                      mineralization of water are expressed by Kurlov’s equations (see Supplementary Materials).
                      According to this formula, the chemical type of water is determined by the predominant
                      anions and cations. The type of water is set at the beginning according to the content of
                      anions, and then cations in descending order. If the content of components is less than 10%,
                      they do not participate in determining the type of water [37].
                           There are two main groups in surface and underground waters: macro- and micro-
                      components. Macro components are determined by the predominant cations and anions.
                      Their content in water determines the amount of dry residue, specific gravity, and the
                      nature of the physical properties of water. For the general characteristics of the composition
                      and properties of water, an abbreviated chemical analysis of water has been performed.
                           When conducting water laboratory tests, the requirements for the types of analyses
                      performed and the applicable regulatory documents are observed. The types of analyses
                      and current standards for determining the chemical composition of natural waters in the
                      Republic of Kazakhstan are shown in Table 1.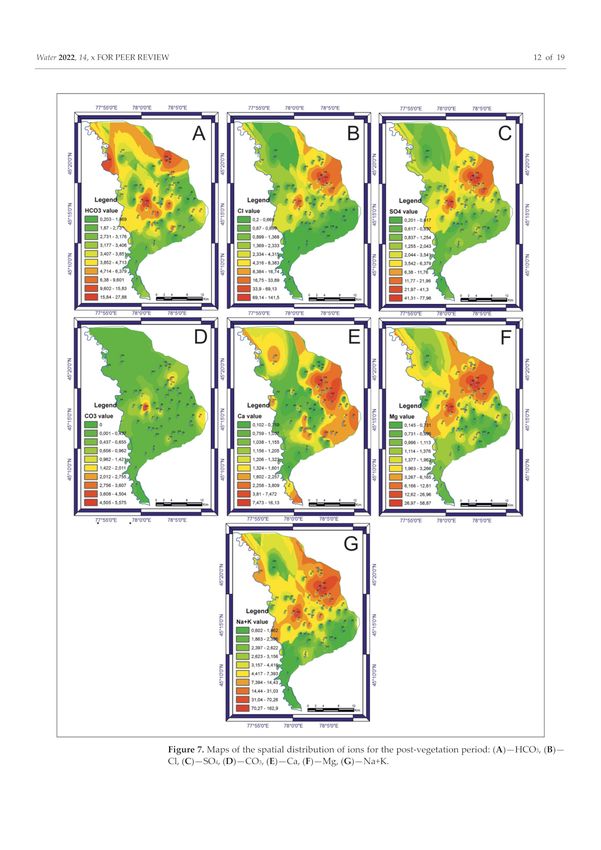
Water 2022, 14, 285                                                                                                  6 of 18

                      Table 1. Types of analyses and current standards for determining the chemical composition of natural
                      waters (surface and groundwater) in the Republic of Kazakhstan.

                                      Types of Analyses                           Current Kazakh State Standard
                       Abbreviated chemical analysis (pH,   Cl− ,
                       SO4 2− , HCO3 − , NO3 − , CO3 2− , Ca2+ , Mg2+ ,
                       Na+ , K+ , CO3 2− , H2 CO3 )
                       Sodium ion (Na+ )                                              GOST 26449.1-85, i. 7.
                       Calcium ion (Ca2+ ) and Magnesium ion(Mg2+ )                   GOST 26449.1-85, i. 11.
                       Potassium ion (K+ )                                            GOST 26449.1-85, i. 12.
                       Sulfate ion (SO4 2− )                                          GOST 26449.1-85, i. 9.
                       Chlorine ion (Cl− )                                            GOST 26449.1-85, i. 13.
                       Bicarbonate (HCO3 − )                                          GOST 26449.1-85, i. 18.
                       Alkalinity pH                                                  GOST 26449.1-85, i. 17.

                           The value of the Sodium adsorption ratio (SAR) of groundwater to evaluate the
                      possible salinization of soil in contact with these waters was calculated according to:

                                                                    1.41 Na
                                                             SAR = p
                                                                     Ca + Mg

                           The assessment of water quality by the SAR value is given in Table 2.

                      Table 2. Assessment of water quality by SAR value.

                       Total Water Salinity          Hazard                Hazard of Soil Salinization by SAR Value
                             (g/dm3 )          of Soil Salinization        Low       Average      High          Very High
                                26
                                1–2                   Average               6–8       12–15       18–22           >22
                                2–3                    High                 4–6        9–12       14–18           >18
                                >3                   Very high             2–4         6–9        11–14           >14

                           Due to the large number of variables, the data analysis was based on a geostatistical
                      analysis method. Results of the water analysis were processed and interpreted through
                      cartographic methods. Spatial maps of pH, SAR, and mineralization, as well as maps
                      of the concentration distributions of each ion in groundwater, were obtained using the
                      IDW interpolation method implemented inside the ArcGIS software. This interpolation
                      method is based on the assumption that the values that are closer to each other are more
                      similar than those that are located further away. The measured values surrounding the
                      unmeasured location were used for prediction. As mentioned above, mapping helped to
                      understand field information but it was not enough to take into account all the influencing
                      factors. Once data were displayed on a map a quantitative study was performed to
                      establish correlations between the parameters leading to a better understanding of the
                      chemical regime of groundwater in the study area. The zonal statistical tool was used for
                      calculating areas with different groundwater mineralization and calculations were made
                      according to the accepted gradation. Previously, it was necessary to apply a layer of farm
                      boundaries on the constructed map, within which the spatial calculation of the area should
                      be made. The Spatial Analyst tools were the main ones used in creating the maps. Therefore,
                      spatially integrated data and analytical tools were used to assess the hydrogeological and
                      reclamation status of irrigated land. Results obtained from the analysis were compared
                      with the actual Kazakh normative data of monitoring irrigated lands.

                      3. Results and Discussion
                           The generated spatial and attribute databases are integrated to create maps of spatial
                      variations of the main chemical parameters. Groundwater quality maps are shown in the
                      figures below to visualize the spatial distribution of maximum ion concentrations.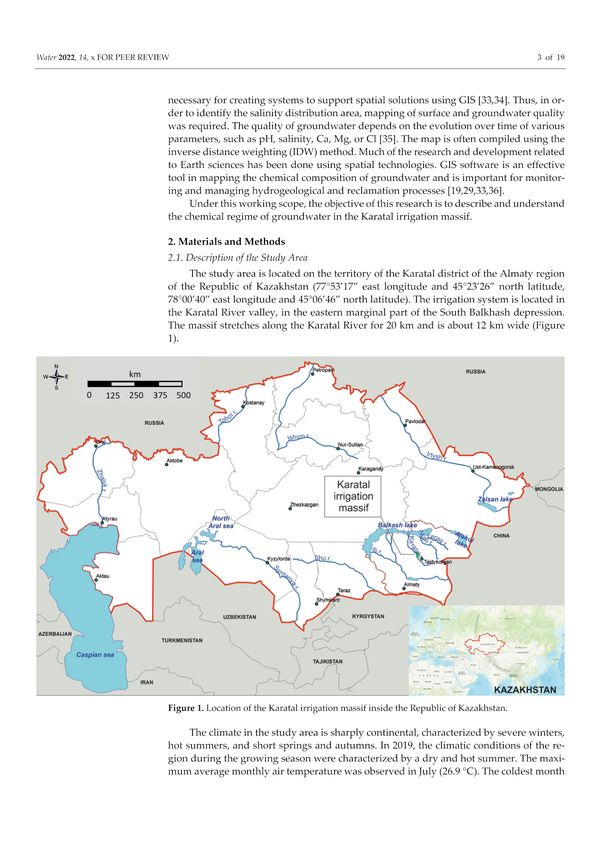
Water 2022, 14, 285                                                                                                 7 of 18

                           The generation of groundwater quality maps helps to understand the current state of
                      groundwater in the area and to assess the hydrochemical regime as well as to visualize the
                      trend of salt accumulation processes [38].

                      3.1. Surface Water Quality
                           Results of laboratory analyses show that the water used for irrigation of agricultural
                      crops is fresh and suitable for irrigation. During the growing season, the salinity of
                      irrigation water varied up to 424 mg/dm3 . The chemical composition of these waters is
                      bicarbonate-sulfate sodium-calcium. The SAR index did not exceed 3.4, which indicates a
                      low risk of soil salinization.
                           The salinity of the Karatal River water after mixing with the K-1 collector-drainage
                      waters varied from 293 mg/dm3 to 424 mg/dm3 during the entire vegetation period. It
                      should be noted that the collector-drainage waters currently entering the river do not lead
                      to a deterioration in the quality of the river water.
                           The salinity of reservoir and drainage waters in the K-1 reservoir at the beginning of
                      the growing season varied from 711 mg/dm3 to 725 mg/dm3 . In August, the mineralization
                      decreased to 677 mg/dm3 . After the water supply was stopped in September, the salt
                      content in the collector-drainage waters decreased to 429 mg/dm3 , and in October, when
                      the intensive removal of salts from the soils of the aeration zone occurred with a decrease in
                      the groundwater levels, the salinity of the collector-drainage waters reached 1370 mg/dm3 .
                      The chemical composition of the water is bicarbonate-sulfate calcium-sodium. The SAR
                      index did not exceed 8.0 during the entire observation period.
                           Figure 3 shows the dynamics of salinity of the irrigation and collector-drainage waters
                      and the average salinity of groundwater over a five-year period. The calculation did not
                      take into account samples of wells 86, 174, 175, 179 which are located in areas with saline
                      soils and insufficiently provided with drainage in the north-eastern and central parts of
                      the massif.

                      Figure 3. Dynamics of salinity of irrigation and collector-drainage waters and average salinity of GW
                      in the Karatal irrigation massif for 2015–2019, mg/dm3 .

                           Salt content observations in the Karatal River showed that the salinity of the river
                      water at the beginning of the growing season is low. This effect is related to the amount of
                      precipitation during this period. In the K-1 collector, there is a decrease in the mineralization
                      of collector-drainage waters by the end of the growing season due to the flushing mode
                      during irrigation.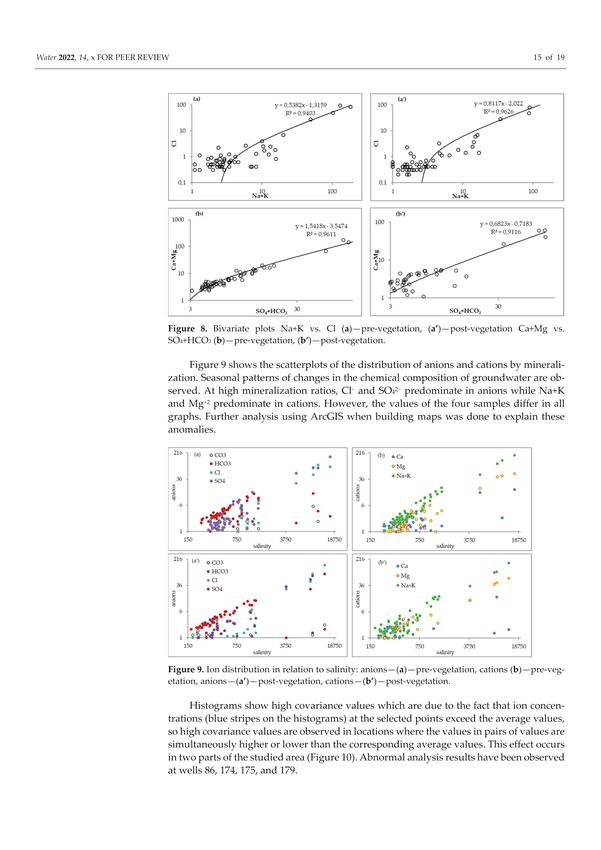
Water 2022, 14, 285                                                                                                   8 of 18

                      3.2. Groundwater Quality and Chemistry
                           According to the hydrogeological conditions on the massif, the groundwater regime
                      completely depends on agricultural and water management factors. Groundwater lies at a
                      depth higher than 1.5 m. With the water supply to the fields, there is a widespread rise of
                      the groundwater table, being the highest rate in May and the first days of June. After the
                      end of the irrigation season and the discharge of water from rice checks, there is a decline
                      in the groundwater levels, which continues throughout the inter-vegetation period. In the
                      spring period, the groundwater levels are below 3 m. This indicates favorable conditions
                      for the passage of redox processes in the soils of the aeration zone.
                           The qualitative characteristics of groundwater in the study area are shown in
                      Figures 4 and 5.

                      Figure 4. Maps of the spatial distribution of pH (A), salinity (B), and SAR (C) for the pre-vegetation
                      period.

                      Figure 5. Maps of the spatial distribution of: (A)—pH, (B)—salinity, and (C)—SAR for the post-
                      vegetation period.
Water 2022, 14, 285                                                                                             9 of 18

                           The pH values for the growing season of 2019 ranged from 5.7 to 9.2. In most of the
                      irrigated lands, alkaline groundwater is common, only in the eastern part, slightly acidic
                      water is concentrated (see Figures 4A and 5A). At the beginning of the irrigation season,
                      the salinity of groundwater varied from 237 to 1539 mg/dm3 (Figure 4B).
                           Table 3 presents statistical data of the results of the analysis of groundwater samples
                      (minimum, maximum, average, median, and standard deviation values).

                      Table 3. Summary statistics for concentrations of chemical components.

                                         Min          Max         Average      Median       Standard Deviation
                         mg/dm3
                                                     Numerator (pre-veg.)—Denominator (post-veg.)
                                          0              5.6           0.39             0               0.9
                           CO3
                                          0              2.4          1.02            1.2               0.9
                                          1             13.4           4.09           3.1               2.69
                          HCO3
                                         0.2             28            4.13           2.8               4.22
                                         0.3             95            4.97           0.6              17.02
                            Cl
                                         0.2           143.6           5.62           0.4              21.39
                                         0.5           167.1           8.57           1.8              25.33
                           SO4
                                         0.2             79            4.85           0.8              15.03
                                         0.3            17.9           2.05           1.5               2.72
                           Ca
                                         0.1            16.3          1.68            1.1               2.55
                                         0.3            52.2           4.28           1.5               9.96
                           Mg
                                         0.1            59.7           3.74           0.9              10.33
                                         1.1           183.1          11.68           2.75             30.67
                          Na+K
                                         0.6           165.3           9.41           1.9              25.85
                                          6              9.2           7.57           7.8               0.84
                           pH
                                         5.7             8.9           7.33           7.25              0.67
                                         237          16,354         1210.4          466.5             2679.1
                         salinity
                                         167          13,632         986.19          340.5             2269.8
                                         1.1            31.8           5.14           2.1               7.12
                           SAR
                                         0.5            39.4           5.28          1.85               8.17

                           The representation of the main components for the pre-and post-vegetation periods is
                      shown in Figures 6 and 7.
                           The chemical composition of water with minimal salinity is mainly bicarbonate or
                      bicarbonate-sulfate sodium-calcium or sodium, with a salt concentration of more than
                      500 mg/dm3 , the proportion of sulfates increases (see Figures 4B and 6C). Groundwater
                      with salinity higher than 1000 mg/dm3 has a predominantly bicarbonate sodium chemical
                      composition.
                           The map of the spatial distribution of the main elements on the pre- (Figure 6) and post-
                      vegetation (Figure 7) periods are very similar, which demonstrates the mineralization of
                      groundwater in the massif (Figures 4 and 5). By the end of the growing season, the salinity
                      of groundwater varied from 167 to 1407 mg/dm3 (Figure 5B), with the predominance of
                      bicarbonate, sodium, and calcium ions in the chemical composition. Under rice fields,
                      a decrease in the mineralization of groundwater is characteristic due to dilution and
                      subsequent desalination with irrigation water [17,39].
                           In fields with rice crops (wells 4, 104, 25, 27, 52, 92, 79) groundwater salinity decreased
                      from 323–1051 mg/dm3 in April to 242–670 mg/dm3 in August due to the flushing regime.
                      This hydrochemical situation persists almost until the end of the irrigation season. After the
                      termination of irrigation, there is a gradual increase in the mineralization of groundwater,
                      due to the fact that in conditions of still high groundwater standing (from 1 to 2 m),
                      evaporative processes manifest themselves. Their mineralization increases to 1000 mg/dm3 ,
                      and the chemical composition is dominated by sulfates and bicarbonates from anions, and
                      sodium comes first from cations, then magnesium.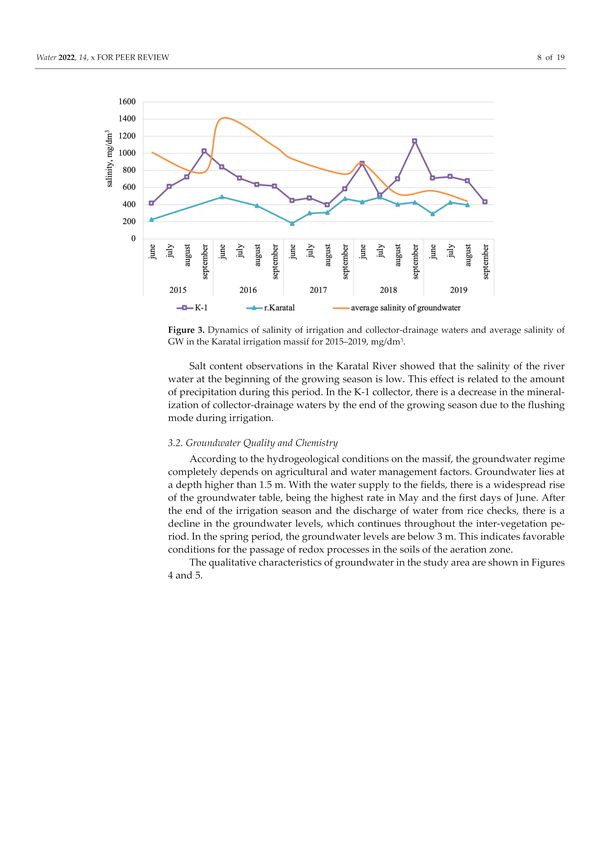
Water 2022, 14, 285                                                                                               10 of 18

                      Figure 6. Maps of the spatial distribution of ions for the pre-vegetation period: (A)—HCO3 , (B)—Cl,
                      (C)—SO4 , (D)—CO3 , (E)—Ca, (F)—Mg, (G)—Na+K.
Water 2022, 14, 285 11 of 18
Figure 7. Maps of the spatial distribution of ions for the post-vegetation period: (A)—HCO3 , (B)—Cl,
(C)—SO4 , (D)—CO3 , (E)—Ca, (F)—Mg, (G)—Na+K.
The enrichment of groundwater with sodium cations is explained by the processes of
ion exchange with soil solutions of rocks of the aeration zone. According to researchers [17,39],Water 2022, 14, 285 12 of 18
when solutions interact with soils, cation exchange most often occurs, as a result of which
the content of sodium bicarbonate increases in groundwater. In the fields occupied by dry
crops, both the accumulation of salts in the groundwater and their decrease is observed,
depending on the degree of salinity of the soil, the drainage of the territory, the amount of
water supply as well as the state of the collector and drainage network.
During the growing season, with a sufficiently close occurrence to the earth’s surface,
the processes of evaporative concentration increase, which leads to a further increase in
their mineralization. At the end of the irrigation season, dissolved salts under the influence
of climatic and biological factors partially crystallize and move to higher horizons, up to
the surface of the earth [15,39,40]. For example, in well 225, the salinity of groundwater
during the season increased from 314 to 699 mg/dm3 , and in well 37, decreased from
1259 to 204 mg/dm3 .
High salinization in wells 86, 174, 175, 179 is caused by the accumulation of salts in
groundwaters due to the dissolution of salts of the soil complex. Here, the mineralization
in April varied in the range of 5334–16,354 mg/dm3 and 3849–13,632 mg/dm3 in August
(see Figures 4B and 5B). The chemical composition is sodium sulfate-chloride or sodium-
magnesium chloride-sulfate. According to the survey data, as well as the comparison of
the land salinity map, salinization processes are manifested here. According to the salinity
patterns in this area, soils with soda and sulfate-soda types are dominated by anions and
sodium-by cations. The weighted average salt content in the upper meter thickness reaches
1% or more.
The state of drainage systems largely determines the nature of the distribution of
the salt in the soil profile. Long-term observations in areas occupied by rice crops show
unsatisfactory drainage where salts during the irrigation period are washed out to a depth
of 50–100 cm. These salts are not removed outside the massif but accumulate in the lower
part of the soil profile.
At the end of the irrigation period, an intensive rise of salts in the surface horizons
begins. The maximum salt content during this period is located at 0–30 cm depth. The
unsatisfactory condition of the collector and drainage networks does not allow for the
removal of drainage water. This leads to an increase in the level of mineralized groundwater,
which is aggravated by high evaporation and, subsequently, to an intensive influx of toxic
salts into the root layer. High mineralization rates in these wells may also be associated
with their location in low terrain areas, where the water exchange process is difficult. In
some locations, abnormal results may also be due to technical difficulties and clogged wells
(well 86).
Under stabilized groundwater regime conditions, the time to restore the initial state
directly depends on the degree of salinity of the soil, its filtration properties, and, to no
lesser extent, on the provision of artificial drainage. The return to the original values usually
occurs in February-March of the following year [15,39].
Assessment of water quality by the SAR value is mandatory when implementing
hydrogeological and reclamation monitoring of irrigated land. The groundwater quality
is assessed by determining the salinization risk degree defined by the SAR index. During
the growing season, the SAR index in groundwater ranged from 0.5–10.2. In wells with
high groundwater salinity, the SAR index varied over the season from 41.3 to 11.9 and from
39.9 to 14.1. These values indicate a high degree of soil salinization (see Figures 4C and 5C).
There is a close relationship between groundwater mineralization and SAR (correlation
coefficient 0.71), which is explained by soda salinization.
3.3. Correlation Analysis of Chemical Parameters
In this study, a correlation analysis between chemical parameters was carried out
to establish the relationships between ions in groundwater. Available data are shown in
Table 4. A high positive correlation has been observed between Cl− and SO4 2− (R > 0.91),
Cl− and Mg2+ (0.96), Na+K and Cl− (>0.97), Mg2+ and SO4 2− (>0.94), SO4 2− and Na+KWater 2022, 14, 285 13 of 18
(>0.96), Mg2+ and Na+K (0.97). Salinity shows a good correlation with Cl− , SO4 2− , Mg+2
and Na+K (0.96–0.99).
Table 4. Correlation between chemical parameters of groundwater.
mg/dm3 CO3 2− HCO3 − Cl− SO4 2− Ca+2 Mg+2 Na+K pH Salinity
Numerator (pre-veg.)—Denominator (post-veg.)
1.000
CO3 2−
1.000
0.665 1.000
HCO3 −
−0.265 1.000
0.526 0.120 1.000
Cl−
0.652 0.106 1.000
0.707 0.090 0.916 1.000
SO4 2−
0.590 0.214 0.951 1.000
−0.287 −0.199 0.569 0.755 1.000
Ca2+
0.123 −0.114 0.430 0.583 1.000
0.707 0.211 0.965 0.948 0.591 1.000
Mg2+
0.601 0.255 0.963 0.982 0.476 1.000
0.657 0.190 0.970 0.977 0.638 0.974 1.000
Na+K
0.661 0.280 0.981 0.962 0.390 0.973 1.000
0.259 0.164 0.136 0.123 −0.009 0.179 0.148 1.000
pH
0.738 −0.006 0.309 0.250 −0.162 0.290 0.313 1.000
0.678 0.189 0.963 0.984 0.673 0.980 0.998 0.148 1.000
salinity
0.630 0.300 0.972 0.983 0.468 0.987 0.994 0.281 1.000
The N+K on the Cl bivariate plot (Figure 8a,a’) is used to demonstrate the origin and
amount of dangerous salt. Unusual high values are noted in the northeastern part of the
massif. High values of Na+K and Cl have been observed as a result of the dissolution of
soil salts during the growing season [41,42]. However, the existing irrigation and economic
problems in this area do not allow them to be taken outside the massif. Therefore, their
ratios change slightly from spring to autumn.
Figure 8. Bivariate plots Na+K vs. Cl (a)—pre-vegetation, (a’)—post-vegetation Ca+Mg vs.
SO4 +HCO3 (b)—pre-vegetation, (b’)—post-vegetation.
The bivariate plot of Ca+Mg versus SO4 +HCO3 (Figure 8b,b’) was used to determine
the ion exchange processes, since the carbonate-calcium and the sulfate-calcium system is
of particular importance in irrigation conditions. This is due to the fact that the processes ofWater 2022, 14, 285 14 of 18
dissolution and precipitation of calcium and gypsum carbonates occur just within the limits
of mineralization observed in pore waters with natural fluctuations in soil moisture and
rocks of the aeration zone and in irrigation groundwater when their reserves change as a
result of infiltration of irrigation waters, evaporation, and transpiration [30]. Figure 8 shows
the predominance of Ca+Mg over SO4 +HCO3 and confirms the process. After infiltration
of irrigation waters and dilution of the upper layer of groundwater, greater dissolution of
Ca occurs (Figure 8b’), which is the main process responsible for the release of Ca+2 .
Figure 9 shows the scatterplots of the distribution of anions and cations by miner-
alization. Seasonal patterns of changes in the chemical composition of groundwater are
observed. At high mineralization ratios, Cl− and SO4 2− predominate in anions while
Na+K and Mg+2 predominate in cations. However, the values of the four samples differ
in all graphs. Further analysis using ArcGIS when building maps was done to explain
these anomalies.
Figure 9. Ion distribution in relation to salinity: anions—(a)—pre-vegetation, cations (b)—pre-
vegetation, anions—(a’)—post-vegetation, cations—(b’)—post-vegetation.
Histograms show high covariance values which are due to the fact that ion concentra-
tions (blue stripes on the histograms) at the selected points exceed the average values, so
high covariance values are observed in locations where the values in pairs of values are
simultaneously higher or lower than the corresponding average values. This effect occurs
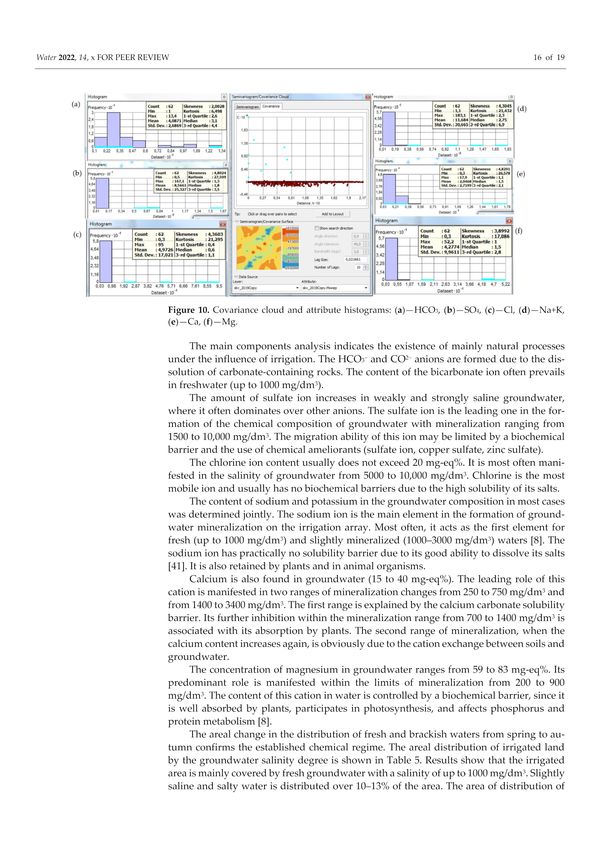
in two parts of the studied area (Figure 10). Abnormal analysis results have been observed
at wells 86, 174, 175, and 179.
The main components analysis indicates the existence of mainly natural processes
under the influence of irrigation. The HCO3 − and CO2− anions are formed due to the
dissolution of carbonate-containing rocks. The content of the bicarbonate ion often prevails
in freshwater (up to 1000 mg/dm3 ).
The amount of sulfate ion increases in weakly and strongly saline groundwater, where
it often dominates over other anions. The sulfate ion is the leading one in the formation
of the chemical composition of groundwater with mineralization ranging from 1500 to
10,000 mg/dm3 . The migration ability of this ion may be limited by a biochemical barrier
and the use of chemical ameliorants (sulfate ion, copper sulfate, zinc sulfate).Water 2022, 14, 285 15 of 18
Figure 10. Covariance cloud and attribute histograms: (a)—HCO3 , (b)—SO4 , (c)—Cl, (d)—Na+K,
(e)—Ca, (f)—Mg.
The chlorine ion content usually does not exceed 20 mg-eq%. It is most often mani-
fested in the salinity of groundwater from 5000 to 10,000 mg/dm3 . Chlorine is the most
mobile ion and usually has no biochemical barriers due to the high solubility of its salts.
The content of sodium and potassium in the groundwater composition in most cases
was determined jointly. The sodium ion is the main element in the formation of groundwa-
ter mineralization on the irrigation array. Most often, it acts as the first element for fresh (up
to 1000 mg/dm3 ) and slightly mineralized (1000–3000 mg/dm3 ) waters [8]. The sodium
ion has practically no solubility barrier due to its good ability to dissolve its salts [41]. It is
also retained by plants and in animal organisms.
Calcium is also found in groundwater (15 to 40 mg-eq%). The leading role of this
cation is manifested in two ranges of mineralization changes from 250 to 750 mg/dm3 and
from 1400 to 3400 mg/dm3 . The first range is explained by the calcium carbonate solubility
barrier. Its further inhibition within the mineralization range from 700 to 1400 mg/dm3
is associated with its absorption by plants. The second range of mineralization, when the
calcium content increases again, is obviously due to the cation exchange between soils
and groundwater.
The concentration of magnesium in groundwater ranges from 59 to 83 mg-eq%. Its
predominant role is manifested within the limits of mineralization from 200 to 900 mg/dm3 .
The content of this cation in water is controlled by a biochemical barrier, since it is well
absorbed by plants, participates in photosynthesis, and affects phosphorus and protein
metabolism [8].
The areal change in the distribution of fresh and brackish waters from spring to
autumn confirms the established chemical regime. The areal distribution of irrigated land
by the groundwater salinity degree is shown in Table 5. Results show that the irrigated area
is mainly covered by fresh groundwater with a salinity of up to 1000 mg/dm3 . Slightly
saline and salty water is distributed over 10–13% of the area. The area of distribution of
slightly saline waters decreased by 414 ha since April, desalinated by diluting them with
fresh irrigation water.Water 2022, 14, 285 16 of 18
Table 5. Distribution of irrigated land areas by the groundwater mineralization degree in the Karatal
massif in 2019.
Water Salinity (mg/dm3 )
Area (ha) Numerator (April)—Denominator (September)
1000
Irrigated area 11,845 10,240 1605
10,654 1191
The maps of the concentration distribution for each chemical element, for all the tested
points, facilitate the visual perception of the existing patterns. Based on the analysis of the
actual material of hydrochemical observations shown in Figures 4–7, the existing relation-
ships are noted. When irrigation begins salt ions are redistributed in the groundwater. The
bicarbonate ions contents (Figures 6A and 7A) and magnesium (Figures 6F and 7F) increase
while sodium (Figures 6G and 7G) and sulfate ion (Figures 6C and 7C) decrease.
4. Conclusions
On cultivated lands, irrigation reclamation has an impact on the chemistry of ground-
water. As a result of such an impact, complex hydrochemical connections are formed
between irrigation waters, soils of the aeration zone, and groundwater. The main factors
that control this process are the chemistry of irrigation water, the natural and climatic
conditions, and the drainage conditions.
Based on a set of multiple observations of the hydrochemical regime of groundwater
in the Karatal massif, a seasonal pattern of changes in the chemical composition of ground-
water has been distinguished. For the actual irrigation type of regime in the massif, the
change in the ion-salt regime of groundwater directly depends on the ratio of the irrigated
and non-irrigated area, the volume of supplied irrigation water, and the drainage capacity
of the drainage systems. Depending on the type of crop, the following seasonal patterns
are observed in the groundwater regime.
Groundwater mineralization has increased in a relatively small area along the K-4
collector on the PR-35 system and in the lower areas between the K-1 and K-4 reservoirs.
The presence of mineralized waters along the collector is facilitated by the fact that the
lands of the PR-33-35 system have not been washed in recent years and a significant excess
of evaporation over soil wettability contributes to a greater accumulation of salts in waters
and soils. The unsatisfactory condition of the drainage network does not compensate for the
increased groundwater supply on the P-27 system between the K-1 and K-4 collector and the
underground inflow associated with the influence of irrigation channels and groundwater
of the surrounding irrigation lands located at higher elevations. This hydrodynamic
influence is transmitted to the groundwater that saturates the sand column, from which
the water is “squeezed” in the form of ascending currents into the groundwater of the
cover loam, which is consumed by evaporation. As a result, salts accumulate in soils and
groundwater and mineralization ratios of up to 500–600 mg/dm3 have been observed in
the immediate vicinity of the channels. Groundwater is chemically similar to irrigation
water (i.e., mainly bicarbonate-sulfate sodium-calcium).
Data obtained from soil samples and irrigation and drainage waters showed that the
formation of the hydrochemical regime of groundwater on irrigated lands is influenced by
the presence of saline soil-forming rocks, the groundwater levels depth, the volume and
quality of irrigation water, and the degree of provision of artificial and natural drainage, as
well as by evaporation processes.
Supplementary Materials: The following supporting information can be downloaded at: https:
//www.mdpi.com/article/10.3390/w14030285/s1, Table S1: The available data for each one of the
62 sampling sites.Water 2022, 14, 285 17 of 18
Author Contributions: Conceptualization, D.B.B. and V.A.Z.; methodology, D.B.B. and V.A.Z.; soft-
ware, D.B.B.; validation, D.B.B. and V.A.Z.; formal analysis, J.R.-I. and M.-E.R.-C.; investigation,
D.B.B. and V.A.Z.; resources, D.B.B. and V.A.Z.; data curation, D.B.B. and J.R.-I.; writing—original
draft preparation, D.B.B., J.R.-I. and M.-E.R.-C.; writing—review and editing, J.R.-I. and M.-E.R.-C.;
visualization, J.R.-I. and M.-E.R.-C.; supervision, V.A.Z. and J.E.C.; project administration, D.B.B.;
funding acquisition, D.B.B., J.R.-I. and M.-E.R.-C. All authors have read and agreed to the published
version of the manuscript.
Funding: This research received no external funding.
Informed Consent Statement: Not applicable.
Data Availability Statement: Data used in this study were obtained from field work performed by
the Zonal Hydrogeological and Reclamation Center of the Ministry of Agriculture of the Republic of
Kazakhstan in 2019.
Conflicts of Interest: The authors declare no conflict of interest.
References
1. Singh, A. Soil salinization management for sustainable development: A review. J. Environ. Manag. 2021, 277, 111383. [CrossRef]
2. Cuevas, J.; Daliakopoulos, I.N.; del Moral, F.; Hueso, J.J.; Tsanis, I.K. A review of soil-improving cropping systems for soil
salinization. Agronomy 2019, 9, 295. [CrossRef]
3. Daliakopoulos, I.N.; Tsanis, I.K.; Koutroulis, A.; Kourgialas, M.N.; Varouchakis, A.E.; Karatzas, G.P.; Ritsema, C.J. The threat of
soil salinity: A European scale review. Sci. Total Environ. 2016, 573, 727–739. [CrossRef] [PubMed]
4. Mao, W.; Zhu, Y.; Wu, J.; Ye, M.; Yang, J. Evaluation of effects of limited irrigation on regional-scale water movement and salt
accumulation in arid agricultural areas. Agric. Water Manag. 2022, 262, 107398. [CrossRef]
5. Zaporozec, A. Graphical Interpretation of Water-Quality Data. Groundwater 1972, 10, 32–43. [CrossRef]
6. Katz, D.M. The Effect of Irrigation on Groundwater; Kolos: Moscow, Russia, 1976.
7. Duyunov, I.K. Land Reclamation in the Conditions of Groundwater Pressure Supply; Kolos: Moscow, Russia, 1978.
8. Gorev, L.N.; Peleshenko, V.I. Meliorative Hydrochemistry; Vishchashkola: Kiev, Ukraine, 1984.
9. Ayers, R.S.; Westcot, D.W. Water Quality for Agriculture. In FAO Irrigation and Drainage Paper; FAO: Rome, Italy, 1985; Volume 29,
p. 176.
10. Rabemanana, V.; Violette, S.; de Marsily, G.; Robain, H.; Deffontaines, B.; Andrieux, P.; Bensimon, M.; Parriaux, A. Origin of the
high variability of water mineral content in the bedrock aquifers of Southern Madagascar. J. Hydrol. 2005, 310, 143–156. [CrossRef]
11. Scanlon, B.R.; Jolly, I.; Sophocleous, M.; Zhang, L. Global impacts of conversions from natural to agricultural ecosystems on water
resources: Quantity versus quality. Water Resour. Res. 2007, 43. [CrossRef]
12. Rotiroti, M.; Bonomi, T.; Sacchi, E.; McArthur, J.M.; Stefania, G.A.; Zanotti, C.; Taviani, S.; Patelli, M.; Nava, V.; Soler, V.; et al. The
effects of irrigation on groundwater quality and quantity in a human-modified hydro-system: The Oglio River basin, Po plain,
northern Italy. Sci. Total Environ. 2019, 672, 342–356. [CrossRef]
13. Jia, H.; Qian, H.; Zheng, L.; Feng, W.; Wang, H.; Gao, Y. Alterations to groundwater chemistry due to modern water transfer for
irrigation over decades. Sci. Total Environ. 2020, 717, 13170. [CrossRef]
14. Shomar, B. Geochemistry of soil and groundwater in arid regions: Qatar as a case study. Groundw. Sustain. Dev. 2015, 1, 33–40.
[CrossRef]
15. Khodjibaev, N.N. Hydrogeological and Meliorative Zoning; Fan Publishing: Tashkent, Uzbekistan, 1975; p. 143.
16. Katz, D.M.; Shestakov, V.M. Meliorative Hydrogeology; MSU: Moscow, Russia, 1981; p. 296.
17. Rau, A.; Bakirov, A.; Anuarbek, K.; Kudasheva, J. Geochemistry of water in rice irrigation systems Akdala. News Natl. Acad. Sci.
Repub. Kazakhstan 2019, 5, 74–81. [CrossRef]
18. Tewabe, D.; Dessie, M.; Asmamaw, D.K.; Tamiru, E.; Adgo, E.; Nyssen, J.; Walraevens, K.; Cornelis, W.M. Comparative analysis of
groundwater conditions on rain-fed and irrigated agriculture in the upper Blue Nile basin, Ethiopia. J. Hydrol. Reg. Stud. 2021, 37,
100916. [CrossRef]
19. Moharir, K.; Pande, C. Spatial analysis of groundwater quality mapping in hard rock area in the Akola and Buldhana districts of
Maharashtra, India. Appl. Water Sci. 2018, 8, 106. [CrossRef]
20. Boyd, C.E. Water Quality, an Introduction; Springer International Publishing: Cham, Switzerland, 2000; p. 323.
21. Schoeller, H. Geochemistry of Groundwater: An International Guide for Research and Practice; UNESCO: India, 1967; Chapter 15;
pp. 1–18.
22. Hale, B.; Evans, L.; Lambert, R. Effects of cement or lime on Cd, Co, Cu, Ni, Pb, Sb and Zn mobility in field-contaminated and
aged soils. J. Hazard. Mater. 2012, 199–200, 119–127. [CrossRef] [PubMed]
23. Bolan, N.S.; Rowarth, J.; Mora, M.L.L.; Adriano, D.; Curtin, D. Biological transformation and bioavailability of nutrient elements
in acid soils as affected by liming. Dev. Soil Sci. 2008, 32, 413–446. [CrossRef]
24. Beecher, H.G. Effect of saline water on rise and soil properties in the Murrumbidgee Valley. Austral. J. Exp. Agr. 1991, 6, 819.
[CrossRef]Water 2022, 14, 285 18 of 18
25. Asch, F.; Dingkuhn, M.; Dorffling, K. Salinity increases CO2 assimilation but reduce growth in field-grown irrigated rice. Plant
Soil 2000, 218, 1–10. [CrossRef]
26. Kitamura, Y.; Yano, T.; Yasuda, S.; Oba, T. Water and salt behavior in an irrigation block under rice-based cropping system in
Central Asia—Research on water management to prevent secondary salinization in Arid Land (II). Trans. Jpn. Soc. Irri. Drain.
Reclam. Eng. 2000, 206, 47–56. [CrossRef]
27. Asch, F.; Wopereis, M.S.C. Responses of field-grown irrigated rice cultivars to varying levels of floodwater salinity under semi-arid
conditions. Field Crops Res. 2001, 70, 127–137. [CrossRef]
28. Rau, A.G. Rice production on saline lands in the Syrdarya basin. In Proceedings of the Water Resources of Central Asia and Their
Use Conference Proceedings, Almaty, Kazakhstan, 22–23 September 2016.
29. Chen, L.; Feng, Q. Geostatistical analysis of temporal and spatial variations in groundwater levels and quality in the Minqin oasis,
Northwest China. Env. Earth Sci. 2013, 70, 1367–1378. [CrossRef]
30. Shakibayev, I.; Barmakova, D.; Yerikuly, Z.; Rau, G.; Kadasheva, Z.; Begmatov, I. Methodology for creating a geoinformation-
analytical system to monitor irrigated lands in the south-east of Kazakhstan. Proc. InterCarto. InterGIS Conf. 2020, 26, 286–293.
[CrossRef]
31. Piper, A.M. A graphic procedure in geochemical interpretation of water analysis. Trans. Am. Geophys. Union 1944, 25, 914–928.
[CrossRef]
32. Fritch, T.G.; McKnigth, C.L.; Yelderman, J.C.; Dworkin, S.I.; Arnold, J.G. A predictive modeling approach to assessing the
groundwater pollution susceptibility of the Paluxy Aquifer, Central Texas, using a Geographic Information System. Environ. Geol.
2000, 39, 1063–1069. [CrossRef]
33. Böhlke, J.K. Groundwater recharge and agricultural contamination. Hydrogeol. J. 2000, 10, 153–179. [CrossRef]
34. Tiwari, K.; Goyal, R.; Sarkar, A. GIS-based spatial distribution of groundwater quality and regional suitability evaluation for
drinking water. Environ. Proc. 2007, 4, 645–662. [CrossRef]
35. Salikova, N.S.; Rodrigo-Ilarri, J.; Alimova, K.K.; Rodrigo-Clavero, M.E. Analysis of the Water Quality of the Ishim River within
the Akmola Region (Kazakhstan) Using Hydrochemical Indicators. Water 2021, 13, 1243. [CrossRef]
36. Honarbakhsh, A.; Azma, A.; Nikseresht, F.; Mousazadeh, M.; Eftekhari, M.; Ostovari, Y. Hydro-chemical assessment and
GIS-mapping of groundwater quality parameters in semi-arid regions. J. Water Supply Res. Technol.-Aqua 2019, 68, 509–522.
[CrossRef]
37. The Rules of State Conduct Monitoring and Evaluation of Ameliorative Condition of Irrigated Lands in the Republic of Kazakhstan
and Information Data Bank on Reclamation of the land for Agricultural Purposes. Approved by the Ministry of Agriculture of
the Republic of Kazakhstan on 25 July 2016. No. 330. Available online: https://adilet.zan.kz/rus/docs/V1600014227 (accessed
on 16 January 2022).
38. Ndoye, S.; Fontaine, C.; Becaye Gaye, C.; Razack, M. Groundwater quality and suitability for different uses in the Saloum Area of
Senegal. Water 2018, 10, 1837. [CrossRef]
39. Averyanov, S.F. Filtration from Channels and Its Influence on the Groundwater Regime//The Influence of irrigation Systems on the
Groundwater Regime; USSR: Kolos, Moscow, 1982.
40. Katz, D.M. The Groundwater Regime of Irrigated Areas and Its Regulation; H UTCHINSON/FAO/UNESC: Moscow, Russia, 1963;
p. 367.
41. Pulido-Bosch, A.; Rigol-Sánchez, J.P.; Vallejos, Á.; Andreu, J.M.; Cerón, J.C.; Molina-Sánchez, L.; Sola, F. Impacts of agricultural
irrigation on groundwater salinity. Environ. Earth Sci. 2018, 77, 197. [CrossRef]
42. Suárez, D.L. Impact of Agricultural Practices on Groundwater Salinity. Agric. Ecosyst. Environ. 1989, 26, 215–227. [CrossRef]You can also read