GIS based framework for artificial aquifer recharge to secure sustainable strategic water reserves in Qatar arid environment peninsula - Nature
←
→
Page content transcription
If your browser does not render page correctly, please read the page content below
www.nature.com/scientificreports

                OPEN              GIS‑based framework for artificial
                                  aquifer recharge to secure
                                  sustainable strategic water
                                  reserves in Qatar arid environment
                                  peninsula
                                  Yasir Elginaid Mohieldeen1, Elnaiem Ali Elobaid2* & Rifaat Abdalla3

                                  This study proposes a large-scale artificial aquifer recharge plan to increase the strategic water reserve
                                  to cope with future emergencies. The main aim of the plan is to restore groundwater levels to those of
                                  the 1980s through artificial recharge. Desalinated water or highly treated municipal sewage effluent
                                  could be artificially recharged into the aquifer to recharge it. Potentiometric surface of aquifers and
                                  Geographic Information Systems (GIS) analysis were used to assess change in the groundwater
                                  levels between 1980 and 2009. Zones that have experienced considerable decline in groundwater
                                  levels from their former “natural” status—when the aquifers were barely exploited, were identified.
                                  These zones are considered optimum recharge sites as they could provide ‘natural’ ground storage
                                  chosen by nature. Therefore, working with nature (not against it) by re-filling these natural spaces is
                                  the optimum approach. The artificial recharge of the main and principal upper aquifer in Qatar (Rus
                                  and Um er Radhuma) is targeted and recommended. It is estimated that up to 182.8 Million Cubic
                                  Meter (mcm) could be recharged and stored in these proposed zones, to increase the strategic water
                                  reserve of the country. This increase would sustain supplies of high quality for up to three months
                                  if consumption is maintained at the 2018 level. Moreover, this additional reserve could last for over
                                  one year, if emergency measures were put in place—in case of serious water-shortages, and disaster
                                  preparedness, for example by reducing the per capita consumption to the global average per capita
                                  consumption.

                                  Qatar strategic water reserves is enough for only seven days, according to official statistics, as most of the Gulf
                                  Council Cooperation (GCC) countries. With very low annual rainfall desertic hyper-arid environment, no surface
                                  water, and depleted groundwater, the country is considered as one of the most water scarce countries in the world.
                                  The country has been relying strongly on desalinated water, for domestic consumption, from the Arabian/Persian
                                  Gulf (simply referred to and hereafter as the Gulf) since the early 2000s. This reliance on desalination makes the
                                  country very vulnerable to disasters in the Gulf that could prevent water intake to the desalination plants. Natural
                                  disasters such as red-tide outbreak, and man-made disasters such as oil-spills are examples of these disasters that
                                  could stop desalination plants in the Gulf for days, possibly months. This vulnerability is exacerbated by the fact
                                  that strategic water reserve in the State of Qatar is enough for only seven days. Seven days is not enough time for
                                  authorities to recover from such disasters. For instance, the 2010 oil spill that took place in the Gulf of Mexico,
                                  took more than one month to clear the oil before the water could be utilized. Another example is the 2008 red-tide
                                  outbreak in the Gulf that lasted for over eight months and forced the closure of the desalination plants in Qatar
                                  and other Gulf countries for weeks. In addition, the fossil fresh groundwater resources in the country have been
                                  exploited heavily during the past few decades, mainly for agricultural purposes. The continuous over-abstraction
                                  has negatively affected groundwater quantity and quality, as consequence of seawater intrusion and the upward
                                  leakage of brackish water. Qatar’s current groundwater would be unusable for human consumption in the event
                                  of water shortage emergency caused by disasters in the Gulf or unexpected failure of the desalination plants.

                                  1
                                   Qatar Environment and Energy Research Institute (QEERI), Hamad Bin Khalifa University (HBKU), Qatar
                                  Foundation, Doha, Qatar. 2Environmental Science Center (ESC), Qatar University, H10‑Zone 3‑B113,
                                  P.O. Box 2713, Doha, Qatar. 3Department of Earth Sciences, College of Science, Sultan Qaboos University, Muscat,
                                  Oman. *email: elnaiem@qu.edu.qa

Scientific Reports |   (2021) 11:18184                | https://doi.org/10.1038/s41598-021-97593-w                                                  1

                                                                                                                                               Vol.:(0123456789)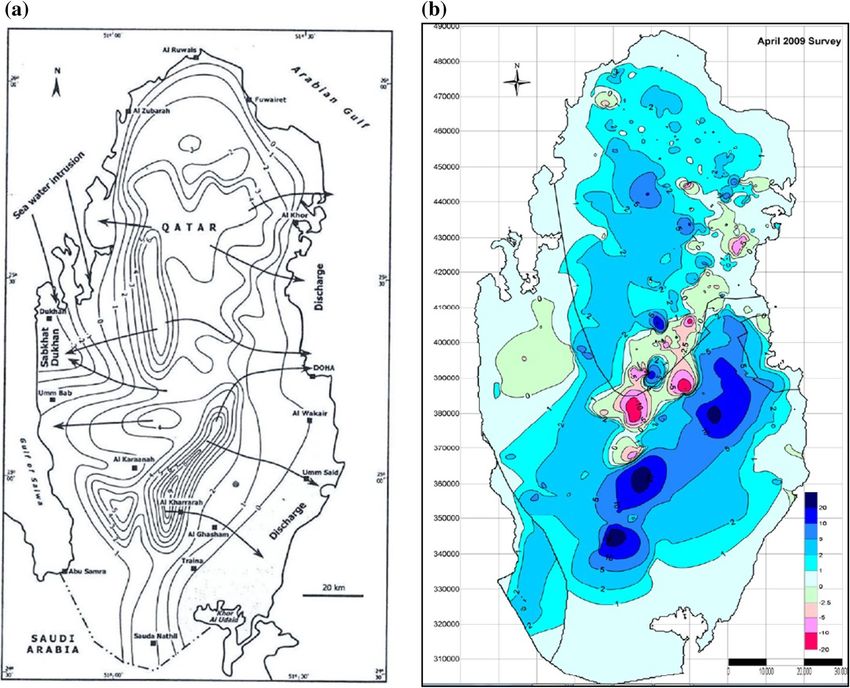
www.nature.com/scientificreports/
Figure 1. Water production in Qatar in mcm/day, 2000–20181,6.
With very low annual rainfall with an average of about 80 mm/year and high rates of evaporation with aver-
age 11.5 mm/day- in summer and 2.5 mm/ day in winter season, Qatar faces severe water scarcity. The average
rainwater endowment of the country, in 2014, was less than 29 cubic meters per year per capita (m3/year/ca),
compared to the global average of 6000 m 3/year/ca, and a water poverty line of 1000 m 3/year/ca1. Nevertheless,
the per capita water consumption of the country is among the highest in the world, reaching more than 800 L per
capita per day, whereas the global average is about 160 L per capita per day2,3. This high per capita consumption
in Qatar is induced by the rapid urbanization and improved living standards since the early 1980s.
The Qatar 30-year water masterplan initiated in 2009 includes major investment in desalination, water infra-
structure and wastewater treatment4. Between 2010 and 2015, the value of water projects reached 5.47 billion
USD4.
The high dependency on seawater desalination in water production puts Qatar at a high risk from major
threats of natural pollution events such as red-tide and harmful algal blooms (HAB), and anthropogenic sources
such as oil spill events in the Gulf that could disrupt water intake at the desalination plants. Furthermore, the
current strategic water reserves in Qatar would only be sufficient for seven d ays1,4. This limited strategic stor-
age capacity renders Qatar vulnerable to major man-made and natural disasters such as oil spills and red-tides
respectively, that might interrupt the operation of the desalination plants or cause them to shut down for a
considerable period of time.
Increasing the strategic water reserve in Qatar is a major concern and priority for the authorities in Qatar.
The General Electricity and Water Corporation (Kahramaa) has conducted studies on how to address this issue.
Adopting the national water saving program (TARSHEED); embarking on the construction of seven-day water
mega scale storage tanks as part of its water strategic plan1,4; and artificial recharge of water attempts are exam-
ples of these efforts.
The geographical scope of the study is the State of Qatar, and its upper principal aquifer (Rus, and Umm
er Radhuma), where changes in groundwater levels between 1980 and 2009 were investigated. Knowing the
magnitude of these changes and their spatial distribution is critical to any aquifer recharge plans. The main
objective is to determine what is needed to replenish/restore the depleted aquifers to their 1980s levels (a time
when the aquifer was hardly used) and use stored water as a natural strategic water reserve to meet water supply
emergencies resulting from natural or man-made disasters. The suitability of the proposed zones was verified
with hydrological, hydrogeological geotechnical experimental fieldwork and tests obtained from a study by
Streetly et al. (1998), since their test sites are in close proximity to the zones proposed in this study, and therefore
representative of these zones. Soil porosity and other geotechnical parameters of these test sites have been used
for water volume calculations.
The study is structured as follows: First, a brief overview of the water resources in Qatar is provided, along
with an overview of the types of disaster that could interrupt water services in the country. Secondly, there follows
a description of the data used in the analysis. Thirdly, the methodology adopted to identify potential groundwater
recharge zones is discussed critically. Finally, there are concluding comments and recommendations.
Groundwater conditions in Qatar
Water supply and demand. The groundwater Conditions in Qatar is very critical, whereas the environ-
ment of Qatar experiences a hyper-arid hot desert climate with very little rainfall. Water desalination from
the Gulf is the main source of freshwater. In 2009, 99.9% of the domestic water, produced by the Qatari water
company (Kahramaa), was desalinated while the rest was from groundwater4. Desalinated water production has
increased fourfold, from 0.44 to 1.48 mcm/day, between 2003 and 2011 (Fig. 1)5. It was reported that seawater
desalination reached 1.9 mcm/day in 20131, and 2.18 mcm/day in 20186.
Scientific Reports | (2021) 11:18184 | https://doi.org/10.1038/s41598-021-97593-w 2
Vol:.(1234567890)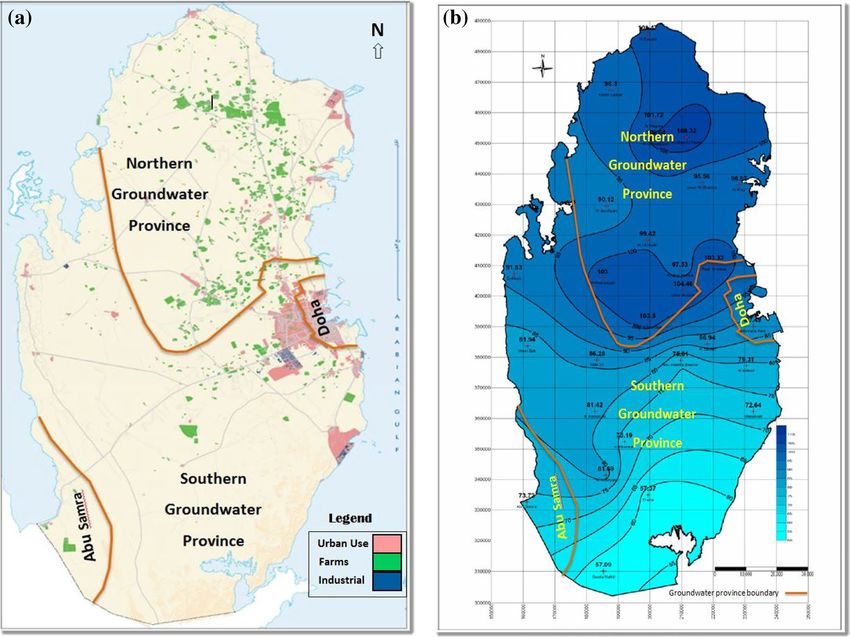
www.nature.com/scientificreports/
Figure 2. (a) Population growth in the State of Qatar during the period 1997–20191,7,8. (b) Qatar GDP in billion
USD, 2000–20189.
Problems and challenges. There are some problems and challenges facing groundwater status in Qatar
Peninsula, such as the rapid socio-economic transformation has taken place in Qatar, over the past few decades,
has resulted in enormous pressure on natural resources especially groundwater resources. This pressure is attrib-
uted to the increased farming activities that the country has pursued to meet the increasing food demand of the
rapidly rising population, and the demand associated with the improved standard of living. The population in
Qatar has increased more than fivefold, from 0.52 Million to 2.83 Million between 1997 and 2 0191,7,8 as shown
in Fig. 2a. The Gross Domestic Product (GDP) of the country has also increased from 17.76 billion USD in 2000
to 192.01 billion USD in 20189, as shown in Fig. 2b. Another reason for the increase in irrigated farming is a
consequence of the high social status enjoyed by those who own farms and gardens.
Scientific Reports | (2021) 11:18184 | https://doi.org/10.1038/s41598-021-97593-w 3
Vol.:(0123456789)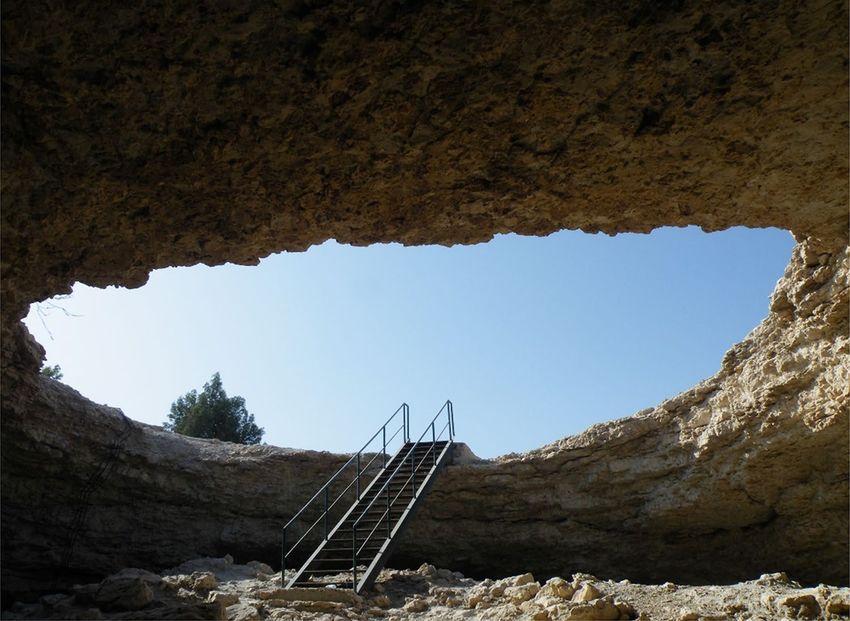
www.nature.com/scientificreports/
Figure 3. (a) Map of broad land use and farms distribution in the State of Qatar in 2012. (Source: Public
Statistics Authority, Qatar http://www.psa.gov.qa)33. (b) Groundwater province boundaries and the distribution
of annual average rainfall in mm during 1989 and 2007. (Source: Ministry of Environment, Technical
Governmental Report Publically Available)21.
The spatial extent of groundwater aquifers in Qatar is sub-divided into two major groundwater provinces: the
Northern and Southern provinces, and two small ones—namely the Doha and Abu Samra basins as in Fig. 3a.
Most of the groundwater abstraction occurs in the farming area within the Northern groundwater province, as
it receives more natural rainfall.
The Northern Province recharge from rainfall is 30% more than that of the Southern province, as shown in
the rainfall map Fig. 3b.
The abstraction of groundwater started to increase year by years since 1975. The continuous and rapid increase
in the number of farms, along with increased number of wells inside these farms, shown in Fig. 4, caused deple-
tion and deterioration of groundwater in-terms of quality and quantity.
Risks and major threats. Oil spill. The fact that Qatar relies heavily on the water desalination from the
Gulf makes the country very vulnerable to pollution events in the Gulf, since it is very shallow10, compared—for
example—with the Gulf of Mexico. As a result, in the case of a major oil spill the concentration of oil in the wa-
ter would be very high and would take a long time to clean up. The 2010 oil spill that took place in the Gulf of
Mexico took thirty-six days to clean up using the advanced equipment available in the USA, despite the different
and more resilient depth and other conditions compared to the Gulf. Oil spills are the major type of disaster that
could interrupt water production from the Gulf. While the Gulf represents only 0.066% of the World’s waters,
more than 40% of the daily oil tankers traffic of the World passes through it11, since the Gulf region is the lead-
ing world exporter. For instance, about 17 billion barrels of oil per day were transported through the Strait of
Hormuz in 2011 and accounting for 20% of the World’s o il12. This dense traffic of tankers in the Gulf makes the
probability of major oil spill disasters very high. Many small to intermediate scale oil spills from oil tankers have
been detected and reported by different agencies using different detection techniques, including remote sensing.
Scientific Reports | (2021) 11:18184 | https://doi.org/10.1038/s41598-021-97593-w 4
Vol:.(1234567890)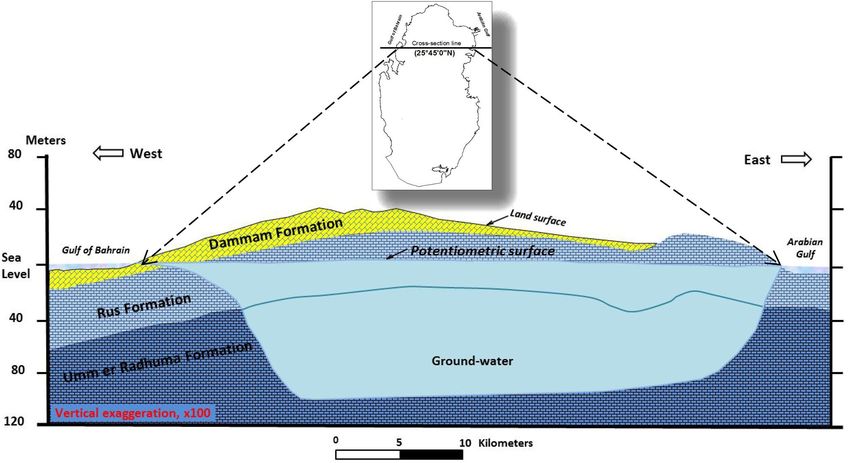
www.nature.com/scientificreports/
Figure 4. Groundwater abstraction & number of wells in the State of Qatar, 1975–200921.
Red‑tide phenomena. Red-tide is formed by the growth of Karenia brevis HAB, which is a microscopic, sin-
gle-celled, photosynthetic organism. In the last few decades red-tide outbreaks have become very frequent in
the Gulf. For instance, major outbreaks in the Gulf occurred during the winter seasons of 2000, 2001, 2006,
2008–200913, and 2010. The 2008–2009 red-tide event lasted for more than eight months, forcing the closure
of desalination plants in Qatar and the region14. Barka desalination plant in Oman, for instance, had to cease
operations for 55 days15. Ironically, the increased temperature of the waters, due to the disposal of hot brine from
desalination plants in the Gulf, is one of main reasons of the outbreak of the red-tides in the Gulf. Many studies
have shed light on this recently developed phenomenon in the Gulf and its impact on desalination plants14,16–18,
and on the environmental impact of desalination plants on marine environment19,20.
Materials and methods
Potentiometric surface of aquifers. Limited groundwater data is one of the main impediments that
hinder the study of aquifer development and modeling in the Middle East. For this study, the only accessible
data were two potentiometric iso-maps for the years 1980 and the 2009 Ministry of the Environment of Qatar
map21,22. These potentiometric maps were produced from data collected through comprehensive surveys and
field measurements. In the 2009 survey conducted by the Ministry of Environment, for instance, more than 8000
wells were identified and used in the analysis.
Description of the geological formations and hydrogeology of the Qatar Peninsula. The geo-
logical formations in Qatar are often described as “tertiary formation” as it is composed of three formations:
Dammam; Rus; and Umm er Radhuma formations. This study focuses on the hydrologically connected Rus and
Umm er Radhuma aquifers that form the “upper principal aquifer” since these are the main freshwater bearing
formations in Q atar23, P. 19. The shallow surficial Dammam aquifer, found in some areas mostly within the coastal
zones such as Doha basin, has limited storage capacity24. Figure 5 shows a hydrogeologic section along latitude
25° 45’23, depicting this Tertiary formation in northern Qatar where most of groundwater e xist23,25.
Rus and Umm er Radhuma Formations in Qatar are unconfined to confined aquifer type24. In the last few-
decades the Dammam and Rus and part of the upper part of Umm er Radhuma (the upper principal aquifer) have
been heavily exploited for agricultural development locally and regionally, causing sharp drop in groundwater
table and lateral and vertical shrinking of the freshwater lenses. 77% of the water abstraction in Qatar is from
the Umm er Radhuma and Rus Aquifer and takes place in the north of the peninsula, whereas the remaining
quantity is abstracted from the Rus aquifer found in the south of the c ountry24.
The two maps used in this study represent potentiometric levels of upper principal aquifer in 1980 and 2009
respectively, are shown in Fig. 6a,b.
Methodology. This section describes how the data have been prepared and processed and discusses the
methods of analysis used to identify recharge sites/zones based on changes in the groundwater levels quantifica-
tion. Data required for the estimation of the potential water volumes that could be used for artificial recharge
is also discussed. ArcGIS software is used in this study, which is licensed to the Qatar Environment and Energy
Research Institute (QEERI), Hamad Bin Khalifa University (HBKU), Qatar Foundation, Doha, the State of Qatar.
Data preparation. The two potentiometric surface maps were digitized and converted from hardcopy to
digital raster image format by scanning, before they can be manipulated and analyzed in the GIS system. These
two raster images were then geo-referenced to the QNG 1995 national grid coordinate system in ArcGis system
Scientific Reports | (2021) 11:18184 | https://doi.org/10.1038/s41598-021-97593-w 5
Vol.:(0123456789)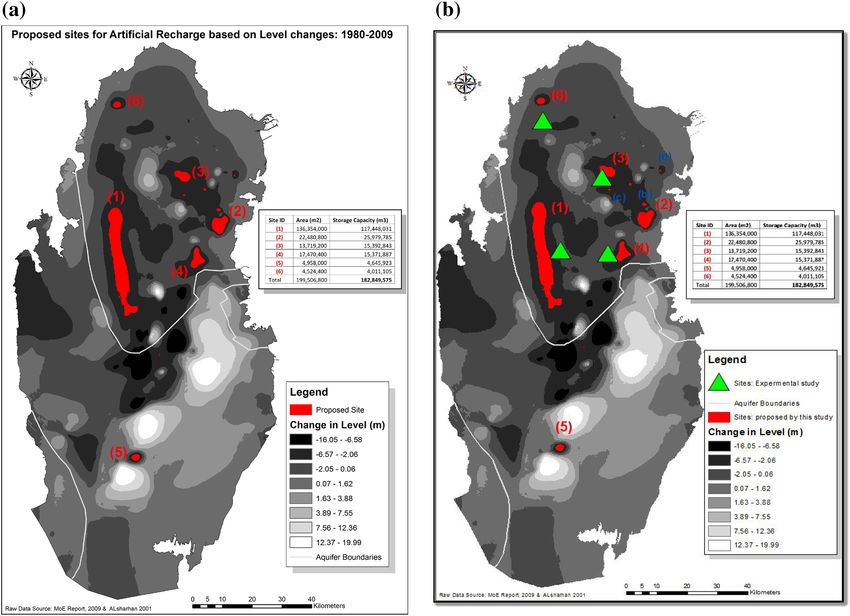
www.nature.com/scientificreports/
Figure 5. Hydrogeologic section in the north of Qatar. (Source: US Geological Survey, Open File. Report
(76–540), http://pubs.usgs.gov/of/1976/0540/report.pdf)23.
environment using Ground Control Points (GCP). The two raster maps were then converted to vector lines
format and potentiometric values were assigned to their respective iso-height lines. The iso-heights were then
converted to point data using the conversion tools in ArcGIS. Geo-statistics interpolation techniques of ArcGIS
were then used to interpolate two continuous potentiometric surface maps (pixels) in order to be able to com-
pare the pixel values of the same location of the two potentiometric maps.
Surface interpolation. Spatial interpolation techniques in the GIS system were used to create two continu-
ous potentiometric raster maps from the point data of 1980 and 2009, so that the two data sets could be com-
pared and analyzed. ArcGIS offers two main groups of surface spatial interpolation techniques: deterministic;
and geo-statistical. The former techniques are used for generating surfaces from measured points, based on
either the extent of similarity or the degree of s moothing26. Geo-statistical techniques, on the other hand, utilize
the statistical properties and spatial configuration of the measured points around the predicted location26, and
quantify the spatial autocorrelation and configuration of these measured points.
Geo-statistical interpolation techniques were preferred over deterministic techniques, and that is based on the
nature of the data available to this study. The Ordinary Kriging method of geo-statistical interpolation technique
proved to provide accurate interpolation with minimum standard error for the data used in the study.
Two potentiometric raster surfaces, 1980 and 2009, were interpolated. The change in potentiometric levels
between the two dates is obtained by subtracting of the 1980 potentiometric surface from the 2009 surface.
Disclaimer. The manuscripts contents are solely the responsibility of the authors, and do not necessarily
represent the official views of the Qatar University and the Environmental Science Center (ESC).
Results and discussion
The 1980–2009 difference map is shown in Fig. 7 below. Negative values indicate decline/drop in the groundwater
level (shown in red orange and yellow colors), whereas positive values indicate increase in water levels (shown
in blue and other colors).
From the above figure, it is very clear that most of the decline/drop in the groundwater levels took place in
the Northern basin, as consequence of over exploitation for irrigation. Areas with high decline in level have good
potential for artificial recharge of aquifer and development.
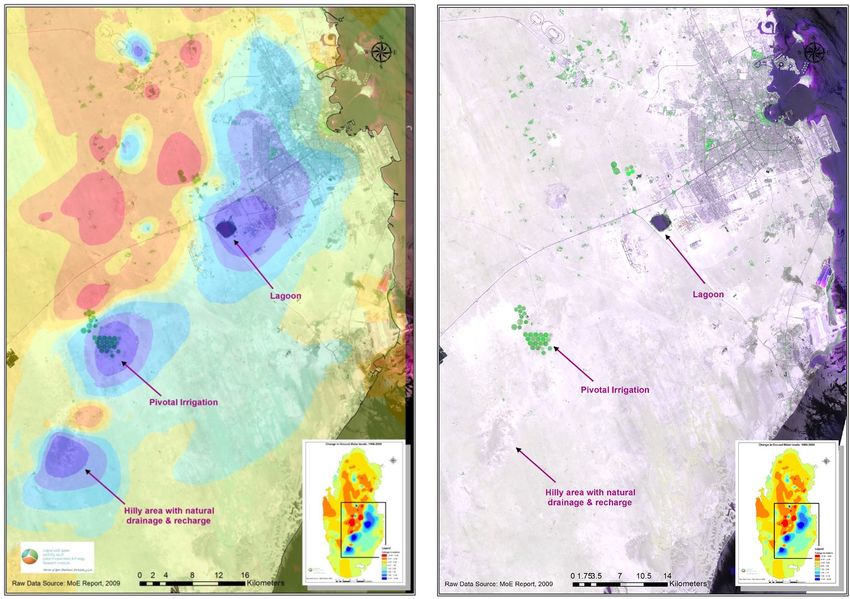
The difference map was then overlaid on Landsat 8 satellite image from the Enhanced Thematic Mapper Plus
(ETM +) sensor, of 2013, to help understand and better interpret the results. From the overlay, Fig. 8, the largest
area with water level rise (blue color, in and around Doha City, is attributed to seepage from the unlined treated
sewage water dumping lagoon at Abu Nakhla- south-west of Doha, as well as leakage from water distribution
network in the city.
The other areas with level increase are the pivot-irrigation fields utilizing recycled treated water and the hilly
area in south-west of Doha. These two areas act as a semi-natural aquifer recharge system, as can be seen in the
north and the middle of the overlay.
Scientific Reports | (2021) 11:18184 | https://doi.org/10.1038/s41598-021-97593-w 6
Vol:.(1234567890)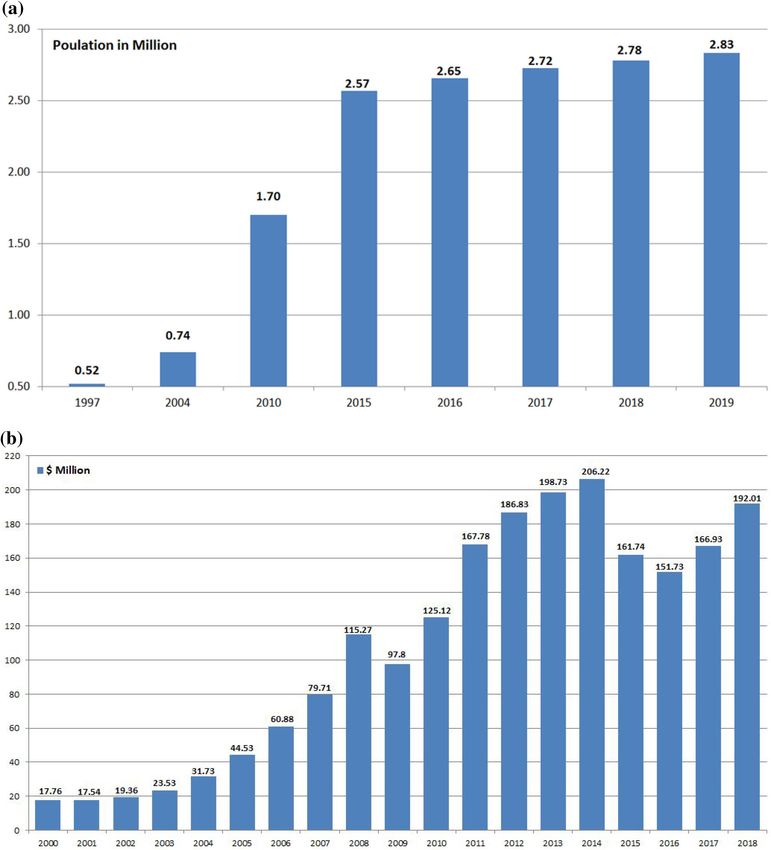
www.nature.com/scientificreports/
Figure 6. Potentiometric surface maps of the upper principal aquifer used in the study in the year. (a) 1980
(Source: Alsharhan et al. (2001), https://www.elsevier.com/books/hydrogeology-of-an-arid-region-the-arabi
an-gulf-and-adjoining-areas/alsharhan/978-0-444-50225-4)22. (b) 2009. (Source: Technical governmental report
publically available, Ministry of Environment, the State of Qatar21.
Areas with groundwater level drops equal or greater than 4 m were considered as high potential zones for
artificial recharge. The 4 m drop was chosen to insure enough storage space, in terms of layer thickness, in order
to minimize risk of possible Land-Surface Deformation (LSD) as a result of artificial recharge27. Small LSD of
few centimeters could have serious consequences for high-rise buildings in Doha City; such deformation causes
cracks and damage to these buildings as the ground moves. Moreover, LSD also damages water and sewage net-
work pipe-joints and fittings, exacerbating the water-leakage problem in Doha, resulting in the water-table rise
in the city. ‘The rising water table in Doha has become a serious issue as it impedes the digging for construction
foundations. Expensive de-watering procedures are required and special coating for the foundations is applied
which add to the construction costs. Water leakage implies more desalinated water needs to be produced to sub-
stitute for the lost waters and increasing vulnerability to disasters in the Gulf ’27. Figure 9 below shows the areas
with water level drops of 4 m or more in groundwater level. The central areas marked with the dotted red line in
the figure were excluded from the recharge plan, despite the high potential recharge volumes. These areas were
excluded to avoid raising the groundwater levels in Doha City. ‘In Qatar, groundwater flows radially following
the general trend of Qatar domal structure, outwards from recharge areas, centered over the higher Qatar Axis
or anticline/homocline that plunges north- south with a surface expression of a broad shallow dome’27.
The water discharges into the adjacent low-lying land along the coast and the Gulf23,24. Artificially recharging
these areas results in increased flow towards Doha, down the groundwater gradient. The highly treated municipal
sewage effluent could be artificially recharged into the aquifer to recharge to sustain this non-renewable precious
water source as reported by28.
Another reason for excluding these central areas is that these areas have large number of sinkholes. These
karst features are produced by the dissolution of subsurface gypsum beds during humid and wet periods in
the Pliocene and Pleistocene period. Refilling these gypsum formations with freshwater is very likely to cause
Scientific Reports | (2021) 11:18184 | https://doi.org/10.1038/s41598-021-97593-w 7
Vol.:(0123456789)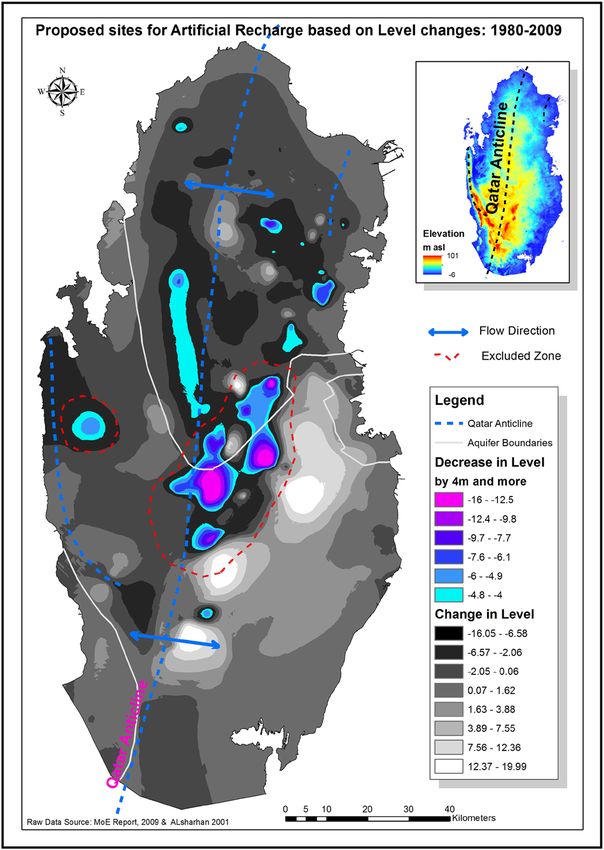
www.nature.com/scientificreports/
Figure 7. Change in groundwater level in Qatar between 1980 & 2009 by basin. Negative values indicate
potential artificial recharge areas. −ve values represent drop in level, while + ve values represent increase in water
level.
re-dissolution, and hence the collapse of ground surface. The Dahl Al-Hamam sinkhole is an example of these
sinkholes shown in Fig. 10 below.
Potential water‑storage volume calculation. To calculate how much water could potentially be
recharged in upper principal aquifer in the selected areas identified in Fig. 9 above. Zones with drop in water
levels equal or greater than 4 m are considered as a high storage capacity potential sites. First a mask for these
zones was created using the ‘Change in Groundwater levels’ map shown in Fig. 8. The volume of change in water
levels is calculated using Cut/Fill tool in ArcGIS software. Since soil’s water holding capacity is determined by
soil porosity, soil porosity for the major soil formation in the area (Limestone) was used to determine the actual
water volume potentials. Limestone porosity factor of 20% was used in this study29–31. The actual water volume
potential is calculated by multiplying the calculated volume by porosity factor. Results show that there are major
six sites with high storage potentials which totals to 182.9 mcm of water, see Fig. 11a below. Moreover, four
minor/secondary sites allocated between sites 2 and 3, with storage potentials of 2 mcm. These secondary sites
could be used for testing purposes since they are small and hence easier to monitor.
Identification of the optimum recharge sites. The outcomes of this study identify six major areas/
zones which are likely to have high artificial recharge potentials, presented in Fig. 11b below. These sites are
characterized by geological formations composed of fissured and fractured carbonate depositional facies of the
Tertiary Period, which is considered as favorable layers for groundwater recharge and storage. In addition to that
most of these sites are situated within the northern groundwater province, the bearing layers of the freshwater
lenses, which is being abstracted heavily for irrigation in the active farms in the State of Qatar.
To verify the results and suitability of the proposed sites, experimental fieldwork is required. However, due to
lack of time and resources, results from an extensive existing experimental fieldwork of Streetly et al. study (con-
ducted in 1992) in northern Qatar, published in 1 99831, have been used as ground-truthing validate this study.
Streetly et al.’s study is based on field testing and modeling of the principal upper aquifer (Rus and Umm er
Radhuma aquifers at four s ites31 situated within the depositional carbonate lithofacies aquifer. These four sites
were found to be in relatively close proximity to the zones identified in this study, therefore representative of
these zones, as shown in Fig. 11b, where the four sampling sites are depicted as green triangles in the map. This
Scientific Reports | (2021) 11:18184 | https://doi.org/10.1038/s41598-021-97593-w 8
Vol:.(1234567890)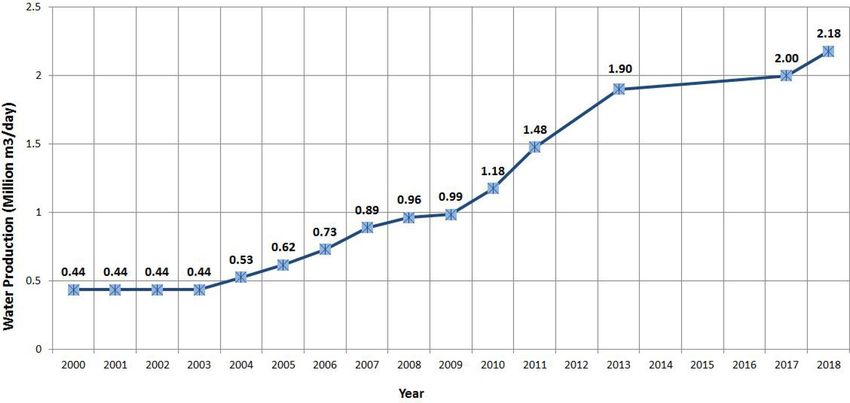
www.nature.com/scientificreports/
Figure 8. The resulted change in groundwater level map overlaid on Landsat 8 ETM + satellite image. Seepage
from lagoons and pivotal irrigation systems result in aquifer recharge. Satellite Image processed by Authors
using: (1) ENVI 4.8 by ITT Visual Information Solution: https://www.ittvis.com. (2) ArcGIS 10.4.1 software:
Environmental Systems Research Institute (ESRI) at: https://www.esri.com.
experimental work is based on step tests, constant rate tests, tracer recharge/re-abstraction, solute transport,
hydrogeological modelling, determination of hydrogeological and geophysical parameters of aquifers, and soil
properties. The Streetly et al.’s measurements identified these sites as optimum recharge locations, which endorses
findings in this study.
In 2018 water production from desalination in Qatar reached 2.18 mcm/day6,32, (see Fig. 1). Accordingly, the
182.8 mcm potential storage would be enough for 3 months, if normal water consumption (business as usual) is
assumed. However, if emergency measures were in place in case of water shortage, by water demand-management
this storage would last longer. For instance, if the per capita daily consumption is equated to the per capita global
average daily consumption in case of emergency, this period could be extended to over 1 year.
Conclusion
Qatar has very limited strategic water reserve enough for only seven days. The country relies heavily on desali-
nated water from the Gulf and the groundwater is highly depleted. This reliance on desalination makes Qatar
very vulnerable to potential natural and man-made disasters in the Gulf that could prevent water intake by the
desalination plants.
Artificial recharge of groundwater aquifers, by freshwater, is one strategic measure proposed to increase the
strategic water reserve of the country. The goal of this framework is to restore and regain the 1980s groundwater
levels. To replenish these aquifers efficiently, a key question that determines success or failure of the plan is: where
to recharge, and how to determine the optimum recharge sites?
It is suggested in this study that old natural storages that have experienced considerable falls and drop in
water levels are optimum locations for water recharge since these storages were chosen by nature hundreds of
years ago- based on the “natural flow” of groundwater. Working with nature is the optimum option for recharge.
GIS-based approach and potentiometric surfaces were used to identify changes of groundwater levels to identify
these optimum recharge sites/zones.
Experimental fieldwork based on hydrological, hydrogeological and geotechnical investigations validate and
confirms the feasibility of the recharge sites identified by this study.
It is recommended that interferometry surveys with polarimetric RADAR, be conducted before and after the
artificial recharge in order to monitor possible land surface deformation.
This study also proved that using GIS and potentiometric surface data could be cost and time-effective
for preliminary identification of optimum recharge sites to pave the way for limited experimental fieldwork.
Scientific Reports | (2021) 11:18184 | https://doi.org/10.1038/s41598-021-97593-w 9
Vol.:(0123456789)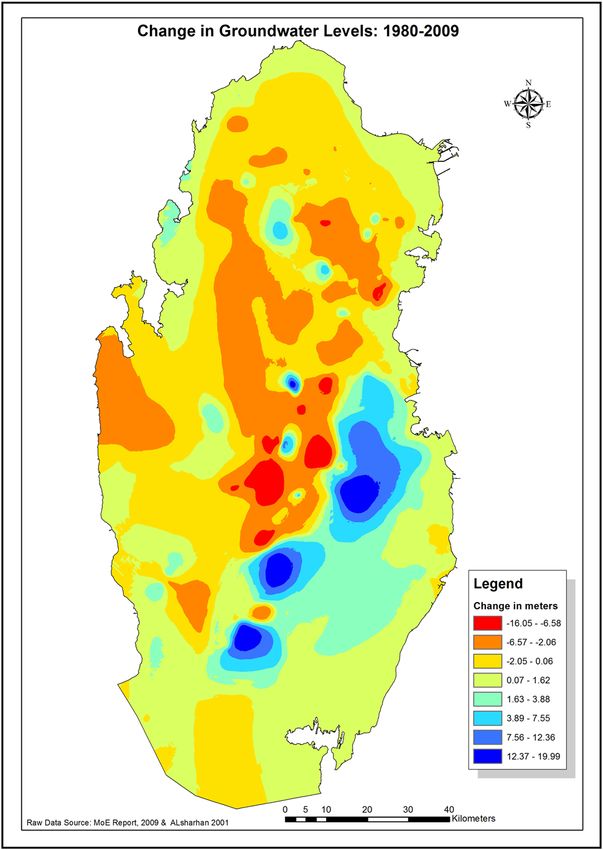
www.nature.com/scientificreports/

                                            Figure 9.  Areas with 4 m and more drop in the groundwater table.

                                            Figure 10.  Photo of Dahl Al-Hamam sinkhole in the Qatar Peninsula. ( Source: taken by the second coauthor).

          Scientific Reports |   (2021) 11:18184 |              https://doi.org/10.1038/s41598-021-97593-w                                            10

Vol:.(1234567890)
www.nature.com/scientificreports/
Figure 11. (a) Proposed sites for potential water-recharge sites (in red color). (b) Proximity of experimental
sites (green tringles) to the proposed zones (red polygons) identified in this study.
Moreover, the proposed methodology and framework would achieve water security issues successfully and could
be applicable in similar arid environments.
Received: 30 March 2021; Accepted: 24 August 2021
References
1. Darwish, M., Abdulrahim, H. & Mohieldeen, Y. Qatar and GCC water security. Desalin. Water Treat. J. https://doi.org/10.1080/
19443994.2014.947782 (2014).
2. Kahramaa. Qatar Has World’s Highest Water Consumption: Kahramaa. http://www.siww.com.sg/industry-news/qatar-has-world%
E2%80%99s-highest-water-consumption-kahramaa. (2013). Accessed 24 Oct 2015.
3. Kahramaa. Reduction in Qatar’s Per Capita Consumption of Electricity and Water; Still a Steep Climb to 2016 Targets. http://www.
justhere.qa/2014/04/kahramaas-tarsheed-programme-brings-reduction-qatars-per-capita-consumption-electricity-10-water-6/
(2014)
4. Al Malki, A. Business Opportunities in Water Industry in Qatar. http://www.siww.com.sg/pdf/Biz_Opps_in_Water_Industry_in_
Qatar.pdf (Qatar General Electricity and Water Corp. (Kahramaa), 2009).
5. QSA (Qatar Statistics Authority). Qatar National Atlas 2013—Qatar (2013).
6. The Peninsula Newspaper. Qatar’s Water Supply to Reach 480m Gallons. https://www.thepeninsulaqatar.com/article/03/03/2018/
Qatar%E2%80%99s-water-supply-to-reach-480m-gallons (2018). Accessed 3 Mar 2018.
7. PC. The Planning Council (2013—Qatar National Atlas 2006—Qatar.
8. TE. Trading Economics. http://www.tradingeconomics.com/qatar/population (2014).
9. TE. Trading Economics. http://www.tradingeconomics.com/qatar/gdp (2019).
10. Zhao, J., Temimi, M., Ghedira, H. & Hu, C. Exploring the potential of optical remote sensing for oil spill detection in shallow
coastal waters-a case study in the Arabian Gulf. Opt. Exp. 22(11), 13758. https://doi.org/10.1364/OE.22.013755| (2014).
11. OT. Oil Transportation: The Two Most Important Transportation Routes. http://ckrhmt2008.weebly.com/transportation-routes.
html (2014).
12. EIA. U.S. Energy Information Administration. "Strait of Hormuz is Chokepoint for 20% of World’s Oil". http://www.eia.gov/today
inenergy/detail.cfm?id=7830 (2012)
13. Zhao, J. & Ghedira, H. Monitoring red tide with satellite imagery and numerical models: A case study in the Arabian Gulf. Mar.
Pollut. Bull. 79(2014), 305–313 (2014).
Scientific Reports | (2021) 11:18184 | https://doi.org/10.1038/s41598-021-97593-w 11
Vol.:(0123456789)www.nature.com/scientificreports/
14. Mindy, R., Mortonb, S. L., Jamalic, E. A., Rajand, A. & Andersona, D. M. The catastrophic 2008–2009 red tide in the Arabian gulf
region, with observations on the identification and phylogeny of the fish-killing dinoflagellate Cochlodinium polykrikoides. Harmful
Algae J. 9(2), 163–172 (2010).
15. Middle East Desalination Research Center (MEDRC). Combating HABS Threats to Desalination Plants in Oman: AN Operational
Model. https://www.medrc.org/combating-habs-threat-to-desalination-plants-in-oman-an-operational-model/. Accessed 1 Apr
2020 (2020).
16. Zhao, J. & Ghedira, H. Monitoring red tide with satellite imagery and numerical models: A case study in the Arabian Gulf. Mar.
Pollut. Bull. 79(1–2), 305–313. https://doi.org/10.1016/j.marpolbul.2013.10.057 (2014).
17. Bauman, A., Burt, J., Feary, D., Marquis, E. & Usseglio, P. Tropical harmful algal blooms: An emerging threat to coral reef com-
munities?. Mar. Pollut. Bull. J. https://doi.org/10.1016/j.marpolbul.2010.08.015 (2010).
18. Al-Omar, M. Red Tide: A New Threat to Water Resources in the Arabian Gulf Region. http://www.inbo-news.org/IMG/pdf/Mutha
nna_Alomar.pdf (Abu Dhabi Water & Electricity Authority, National Energy & Water Research Center, 2008).
19. Naser, H. Marine Ecosystem Diversity in the Arabian Gulf: Threats and Conservation. http://cdn.intechopen.com/pdfs-wm/46202.
pdf (INTECH Publication, 2014)
20. Abdulraheem, M. Reducing the Ecological Footprint of Power/Desalination Plants. Kuwait Foundation for the Advancement of Sci‑
ences. http://www.kfas.org/images/news-images/papers-of-symposuim/11-Reducing-the-Ecological-Footprint-of-Power-Desal
ination-Plants.pdf (2010)
21. MoE. Ministry of Environment—Qatar. Studying and developing the natural and artificial recharge of groundwater aquifer in the
State of Qatar (2009). in Final Report, Department of Agriculture and Water Research (DAWR), Ministry of Environment (MoE),
Prepared by Schlumberger Water Service (SWS) (2009).
22. Alsharhan, S., Rizk, A., Nairn, M. & Bakhit, W. Hydrogeology of an Arid Region: The Arabian Gulf and Adjoining Areas 1st edn.
(Elsevier, 2001)https://w ww.e lsevi er.c om/b
ooks/h
ydrog eolog y-o
f-a n-a rid-r egion-t he-a rabia n-g ulf-a nd-a djoin
ing-a reas/a lshar han/
978-0-444-50225-4.
23. Vecchioli, J. Preliminary Evaluation of the Feasibility of Artificial Recharge in Northern Qatar. U.S. Geological Survey, Open-File
Report (76-540). http://pubs.usgs.gov/of/1976/0540/report.pdf (1976).
24. UN-ESCWA and BGR. United Nations Economic and Social Commission for Western Asia; Bundesanstalt für Geowissenschaften
und Rohstoffe). “Inventory of Shared Water Resources in Western Asia. Beirut” (2013).
25. Industrial Development Technical Centre. Qatar Geological Map: Explanatory Booklet (Seltrust Engineering Limited, 1980).
26. ESRI. Environmental Systems Research Institute. "Understanding Geostatistical Analysis". http://resources.esri.com/help/9.3/arcgi
sengine/java/GP_ToolRef/geostatistical_analyst_toolbox/understanding_geostatistical_analysis.htm (2010).
27. Mohieldeen, Y. & Al-Marri A. Using GIS to quantify change in the groundwater levels in Qatar between 1980 & 2009. in Qatar
Foundation Annual Research Conference Proceedings 2016: EEPP1685. https://doi.org/10.5339/qfarc.2016.EEPP1685 (QScience,
2016)
28. Brown, J. J., Das, P. & Al-Saidi, M. Sustainable agriculture in the Arabian/Persian gulf region utilizing marginal water resources:
Making the best of a bad situation. Sustainability 10, 1364. https://doi.org/10.3390/su10051364 (2018).
29. Edward, G. Porosity and Bulk Density of Sedimentary Rocks. Geological Survey Bulletin 11 44-E, United State Government Printing
Office. https://pubs.usgs.gov/bul/1144e/report.pdf (1963)
30. https://wiki.aapg.org/Porosity.
31. Streetly, M. & Kotoub, S. Determination of aquifer properties in northern Qatar for application to artificial recharge. Q. J. Eng.
Geol. Hydrogeol. 31, 199–209. https://doi.org/10.1144/GSL.QJEG.1998.031.P3.04 (1998).
32. Ministry of Development Planning and Statistics. Water Statistics in the State of Qatar 2015. https://www.mdps.gov.qa/en/stati
stics/Statistical%20Releases/Environmental/Water/2015/Water-Statistics-2015-En.pdf (2015)
33. Qatar Atlas 2013: Land Use Map of Qatar. https://www.psa.gov.qa
Acknowledgements
The authors would like to acknowledge and thank their institutions (QU, HBKU, and SQU) for providing facili-
ties and support during this study. Also, we thank Mr. Anan A. Al-Marri, the GIS expert of Qatar Environment
and Energy Research Institute (QEERI), Hamad Bin Khalifa University (HBKU)) for his continuous support
and collaboration throughout the GIS aspect of the work.
Author contributions
M.Y.: Conceptualization, research methodology, project administration, collection of samples, investigation,
formal analysis, visualization, resources, writing the original draft of the manuscript, wrote the main manuscript,
reviewing and editing. E.A.: Conceptualization, research methodology, project administration, collection of
samples, investigation, formal analysis, visualization, resources, writing the original draft of the manuscript,
wrote the main manuscript, reviewing and editing. R.A.: Conceptualization, research methodology, project
administration, collection of samples, investigation, formal analysis, visualization, resources, writing the original
draft of the manuscript, reviewing and editing. All authors reviewed the manuscript.
Competing interests
The authors declare no competing interests.
Additional information
Correspondence and requests for materials should be addressed to E.A.E.
Reprints and permissions information is available at www.nature.com/reprints.
Publisher’s note Springer Nature remains neutral with regard to jurisdictional claims in published maps and
institutional affiliations.
Scientific Reports | (2021) 11:18184 | https://doi.org/10.1038/s41598-021-97593-w 12
Vol:.(1234567890)www.nature.com/scientificreports/
Open Access This article is licensed under a Creative Commons Attribution 4.0 International
License, which permits use, sharing, adaptation, distribution and reproduction in any medium or
format, as long as you give appropriate credit to the original author(s) and the source, provide a link to the
Creative Commons licence, and indicate if changes were made. The images or other third party material in this
article are included in the article’s Creative Commons licence, unless indicated otherwise in a credit line to the
material. If material is not included in the article’s Creative Commons licence and your intended use is not
permitted by statutory regulation or exceeds the permitted use, you will need to obtain permission directly from
the copyright holder. To view a copy of this licence, visit http://creativecommons.org/licenses/by/4.0/.
© The Author(s) 2021
Scientific Reports | (2021) 11:18184 | https://doi.org/10.1038/s41598-021-97593-w 13
Vol.:(0123456789)You can also read