Space Weathering Induced Via Microparticle Impacts: 1. Modeling of Impact Velocities and Flux of Micrometeoroids From Cometary, Asteroidal, and ...
←
→
Page content transcription
If your browser does not render page correctly, please read the page content below
Space Weathering Induced Via Microparticle Impacts:
 1. Modeling of Impact Velocities and Flux of
 Micrometeoroids From Cometary, Asteroidal, and
 Interstellar Origin in the Main Asteroid Belt and the
 Near-Earth Environment
 N. Altobelli, K. Fiege, B. Carry, R. Soja, M. Guglielmino, M. Trieloff, T.
 Orlando, R. Srama

 To cite this version:
 N. Altobelli, K. Fiege, B. Carry, R. Soja, M. Guglielmino, et al.. Space Weathering Induced Via Mi-
 croparticle Impacts: 1. Modeling of Impact Velocities and Flux of Micrometeoroids From Cometary,
 Asteroidal, and Interstellar Origin in the Main Asteroid Belt and the Near-Earth Environment. Jour-
 nal of Geophysical Research. Planets, 2019, 124 (4), pp.1044-1083. �10.1029/2018JE005563�. �hal-
 02303325�

 HAL Id: hal-02303325
 https://hal.science/hal-02303325
 Submitted on 31 Dec 2021

 HAL is a multi-disciplinary open access L’archive ouverte pluridisciplinaire HAL, est
archive for the deposit and dissemination of sci- destinée au dépôt et à la diffusion de documents
entific research documents, whether they are pub- scientifiques de niveau recherche, publiés ou non,
lished or not. The documents may come from émanant des établissements d’enseignement et de
teaching and research institutions in France or recherche français ou étrangers, des laboratoires
abroad, or from public or private research centers. publics ou privés.
 Copyright
RESEARCH ARTICLE Space Weathering Induced Via Microparticle Impacts: 1.
10.1029/2018JE005563
 Modeling of Impact Velocities and Flux of
Special Section: Micrometeoroids From Cometary, Asteroidal,
Science and Exploration of the
Moon, Near-Earth Asteroids, and and Interstellar Origin in the Main Asteroid
the Moons of Mars
 Belt and the Near-Earth Environment
This article is a companion to Fiege et al.
(2019) https://doi.org/10.1029/ N. Altobelli1 , K. Fiege2,4 , B. Carry3 , R. Soja4 , M. Guglielmino2 , M. Trieloff2 ,
2018JE005564. T. M. Orlando5 , and R. Srama4
 1 ESA, European Space Agency, Madrid, Spain, 2 Klaus-Tschira-Labor für Kosmochemie, Institut für Geowissenschaften,
Key Points:
• This paper presents the modeling of Universität Heidelberg, Heidelberg, Germany, 3 Université Côte d' Azur, Observatoire de la Côte d'Azur, CNRS,
 micrometeoroid impacts on main Laboratoire Lagrange, Nice, France, 4 Institut für Raumfahrtsysteme, Universität Stuttgart, Stuttgart, Germany,
 belt and near-Earth asteroids 5 School of Chemistry and Biochemistry, Georgia Institute of Technology, Atlanta, GA, USA
• The contribution of cometary,
 asteroidal, and interstellar dust as
 space weathering agents is evaluated
 Abstract The processes of alteration of airless bodies exposed to the space environment are referred to
 be as “space weathering.” Multiple agents contribute generally to space weathering, to an extent that
Correspondence to: depends on the specific location of the surface within the solar system. Typical space weathering agents
N. Altobelli,
nicolas.altobelli@sciops.esa.int encountered in the solar system are solar radiation, solar wind and cosmic rays, magnetospheric plasma
 (e.g., at Jupiter or Saturn), and cosmic dust. The effect of space weathering is generally assessed by
 measuring the surfaces optical properties, for example, by near-infrared spectroscopy. The alteration of the
Citation:
Altobelli, N., Fiege, K., Carry, B.,
 surfaces is due to a cumulative effect over time of all agents. We investigate in this paper the contribution
Soja, R., Guglielmino, M., Trieloff, M., of micrometeoroid (dust) bombardment on different asteroids, by using the Interplanetary Micrometeoroid
et al. (2019). Space weathering Environment Model for the interplanetary dust populations and a simplified model of interstellar dust
induced via microparticle
impacts: 1. Modeling of
 dynamics. We quantify, for different representative asteroids (main belt and Near Earth Objects [NEOs]),
impact velocities and flux of microm- the particle cumulative flux, mass flux, impact velocity, and the kinetic impact energy deposited. This work
eteoroids from cometary, asteroidal, is primarily intended to support laboratory work investigating the effect of energy deposition onto sample
and interstellar origin in the main
asteroid belt and the near-Earth
 surfaces, as well as astronomical observations of optical properties of asteroid surfaces.
environment Journal of Geophysical
Research: Planets, 124, 1044–1083. Plain Language Summary This paper explores the impact speed, mass flux, and kinetic
https://doi.org/10.1029/2018JE005563 energy flux of interplanetary and interstellar micrometeoroids on near-earth and main belt asteroids from
 different dynamical families. This paper aims at providing constraints to current and future experimental
Received 31 JAN 2018 work to understand the space weathering of asteroids surfaces induced by dust impacts.The simulations
Accepted 30 AUG 2018 are performed using the latest version of the micrometeoroid environment model of the European Space
Accepted article online 13 SEP 2018
 Agency (Interplanetary Micrometeoroid Environment Model). We find that for all asteroids studied, the
Published online 29 APR 2019
 dust impactors deposit orders of magnitude less energy on the asteroid surfaces compared to the solar
Author Contributions radiations but their contribution is comparable to that of heavy solar wind ions and electrons. We find
Writing - review & editing: B. Carry that large cometary grains provide most of the mass flux delivered to asteroids surfaces, independently
 of the asteroids orbital elements, suggesting that dust bombardment is unlikely to play a significant role
 in driving the observed spectral trends among the different asteroids. While surface gardening by dust
 bombardment may, in turn, expose fresh material from the asteroid's surface, the required interplanetary
 dust population mass flux seems too low to efficiently counterbalance the surface weathering due to solar
 wind implantation.

 1. Introduction
 We investigate the characteristics of meteoroid impacts on the surface of asteroids with different orbital
 elements in order to support the experimental investigations of space weathering of asteroid surfaces (see
 Fiege et al., 2019). Space weathering is the process of alteration of exposed surfaces of objects throughout the
©2018. American Geophysical Union. solar system via the interaction with their environment (Bennett et al., 2013; Brunetto et al., 2015). Alteration
All Rights Reserved. is caused by weathering agents, such as energetic irradiation, stemming from a variety of sources (solar,

ALTOBELLI ET AL. 1044
Journal of Geophysical Research: Planets 10.1029/2018JE005563

 galactic, or magnetospheric), and meteroid and micrometeroid (hereafter
 referred to as “dust”) impacts. Understanding how energy is deposited by
 the different weathering agents on the surface of asteroids, and possibly
 changing their spectral type, is key to understand their origin and evolu-
 tion. For example, alteration by the solar wind can process very rapidly
 to give its final “color” to an exposed surface, with the final reflectance
 properties being dependent on the original surface composition and
 on the surface-particle-size properties, such that color trends observed
 for different asteroids may not be directly linked to an exposition age
 (Vernazza et al., 2009). In parallel, rejuvenation processes, like garden-
 ing by micrometeorites impacts, can counteract the effect of solar wind
 irration by exposing fresh surface material..
 Knowledge of the dust dynamics and size distribution at the location of
 the asteroids of interest is a prerequisite to quantify the exposition of their
 surface to micrometeoroid bombardment. Thanks to the investigations of
 various missions (e.g., Pioneer 10 and 11, Galileo, Helios, Ulysses, and
 Cassini; Grün et al., 1993), providing in situ data from onboard dust ana-
 lyzers, dust fluxes have been assessed at various locations in the solar
 system. The dynamical evolution and the relative abundance of dust
 grains in the interplanetary space are determined by their interaction
 with solar gravity, radiation pressure, the coupling with the interplane-
Figure 1. Main belt asteroids (black dots) plotted as function of their orbit's tary magnetic field (IMF) through Lorentz forces, dynamical resonances
inclination (upper panel) and eccentricity (lower panel) versus the orbit's with the giant planets, and mutual collisions.
semimajor axis. The asteroids selected for this study are indicated by their
name. Developing dust flux prediction models in the inner solar system has
 been an active field of research in the last decades (Dikarev et al., 2005;
 Divine, 1993; Grün et al., 1985; Staubach et al., 1997), and model improvements are still being worked
 on. In particular, the importance of cometary contribution to the inner solar system dust populations was
 empathized by Nesvorný et al. (2010). Modeling of the outer solar system dust fluxes was made possible only
 recently thanks to the new in situ dust data gathered by the New Horizon mission (Poppe, 2016). For this
 work, focusing on the dust bombardment of asteroid surfaces, we use the Interplanetary Micrometeoroid
 Environment Model (IMEM) by Dikarev et al. (2005), developed for the European Space Agency (ESA) to
 assess hazards caused by micrometeoroids to space missions. This model includes asteroidal and cometary
 dust populations coupled to an evolutionary model of their orbital elements in the inner solar system (see
 section 3).

 2. Selection of Representative Asteroids
 We selected a set of asteroids for our simulations, whose orbits cover a wide range of semimajor axis a,
 eccentricity e, and inclination i, such as to reflect the diversity of the different dynamical families within the
 main belt (Figure 1). We also selected three NEOs, including an example of very rare asteroids having retro-
 grade orbit (2009 HC82). Note that we did not include Jupiter trojan asteroids in our selection, because the
 corresponding heliocentric distances correspond to the limit of applicability of the IMEM model (Dikarev
 et al., 2005). The ephemerides for each asteroid have been generated from the Jet Propulsion Laboratory
 (JPL) Small-Body Database Browser (https://ssd.jpl.nasa.gov/x/spk.html) and exported in Spice kernel for-
 mat (spk) for our simulations. Table 1 provides a summary of the asteroids chosen to perform the dust
 impact computations, ordered by increasing semimajor axis. Figure 1 shows the distribution of the main belt
 asteroids selected in this work in the (a,e,i) space on top of the full content of the JPL small bodies database.

 3. Modeling of the Interplanetary Dust Populations
 The interplanetary dust complex, also called the “zodiacal cloud,” is made of dust grains of various ori-
 gins. The main sources of dust in the interplanetary space are cometary activity (Nesvorný et al., 2010) and
 asteroid collisions. In addition, dust from the interstellar medium surrounding the solar system is known to
 penetrate the heliosphere and is also a population of the zodiacal cloud. We refer the reader to Grün et al.
 (1997)—for a review of the zodiacal dust complex.

ALTOBELLI ET AL. 1045
Journal of Geophysical Research: Planets 10.1029/2018JE005563

Table 1
Names, Orbital Characteristics and Taxonomy of the Asteroids Chosen for the Simulations of Micrometeoroids Impacts
Asteroid name Comment Semimajor axis (AU) Eccentricity Inclination (deg) Taxonomy
433 Eros NEO (Amor group) 1.45 0.22 10.8 S
434 Hungaria Inner Main Belt 1.94 0.07 22.5 Xe
4 Vesta Inner Main Belt 2.36 0.08 7.1 V
21 Lutetia Inner Main Belt 2.4 0.16 3.0 Xc
25 Phocaea Inner Main Belt 2.4 0.25 21.6 S
343158-2009 HC82 NEO (Apollo group) 2.52 0.8 154.4
5 Astraea Middle Main Belt 2.57 0.19 5.3 S
1036 Ganymed NEO (Amor group) 2.6 0.53 26.6 S
15 Eunomia Middle Main Belt 2.64 0.18 11.7 K
2 Pallas Middle Main Belt 2.7 0.23 34.1 B
1 Ceres Middle Main Belt 2.76 0.07 10 C
158 Koronis Outer Main Belt 2.86 0.05 1.0 S
221 Eos Outer Main Belt 3.01 0.1 10.8 K
24 Themis Outer Main Belt 3.12 0.13 0.75 C
10 Hygiea Outer Main Belt 3.14 0.11 3.8 C
702 Alauda Outer Main Belt 3.19 0.01 20.58 B
1362 Griqua Outer Main Belt 3.21 0.37 24.2 B
87 Sylvia Outer Main Belt 3.49 0.08 10.85 X
153 Hilda Outer Main Belt 3.97 0.13 7.8 X

 In order to estimate the abundances and dynamical properties of dust at the asteroids positions, we use the
 ESA meteoroid model (IMEM) as described in Dikarev et al. (2005). This model is a truly (dynamical) evolu-
 tionary model that considers the orbital elements of known interplanetary dust sources, in particular, comets
 and asteroids. The model computes the evolution of the orbital elements of the released particles, taking into
 account radiation pressure, Poynting-Robertson drag (the relativistic, tangential component of the radiation
 pressure), gravitation, and mutual collisions of particles. The simulated dust complex is assumed to have its
 properties (flux and orbital element distribution) to be axisymmetric with respect to the ecliptic axis. The
 mass of the simulated grains ranges from 10−18 g to 1 g, and the heliocentric distance up to which IMEM pre-
 dictions can be made is 5 AU. Seventy-two different interplanetary dust populations originating from comets
 are included in the IMEM model, depending on their size range and source regions. Two main dynami-
 cal regimes are defined in the model (Dikarev et al., 2005)—“small” grains (those with a mass lower than
 10−6 g) will evolve dynamically (in a mass-dependent way) under the influence of the Poynting-Robertson
 drag and will depart significantly from the orbit of their parent bodies, while “large” grains (those with a
 mass larger than 10−5 g) will tend to remain on orbits close to those of their parent bodies. Depending on
 the grain source and evolution process, four main extended sources of dust are referred to hereafter in this
 paper (following the IMEM nomenclature, as in Dikarev et al., 2005): “Asteroid collision [AC],” “Asteroid
 Poynting-Robertson [APR],” “Comet collisions [CC],” “Comet Poynting-Robertson [CPR].” Those two [AC]
 and [CC] collision categories correspond, roughly, to large asteroidal and cometary dust grains,while the two
 [APR] and [CPR] categories, whose dynamics is dominated by PR drag, correspond to the small asteroidal
 and cometary grains. The relative abundance of each population are weighted in the IMEM model using
 the infrared observations by COBE (Kelsall et al., 1998), in situ impact detections by Ulysses and Galileo
 (Grün et al., 1997), and the lunar crater size distribution (Grün et al., 1985). We note that the cometary dust
 populations implemented in this model are limited to the dust production by Jupiter family comets (JFCs).
 While those populations have been identified to be the most abundant cometary dust contribution in the
 inner solar system (Nesvorný et al., 2010; Pokorný et al., 2014), we discuss the consequences of this model
 limitation for our study in section 5.

 3.1. Modeling of the Interstellar Dust Population
 While the IMEM model also includes an interstellar dust (ISD) component, its modeling was deemed
 too simplistic for the purpose if this paper, and we developed a specific module. Detailed dynamical

ALTOBELLI ET AL. 1046
Journal of Geophysical Research: Planets 10.1029/2018JE005563

 considerations of ISD within the solar system can be found in Landgraf et al. (1999) and Sterken et al. (2013).
 We summarize here only the aspects relevant for our study.
 The ISD grains are injected into the solar system as a collimated flux along the 79◦ /−8◦ downstream helio-
 centric direction (see Mann, 2010, for a review). Those particles are on hyperbolic orbits with respect to the
 Sun, and their dynamics in the interplanetary space is determined by the mass-dependent balance between
 radiation pressure, solar gravity, and Lorentz forces. The parameter is defined as the ratio between radi-
 ation pressure and gravity and is independent of the grain distance to the Sun. If = 1, particles keep the
 ecliptic direction of their injection into the solar system and behave as if there was no Sun. If < 1, gravity
 dominates, resulting in an attractive radial force toward the Sun, and if > 1, radiation pressure dominates,
 resulting in a repulsive radial force from the Sun. The ratio between the grain charge and its mass determines
 the strength of the coupling of the grain trajectory to the IMF, through the Lorentz forces. For grains in the
 micron size range and above, assuming silicate bulk material densities, radiation pressure and solar gravity
 dominate the grains dynamics. In the submicron size range, Lorentz forces induce a focusing/defocusing
 effect following the solar activity cycles (e.g., Landgraf et al., 1999; Sterken et al., 2013). An ISD stream was
 first detected by the Ulysses dust analyzer outside of the ecliptic plane (Grün et al., 1993), corresponding to
 a particle flux of 1.5 × 10⁻⁴ m−2 /s. The stream fluctuations were monitored by the dust detectors onboard
 Galileo, Helios, and Cassini from 0.3 to 5 AU (Altobelli et al., 2005, 2006), and their theoretical modeling
 was confirmed. Note that in this work, while our ISD simulations take radiation pressure into account, we
 did not simulate the IMF coupling, which dominates the grains dynamics only for the smallest ISD grains
 owing to their large charge-to-mass ratio. Such grains are typically smaller than 0.2 microns, and, because
 the dynamic coupling with the IMF will alter their impact direction but will not change their impact speed
 significantly, those grains will not contribute significantly to the kinetic energy flux responsible of space
 weathering.

 4. Interplanetary Dust Impactors: Methods and Simulation Results
 This section provides the simulation results (impact speed range, particle number flux, mass, and kinetic
 energy flux) for the asteroidal and JFCs dust populations impacting the surface of the asteroids along their
 orbit. The radiant directions (apparent downstream directions of the impactors, as seen from the impacted
 body) that yield the highest flux and impact speeds vary with the asteroids orbital elements, and, for asteroids
 with high eccentricities, those directions will depend on the asteroid's true anomaly. For the practical pur-
 pose of this study, which aims at providing ranges of impact speeds and flux values to be used in experimental
 studies, we take into account the anisotropy of the impacting dust flux as follows:
 1. For each asteroid, a coordinate frame is defined such as to have the X-axis pointed to the Sun, and the
 Y -axis is defined as the orthogonal projection of the asteroid's heliocentric velocity vector on the X-axis.
 The Z-axis completes the right-handed frame. Hence, in this frame, the longitude values represent the
 local time on the asteroid surface, and the latitude values are defined with respect to the orbital plane of the
 asteroid. This reference frame has the advantage to depend only on the asteroid orbital elements and can
 be applied to all asteroids selected in this work to derive the value ranges of dust impact speed and flux in
 the surface. In turn, body fixed reference frames, while allowing to study the anisotropy of the distribution
 of the impactors flux on an asteroid surface (a task beyond the scope of this work), have the drawback of
 depending on the proper definition of a rotation axis for each asteroid.
 2. The asteroid's surface is divided in surface elements of size 10◦ × 10◦ longitude-latitude and defined by
 their normal vector expressed in the coordinate frame defined above. Each surface element is “flown”
 through the IMEM dust populations for a full orbit. The extremum values of the impact speed and flux for
 all surface elements are retrieved over the full trajectory such that the values reported for each asteroid are
 independent of the impact direction.
 We note that for all asteroids considered in this work, the relative velocities of the dust grains with the
 asteroids is so high and the asteroid mass so weak, which the effect of gravitation focusing on the impact
 flux can be neglected (Colombo et al., 1966).
 4.1. Impact Speed and Particle Cumulative Fluxes
 Each simulation performed covers a full orbit of the asteroid, the position of the asteroid on its orbits being
 parameterized by the true anomaly (the closest point to the Sun is reached at 0◦ and the farthest point at
 180◦ ). An example of the simulation results for the impact speed of the different IDP populations (section

ALTOBELLI ET AL. 1047
Journal of Geophysical Research: Planets 10.1029/2018JE005563

 Figure 2. Flux and velocity of dust impactors on Ceres along its orbit. Top: distance of Ceres to the Sun in astronomical
 units as function of its true anomaly. The gray (black) symbols indicate when Ceres is located at southern (northern)
 ecliptic latitude. Middle: impact speed range. Bottom: maximum cumulative particle flux. The red and yellow colors in
 the middle and lower panels stand for the asteroidal asteroid collision (AC) and asteroid Poynting-Robertson (APR)
 dust populations, and the dark and light blue curves for the cometary comet collision (CC) and comet
 Poynting-Robertson (CPR) dust populations.

 3), and their flux is shown for Ceres on Figure 2. The figures for each individual asteroid can be found
 in Appendix A. The flux values correspond to the cumulative flux in particle number belonging to each
 population. The differences between the impactors of cometary or asteroidal origin appear clearly in those
 plots, with a fast-speed impactor regime for cometary grains and a relatively low-speed impactor regime
 for asteroidal dust. Those differences in impact speed and the relative flux of the particles are discussed in
 section 5. In order to make the comparison of the dust impact speeds between different asteroids easier, we
 indicate the minimum and maximum values along the body's orbit in Table 2.
 4.2. Kinetic Energy and Mass Flux
 Of particular relevance for experimental studies of asteroid surface alteration by micrometeoroids impacts
 are the total mass flux and kinetic energy flux. Because both the particles dynamics, (and hence their impact
 speed on the asteroid surface), as well as the particles abundance (in terms of volume number density), are
 mass dependent, the simulations must be run within mass bins narrow enough to be able to consider the
 average particles velocity and abundance nearly independent of the mass within the mass bin. Practically,
 we have run for each asteroid 12 simulations covering logarithmically the mass range 10−12 to 1 g. The mass
 flux for each mass bin Fm(M) is then derived by multiplying the middle mass value M of each interval with
 the corresponding particle flux, and the kinetic flux Ek is derived by evaluating Ek(M) = 12 ∗ M ∗ v2 , where v
 is the mean value of the impact speed of the particles within the mass bin. The total mass and kinetic energy
 fluxes are then obtained by summing up all contributions in all mass bins. Note that in order to facilitate
 the comparison of the kinetic energy deposited by micrometeoroids on asteroid surfaces with the value of
 other agents (solar wind particles and cosmic rays, e.g., such as those reported in Bennett et al., 2013; see

ALTOBELLI ET AL. 1048
Journal of Geophysical Research: Planets 10.1029/2018JE005563

 Table 2
 Overview of the Minimum and Maximum Impact Speeds From the Asteroid Apex Direction for CD or AD
 Asteroid name CD Vmin (km/s) CD Vmax (km/s) AD Vmin (km/s) AD Vmax (km/s)
 EROS 14.7 36.2 10.7 17.9
 HUNGARIA 18.8 39.8 6.5 15.1
 VESTA 20.4 29.5 3.8 5.3
 LUTETIA 18.5 27.4 3.7 5.4
 PHOCAEA 16.9 39.5 5.0 13.6
 HC82 18.7 110.1 13.7 111.6
 ASTRAEA 18.3 27.6 4.5 5.8
 GANYMED 17.1 46.2 6.0 22.3
 EUNOMIA 17.0 31.7 4.9 7.0
 PALLAS 25.1 44.1 7.9 16.3
 CERES 19.9 29.1 2.5 5.9
 KORONIS 18.7 24.5 2.9 3.2
 EOS 21.8 30.1 2.9 6.2
 THEMIS 16.5 26.2 2.1 4.1
 HYGIEA 17.2 26.4 2.8 4.2
 ALAUDA 25.8 35.8 6.1 8.4
 GRIQUA 19.1 39.7 4.7 12.6
 SYLVIA 20.3 29.7 3.3 8.4
 HILDA 20.8 28.0 7.0 9.8
 Note. CD = cometary dust; AD = asteroidal dust.

Table 3
Summary of the Minimum and Maximum IDP Mass and Kinetic Energy Flux Along the Orbit of the Different Asteroids
Asteroid name Fm min (g·cm−2 ·s−1 ) Fm max (g·cm−2 ·s−1 ) Ek min (ev·cm−2 ·s−1 ) Ek max (ev·cm−2 ·s−1 )
EROS 8.2E-17 1.7E-16 3.5E+07 6.4E+07
HUNGARIA 8.2E-18 2.3E-16 4.2E+06 9.4E+07
VESTA 6.0E-17 1.1E-16 1.2E+07 2.5E+07
LUTETIA 8.1E-17 1.4E-16 1.3E+07 3.4E+07
PHOCAEA 5.9E-18 2.5E-16 4.2E+06 1.1E+08
HC82 1.8E-17 1.8E-15 2.1E+07 3.0E+10
ASTRAEA 8.6E-17 1.1E-16 1.3E+07 2.7E+07
GANYMED 6.0E-18 3.3E-16 4.9E+06 3.2E+08
EUNOMIA 3.0E-17 1.6E-16 8.6E+06 4.3E+07
PALLAS 2.1E-18 3.0E-16 2.2E+06 1.6E+08
CERES 3.4E-17 1.2E-16 7.1E+06 2.4E+07
KORONIS 7.7E-17 9.3E-17 1.3E+07 1.6E+07
EOS 4.0E-17 1.1E-16 7.2E+06 2.2E+07
THEMIS 7.2E-17 1.1E-16 1.6E+07 2.3E+07
HYGIEA 6.8E-17 1.1E-16 1.4E+07 2.4E+07
ALAUDA 7.7E-18 1.8E-16 5.7E+06 4.1E+07
GRIQUA 9.8E-18 2.7E-16 5.7E+06 1.2E+08
SYLVIA 3.1E-17 1.2E-16 8.3E+06 2.7E+07
HILDA 6.2E-17 1.2E-16 1.9E+07 4.7E+07

ALTOBELLI ET AL. 1049
Journal of Geophysical Research: Planets 10.1029/2018JE005563

 Figure 3. Maximum kinetic energy and mass flux delivered by Jupiter family comets and asteroidal dust along the
 orbit of Ceres, as function of the body true anomaly. The distance to the Sun is plotted in the upper panel; the kinetic
 energy and mass flux are plotted in the middle and lower panels, respectively. The upper panel shows the body
 distance to the Sun, with the black (gray) symbols indicating the northern (southern) latitudes of the orbit. The
 different colors stand for the different dust mass bins (from 10−12 to 1 g) for which the simulations have been
 performed. The black crosses in the middle and lower panel indicate the total maximum kinetic energy and total mass
 flux, respectively. IDP = interplanetary dust population.

 also Brunetto et al., 2015), the unit of kinetic energy flux is given in [ev·cm−2 ·s−1 ]. An example of the mass
 flux and kinetic energy flux computations is shown for Ceres on Figure 3. The corresponding figures for
 each individual asteroid can be found in Appendix A. A high level summary of the computations is provided
 in Table 3. For each asteroid, we have indicated the minimum and maximum value of the total mass and
 kinetic energy flux along the body's orbit.
 4.2.1. ISD Impactors
 The computation of the ISD grains impact velocities on Ceres surfaces as function of the asteroid's true
 anomaly is shown on Figure 4. As explained in section 3.1, our modeling of the ISD grain dynam-
 ics within the solar system is driven by the factor. Because the relationship between and the
 grain mass depends on grain constitutive models (Kimura et al., 2003), we use different values of as
 input to our simulations rather than the mass of the grains. Practically, we run for each asteroid sim-
 ulations for = 0.2, = 1, and = 1.3. Such values of cover a wide range of ISD grain types
 in term of masses and composition (from 10−19 to 10−12 kg), as detected in situ in the solar system
 (Altobelli et al., 2016; Grün et al., 1993; Kimura et al., 2003; Mann, 2010). The figures for each aster-
 oid are provided in Appendix A. Important variations of the impact velocity, including discontinuities
 (e.g., on Figure 4, the blue curve corresponding to = 0.2), can be seen depending on the asteroid's
 position on its orbit. For > 1 (e.g., on Figure 4, the yellow curve corresponding to = 1.3), there are
 true anomaly values for which no grain can reach the asteroid. This particular behavior and the impact
 speed variations can be entirely explained by the strong anisotropy of the ISD stream, the strength of the

ALTOBELLI ET AL. 1050
Journal of Geophysical Research: Planets 10.1029/2018JE005563

 solar radiation pressure, and the position of the asteroid on its orbit with
 respect to the Sun, as shown on Figure 5.
 When < 1, the trajectory of ISD grains is an hyperbola with the Sun
 as focus, with the combination of radiation pressure and gravity result-
 ing in a net attractive radial force. The ISD grains, albeit slower than in
 the pure gravitative case ( = 0), can always reach any position of Ceres
 on its orbit. The impact velocity of ISD grains with < 1 is modulated
 by the relative motion of Ceres to the ISD stream. The apparent disconti-
 nuities in impact speed (e.g., at true anomaly ≈280◦ on the blue curve of
 Figure 4) is due to the passage of Ceres behind the Sun, with respect to
 the ISD stream, and to the convention in our numerical code to take the
 ISD interception trajectory located on the same side of the Sun than the
 intercepting body. In the case where > 1, however, so-called exclusion
Figure 4. Impact velocity of interstellar dust (ISD) grains on Ceres as zones form behind the Sun (as seen from the ISD downstream direction),
function of the asteroid's position on its orbit, parameterized by the where ISD grains cannot penetrate. The boundaries of those exclusion
true anomaly. The different line colors correspond to different values. zones are determined by the value (see Figure 5). The apparent discon-
Black stands for = 1, blue for = 0.2, and yellow for = 1.3. The gap in
 tinuities of the impact velocities of ISD grains with = 1.3 on Figure 4 is
true anomaly observed for the yellow curve corresponds to the ISD
exclusion zone (see text), while the discontinuity in impact speed for the explained by the crossing of Ceres of the corresponding boundaries.
blue curve is due to the passage of Ceres “behind” the Sun, with respect to
 We summarize in Table 4 some results from the simulations performed
the ISD stream (see text).
 for each asteroid. For the three values, we indicate the minimum
 and maximum impact speed in [km/s] expected from the asteroid apex

 Figure 5. The trajectory of Ceres is plotted (plain line) in an inertial frame on panel a), centered on the Sun, with the
 +X axis corresponding to the downstream interstellar dust (ISD) direction in the ecliptic frame, and +Z (toward the
 reader), being the orthogonal component of the ecliptic north direction on +X. +Y completes the right-handed frame.
 The dashed lines indicate the boundaries of the exclusion zones carved by the solar radiation pressure, whose
 boundaries depend on the grain values. The panels (b–d) show in the same frame the hyperbolic trajectories of ISD
 particles impacting Ceres, for different values of the parameter. The blue and black vectors indicate, respectively, the
 heliocentric velocity of Ceres and of the ISD particle, and the red vector represents the impact velocity vector of the
 dust grain on Ceres.

ALTOBELLI ET AL. 1051
Journal of Geophysical Research: Planets 10.1029/2018JE005563

Table 4
Summary of the ISD Impact Speed and Kinetic Energy Flux Ranges Along the Orbit of the Different Asteroids for Different Values of the Solar Radiation
Pressure-to-Gravity Ratio ( )
 = 0.2 =1 = 1.3
 V min-max Ek min-max V min-max Ek min-max V min-max Ek min-max
 (km/s) (eV·cm−2 ·s−1 ) (km/s) (eV·cm−2 ·s−1 ) (km/s) (eV·cm−2 ·s−1 )
EROS 7.3 - 55.3 8.3E+01 - 4.7E+03 18.0 - 74.1 3.9E+03 - 6.6E+05 0.0 - 43.3 0.0E+00 - 4.8E+02
HUNGARIA 8.0 - 45.8 1.0E+02 - 3.2E+03 18.1 - 56.6 3.9E+03 - 3.8E+05 0.0 - 40.5 0.0E+00 - 4.2E+02
VESTA 6.6 - 45.5 6.8E+01 - 3.2E+03 16.8 - 54.8 3.4E+03 - 3.6E+05 0.0 - 40.9 0.0E+00 - 4.3E+02
LUTETIA 4.1 - 42.3 2.6E+01 - 2.8E+03 15.1 - 50.5 2.7E+03 - 3.1E+05 0.0 - 38.5 0.0E+00 - 3.8E+02
PHOCAEA 4.7 - 42.2 3.4E+01 - 2.7E+03 16.8 - 50.1 3.4E+03 - 3.0E+05 0.0 - 38.4 0.0E+00 - 3.8E+02
HC82 19.9 - 82.9 6.1E+02 - 1.1E+04 25.4 - 117.6 7.7E+03 - 1.7E+06 0.0 - 48.0 0.0E+00 - 5.9E+02
ASTRAEA 10.4 - 48.2 1.7E+02 - 3.6E+03 18.0 - 59.4 3.9E+03 - 4.2E+05 0.0 - 42.5 0.0E+00 - 4.6E+02
GANYMED 9.4 - 36.0 1.4E+02 - 2.0E+03 16.8 - 51.4 3.4E+03 - 3.2E+05 0.0 - 33.1 0.0E+00 - 2.8E+02
EUNOMIA 7.0 - 42.0 7.5E+01 - 2.7E+03 15.4 - 51.9 2.8E+03 - 3.2E+05 0.0 - 38.0 0.0E+00 - 3.7E+02
PALLAS 14.9 - 46.2 3.4E+02 - 3.3E+03 21.4 - 58.5 5.5E+03 - 4.1E+05 0.0 - 40.7 0.0E+00 - 4.2E+02
CERES 9.5 - 45.3 1.4E+02 - 3.2E+03 17.6 - 54.6 3.7E+03 - 3.6E+05 0.0 - 40.8 0.0E+00 - 4.3E+02
KORONIS 8.4 - 43.3 1.1E+02 - 2.9E+03 16.5 - 51.9 3.3E+03 - 3.2E+05 0.0 - 39.4 0.0E+00 - 4.0E+02
EOS 7.2 - 41.5 8.1E+01 - 2.7E+03 15.8 - 48.6 3.0E+03 - 2.8E+05 0.0 - 38.2 0.0E+00 - 3.7E+02
THEMIS 11.2 - 44.9 1.9E+02 - 3.1E+03 17.9 - 53.6 3.8E+03 - 3.4E+05 0.0 - 40.8 0.0E+00 - 4.3E+02
HYGIEA 10.1 - 43.6 1.6E+02 - 2.9E+03 17.6 - 51.0 3.7E+03 - 3.1E+05 0.0 - 40.1 0.0E+00 - 4.1E+02
ALAUDA 10.9 - 42.2 1.8E+02 - 2.7E+03 17.9 - 49.4 3.8E+03 - 2.9E+05 0.0 - 38.7 0.0E+00 - 3.8E+02
GRIQUA 6.1 - 38.8 5.8E+01 - 2.3E+03 13.8 - 51.0 2.3E+03 - 3.1E+05 0.0 - 35.4 0.0E+00 - 3.2E+02
SYLVIA 8.7 - 40.5 1.2E+02 - 2.5E+03 16.5 - 47.1 3.3E+03 - 2.7E+05 0.0 - 37.6 0.0E+00 - 3.6E+02
HILDA 10.6 - 40.8 1.7E+02 - 2.6E+03 17.3 - 46.5 3.6E+03 - 2.6E+05 0.0 - 38.2 0.0E+00 - 3.7E+02

 direction along its orbit. Zero impact velocities for =1.3 indicate that there are parts of the orbit where the
 corresponding ISD grains cannot reach the asteroid, as can be seen on the plot for the relevant asteroid on
 Figures A20-A38. Indicative minimum and maximum kinetic energy fluxes along the orbit are also provided
 (in [eV·cm2 ·s−1 ])—but those values must be considered with caution, because the mass an ISD impactor
 associated to a given value depends on an ISD grain constitutive model. In those models, there are gener-
 ally two mass values corresponding to one value (see, e.g., Figure 2 of Kimura et al., 2003). In this work,
 for the purpose of supporting space weathering studies, we report the kinetic energy flux in Table 4 derived
 from the higher mass value solution, because, for the same value (and hence impact velocity), large grains
 will deliver more kinetic energy. For each value we used the upper solution for the mass of the silicate
 ISD grain models consistent with recent Cassini-CDA measurements (Altobelli et al., 2016, their Figure 3).
 The corresponding grains mass ranges are, roughly, M > 10−14 kg for ≤ 0.2, 10−16 kg < M < 10−14 kg for
 0.2 < < 1 and 5·10−17 kg < M < 10−16 kg for > 1. Finally, to provide an upper value for the kinetic
 energy flux of impactors described by their value, we have done the following simplification, which we
 believe is sufficient for the purpose of this study: Considering the ISD mass distribution and flux values
 reported by (Krüger et al., 2015), we apply a flux of 5·10−5 m−2 /s to the particles with = 1.3, 10−5 m−2 /s to
 the particles with = 1 and 10−6 m−2 /s to the particles with = 0.2.

 5. Discussion
 We have performed simulations of interstellar and interplanetary dust (from JFCs and asteroid sources)
 impacts on asteroids representative of different dynamical groups in order to quantify the mass-dependent
 impact speeds, the relative abundance of different impactor populations as defined by the IMEM model, and
 the total mass and kinetic energy flux received by the asteroids. The simulations have been performed for
 all bodies such as to cover a full orbit around the Sun. For each asteroid, and each position on its orbit, the
 maximum values from all possible radiant directions have been chosen. We discuss the model limitations
 for our study, before focusing on our results.

ALTOBELLI ET AL. 1052
Journal of Geophysical Research: Planets 10.1029/2018JE005563

 5.1. Model Limitations
 Dust particles released by highly eccentric and highly inclined comets, such as Halley-type comets (HTCs)
 or Oort Cloud-type comets (OCCs), are not included in the current version of the IMEM model and therefore
 not considered for detailed flux and impact velocity computations. Those cometary sources can produce dust
 populations on retrograde orbits (heliocentric inclination larger than 90◦ ). Retrograde populations released
 by HTCs were shown to contribute by less than 10% to the zodiacal cloud brightness, using different models
 and calibration methods (Nesvorný et al., 2010; Pokorný et al., 2014). Despite the smaller abundance of dust
 from HTCs compared to the abundance of dust populations released by JFCs, highly inclined HTC grains
 will impact prograde asteroids with higher impact speed and are therefore efficient at delivering kinetik
 energy to the asteroids surfaces. Recent work has demonstrated that retrograde IDPs of HTC of OCC origin
 must be the dominant producers of ejectas on the lunar surface and on the surface of asteroids near 1 AU
 (Szalay & Horányi, 2015, 2016). Owing to the high speed and retrograde orbits of those particles, retrograde
 particles will deposit their energy onto the asteroids surfaces facing the apex direction.
 The inclusion of retrograde dust populations (from HTCs or OCCs) in numerical models like IMEM has
 suffered in the past decades from the relatively low statistics of observations to support the models calibra-
 tion (e.g., the lack of direct in situ characterization of retrograde populations by dust instruments on-board
 spacecraf in the inner solar system; Altobelli et al., 2007). While a next version of the ESA micrometeoroid
 model (IMEM2), considering HTCs sources, is currently being developed, preliminary results show that
 the impact speed of HTC-type dust can reach up to three times the values of JFC particles, for a total HTC
 dust abundance being only 1% of the JFCs dust abundance in the inner solar system. This value is signifi-
 cantly lower than the 10% abundance at 1 AU reported by Nesvorný et al. (2010)—confirmed by Pokorný
 et al. (2014) to be an upper limit value. For our purpose of evaluating the impact speed and kinetic energy
 flux range on the surface of asteroids, we consider the 1% and 10% values to be the lower (upper) limit of
 HTC abundance in the inner solar system, and we assume an upper limit of 3 times the JFC impact velocity
 values for all asteroids studied in this work (except, of course, for the retrograde asteroid 2009-HC82). Fur-
 thermore, if we assume the mass distribution of the grains released by HTCs to be the same than those of
 JFCs, HTC dust will deliver between 3% and 30% of the JFC dust contribution in terms of particle and mass
 flux, and between 0.3 and 3 times the JFC dust kinetic energy. The dominance of the apex source reported
 by Szalay and Horányi (2015) suggests that the retrograde dust contribution must be in fact on the higher
 side compared to the contribution by prograde dust, but for the purpose of this paper, a conservative esti-
 mate of the retrograde dust impact characteristics can be simply obtained by applying those factors to the
 JFC dust simulation results discussed in the next paragraphs.

 5.2. Simulation Results
 For a given dust population, the variability of the impact speed and fluxes (mass and kinetic energy) appears,
 as expected, to depend primarily on the asteroids heliocentric orbital elements (semimajor axis, inclination,
 and eccentricity). For all asteroids considered in this work, the highest impact speeds are reached by the
 JFC dust populations (CC or CPR), ranging between 15 and 30 km/s for prograde asteroids (i.e., having an
 inclination lower than 90◦ with respect to the ecliptic plane). This finding is consistent with the fact that
 grains from JFCs are released by their parent bodies on orbits with larger eccentricities and inclinations
 values compared to the eccentricities and inclinations of the orbits of the impacted asteroids, resulting in
 high relative velocities. Dust populations released by asteroidal sources, in turn, impact prograde asteroids
 with significantly lower impact speeds, ranging between 2 to 10 km/s for asteroids with low to moderate
 eccentricities and inclinations. This is qualitatively consistent with the fact that large grains produced by
 fragmentation of larger bodies within the main belt (AC type in our modeling) will yield the lowest impact
 speed as they tend to remain on orbital elements close to those of their parent body and will therefore keep
 low relative speeds with respect to other main belt objects. In turn, asteroids with either large eccentric-
 ities or inclinations, or both, will tend to be impacted by IDPs of cometary of asteroidal origin at similar
 impact speeds, primarily driven by the difference of the asteroid's own orbital elements (and hence higher
 relative velocity) compared to those of the bulk of the different dust populations. This effect is particularly
 pronounced for the retrograde, highly eccentric asteroid 2009-HC82, for which all dust populations appear
 to have nearly the same impact speed along the asteroid's orbit (see relevant plot in Appendix A1).

ALTOBELLI ET AL. 1053
Journal of Geophysical Research: Planets 10.1029/2018JE005563

 For all simulated asteroids, the relative contribution of dust of cometary (JFCs) origin (in terms of particle
 flux) is larger than the asteroidal one by about 1 order of magnitude when the asteroid is located within the
 ecliptic plane (near its ascending and descending orbital nodes—those regions correspond to the transition
 between the thick and thin lines on the plots in Appendix A1, upper plots of Figures A1-A19). The flux of
 cometary impactors can even exceed by multiple orders of magnitude the asteroidal flux for asteroids with
 inclined orbits, when the body is located outside of the ecliptic plane (see, e.g., in Figure A10, left panel,
 the strong reduction of the asteroidal flux for Pallas when located at 100–200◦ or 300–360◦ true anomaly,
 corresponding to, respectively, high northern and southern ecliptic latitudes). The higher cometary particle
 flux in the two main mass range domains of the model (see section 3) implies overall higher mass fluxes of
 cometary dust impacting the asteroids surface than asteroidal dust. This conclusion holds for all main belt
 and NEO asteroids studied in this work. As we have selected bodies with orbital elements covering a wide
 range of observed asteroids, the cometary dust contribution is very likely to dominate the mass influx onto
 the surface of all bodies of the inner solar system. This point would be in agreement with Nesvorný et al.
 (2010) who had concluded that dust from JFCs contribute most to the mass influx of micrometeoroids at the
 Earth.
 The contribution of ISD has been evaluated for all asteroids along their orbits. Due to the strong anisotropy
 of the ISD flux, there are strong variations of the impact velocities as function of the true anomaly of the
 impacted body. Grains small enough such that the solar radiation pressure exceeds the solar gravity (grains
 with >1) are not able to reach the asteroid during some part of its orbit (see, e.g., in Figure 4, yellow curve,
 no grain with =1.3 can reach Ceres when located at 220–350◦ true anomaly). For some combinations of
 and true anomaly, ISD impactors can yield the highest impact velocity values for all asteroids, exceeding
 the highest impact speed of cometary grains. However, the flux of kinetic energy deposited by ISD grains on
 the asteroid surfaces is significantly smaller than the one of IDPs, because, on the one hand, the flux of ISD
 grains in the inner solar system, typically between 10−5 and 10−4 m2 /s (Krüger et al., 2015; Landgraf et al.,
 2003; Mann, 2010), will be lower than the asteroidal and cometary grain contribution in the low mass regime
 (mass lower than 10−6 g; see section 3) and, on the other hand, the most abundant ISD grains have orders
 of magnitude less mass (typically, around 10−13 g) than the IDPs contributing most to the kinetic energy
 flux (typically around 10−4 –10−3 g; see Figure A11, and all right panels on the plots in Appendix A1). As a
 result the upper limit for kinetic energy deposition by ISD does not exceed a few 105 eV·cm2 ·s−1 for most
 asteroids (Table 4), while we find a flux of IDP kinetic energy in a range of 106 − 108 eV·cm2 ·s−1 (Table 3),
 with only the retrograde NEO asteroid 2009-HC82 impacted by a maximum kinetic energy flux up to almost
 1011 eV·cm2 ·s−1 .
 Considering the left panels of the plots in Appendix A1, showing the impact energy per IDP mass bin, we
 observe that the highest impact energy is not necessarily deposited by the largest grain size, on the one
 hand, because, according to our simulations, the larger grains tend to have the lowest impact velocities on
 the main belt asteroids, and, on the other hand, because the grain size abundance (volume number density)
 tends to naturally follow a power law distribution with negative index, both for cometary and asteroidal
 grains (Grün et al., 1985). As a result, there is a mass range where the combination of impact velocity, mass,
 and particle number flux yields the highest kinetic energy flux. For asteroids in the inner main belt (low
 semimajor axis values), the maximum energy is deposited by grains in the 10−4 –10−3 g mass range, while
 for asteroids located further away, larger grains (10−3 –10−2 g) appear to deliver most of the energy.
 In addition, Figure A11 (and all similar plots in Appendix A1) shows that among the large grains bringing
 most of the kinetic energy, those of cometary origin will largely dominate the overall kinetic energy influx.
 Indeed, combining the up to about a factor of five higher impact speed values for cometary grains compared
 to asteroidal grains, and the higher cometary dust impact mass flux (about 2 orders of magnitude larger
 for most asteroids), the kinetic energy flux deposited by cometary dust will be at least 2,500 times larger
 than the asteroidal one. This fact, combined with the knowledge gained by the Rosetta mission on cometary
 dust, allows to better constrain the requirements on laboratory studies reproducing weathering of asteroid
 surfaces through micrometeoroids. In particular, the type of large cometary dust grains that deposit most of
 the kinetic energy in our simulations would consist of fractal aggregates with high porosity (Fulle & Blum,

ALTOBELLI ET AL. 1054
Journal of Geophysical Research: Planets 10.1029/2018JE005563

 2017). Those aggregates fragment easily (Hornung et al., 2016) and are made of individual compact grains
 with a bulk density of 800 to 3,000 kg/m3 (Fulle et al., 2015), whose mechanical properties are described in
 Hilchenbach et al. (2017).
 Overall, the upper energy flux deposited by JFC and asteroidal dust (as well as HTC dust) is orders of mag-
 nitude lower than the one deposited by agents such as solar photons (from IR to hard X-ray; see Table 1
 of Bennett et al., 2013). From the same table we see that the dust energy flux is comparable to the energy
 flux brought by solar wind heavy ions and electrons or galactic cosmic rays, while remaining 1 or 2 orders
 of magnitude lower than the proton energy flux (depending on solar activity). We note that the solar wind
 carries another space weathering agent potentially effective at depositing kinetic energy on asteroids' sur-
 faces: the so-called nanodust grains, as characterized by the Stereo spacecraft (JuháSz & HoráNyi, 2013).
 Those grains have their origin near the Sun and have masses between 10−22 and 10−20 kg, resulting in a high
 charge-to-mass ratio that makes them behave dynamically like ions carried with the solar wind at very high
 speeds (reaching up to a few hundreds of km/s near 1 AU). Assuming an upper limit value for their impact
 velocity on asteroid surfaces of 400 km/s, each nanograins will carry an impact energy ranging from 5.107
 to 5.109 eV. Owing to their generation process near the Sun, the flux of those particles will decrease with the
 heliocentric distance squared, but they may remain an important agent of space weathering of airless bod-
 ies in the inner solar system. Because of their very low mass and size, however, impacts of nanodust grains
 may induce surface alterations more similar to the ones caused by heavy ions, rather than the gardening
 and melting caused by micrometeoroid impacts.
 Considering our simulated dust flux values, the total amount of exogenous material delivered to an asteroid
 surface appears very small: a typical mass flux value of 10−16 g·cm−2 ·s−1 will yield about only 10−3 g/cm2 per
 My, which is in turn the short time scale needed by the solar wind implantation to give its final color to a
 freshly exposed asteroid surface (Vernazza et al., 2009). Thus, it does not appear plausible, considering the
 low dust flux, that surface coating by exogenous material deposited by dust grains can compete with solar
 wind to determine the spectral characteristics of the asteroids surfaces. Furthermore, a dust coating mech-
 anism, with a main cometary dust contribution, cannot account for the diversity of spectral characteristics
 encountered for the asteroids across the main belt (DeMeo & Carry, 2013, 2014).
 In turn, dust impacts are more likely to provide a microscale surface rejunevation process, by gardening and
 vaporization of the surface upper layers, exposing material previously hidden from the solar wind irradi-
 ation, and therefore counteracting the effect of solar wind implantation. The production of impact ejectas
 upon micrometeoroid bombardment has been estimated in details for any airless body near 1 AU by Szalay
 and Horányi (2016). The detailed amount of surface material ejected upon impact of a meteoroid depends
 on the surface and impactor's composition, impact speed, and impact angle and was shown experimentally
 to account for up to 1,000 times the impactor's mass for ice and silicate mixtures (Koschny & Grün, 2001). In
 addition, using the formulae of Ahrens and O'Keefe (1987), Berezhnoy and Klumov (2008) calculated that
 the amount of vapor released during an (vertical) impact on the surface of Mercury is 10 times the impactor's
 mass at 20 km/s and 60 times the impactor's mass at 60 km/s. Micrometeoroids impacting the asteroid sur-
 face over billions of years are therefore playing a key role in the erosion and gardening of the body's surface,
 despite their relatively low kinetic energy flux. Finally, hypervelocity dust impacts onto a surface will send
 shock waves through the asteroid's upper layers, resulting in high-pressure metamorphism of its surface and
 subsurface material Tschauner et al. (2018).
 Whatever the weathering effects of dust impacts on asteroid surfaces may be, Figure 6 shows that all aster-
 oids with a prograde orbit should be affected similarly. Indeed, the impact speed and kinetic energy flux
 range values of the JFC dust grains (the main contributors in our model), as function of the semimajor axis
 of the selected asteroids, show a large overlap for all asteroids with a prograde orbit. While the differences
 in eccentricities and inclinations result in wider ranges, the impact velocity and flux appear independent
 of the semimajor axis. This finding suggests that the spectral differences between different prograde aster-
 oid families in the inner solar system cannot be directly linked to orbital element dependent variations of
 the dust bombardment of their surfaces. The situation may be different, however, for the comparatively rare
 asteroids with retrograde orbits (such as 2009 HC82), for which the much higher dust impact speed and flux
 may induce a more intense gardening of their surface.

ALTOBELLI ET AL. 1055
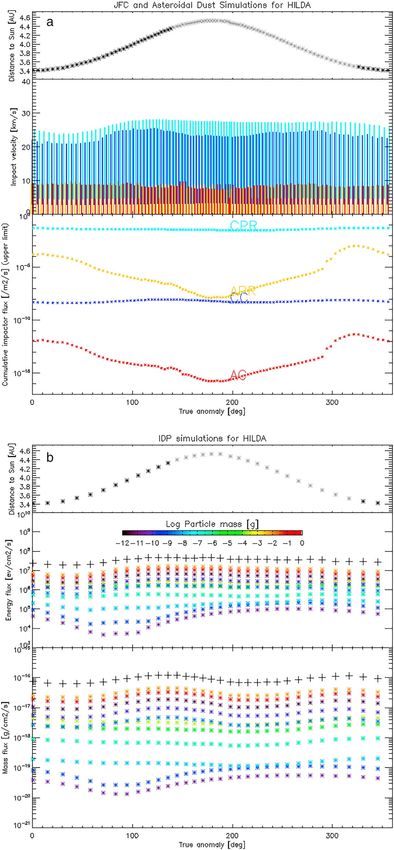
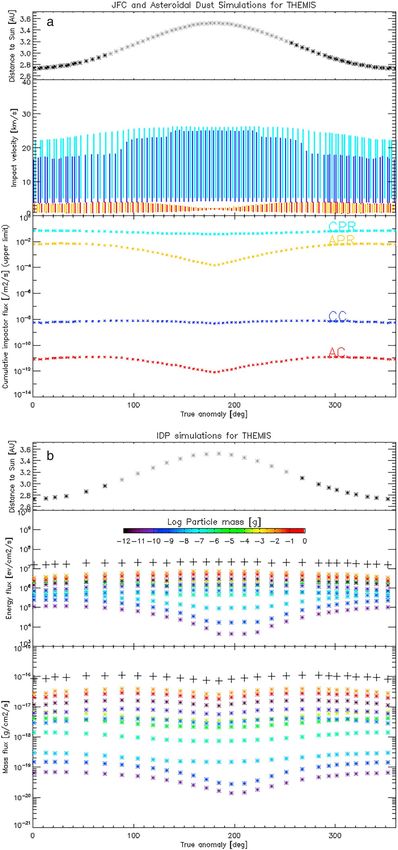
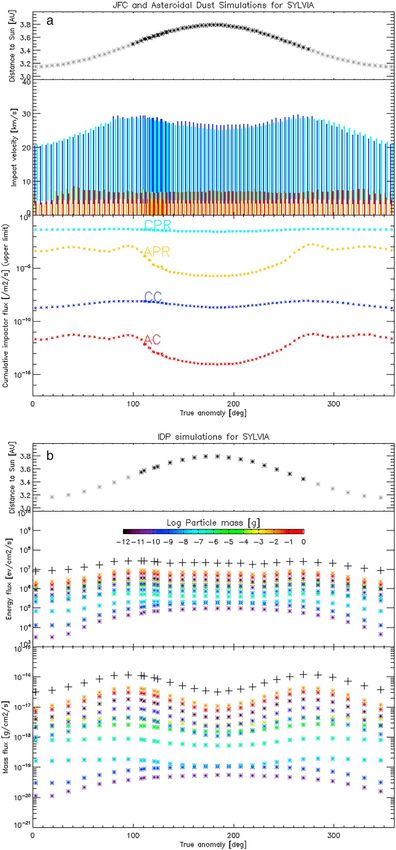
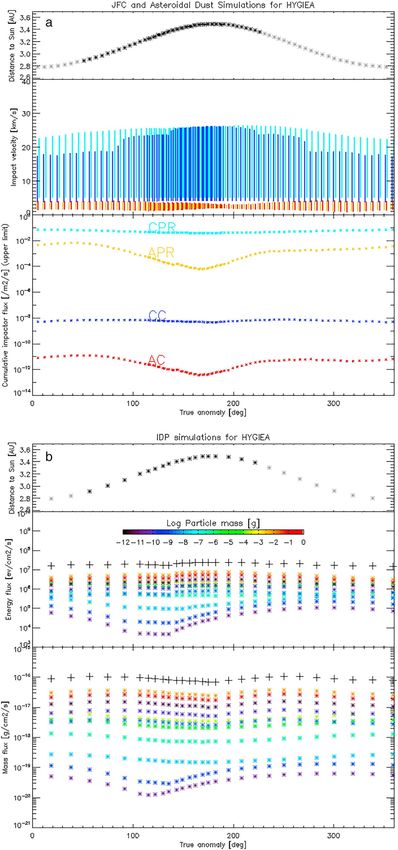
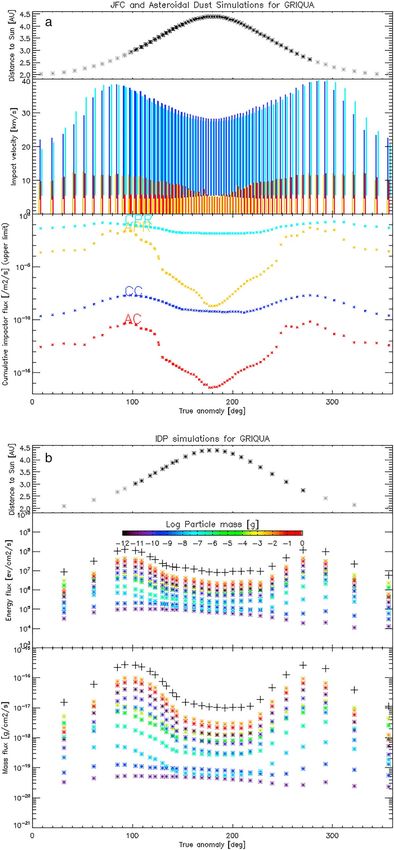
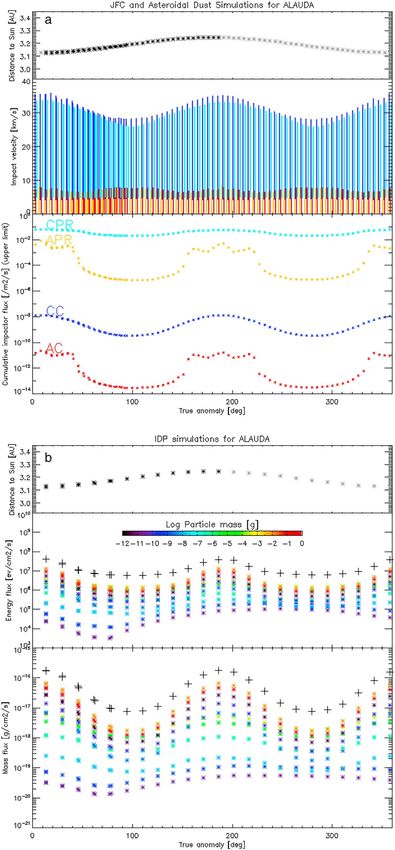
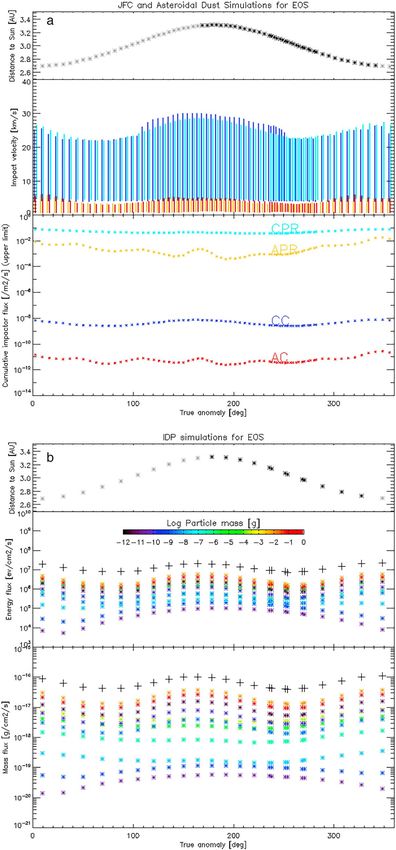
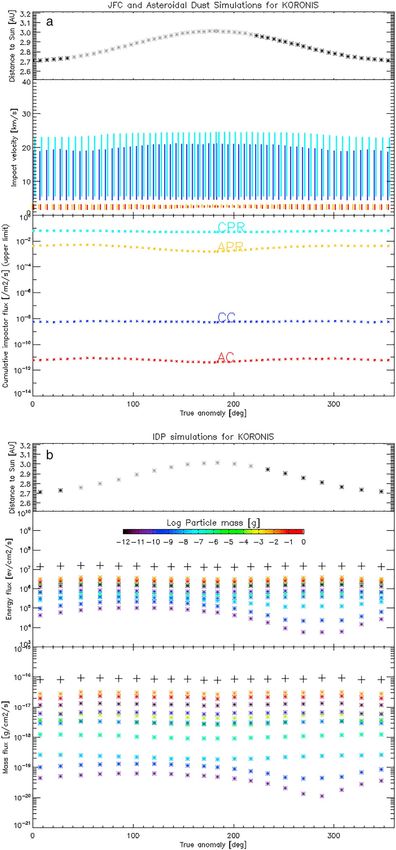
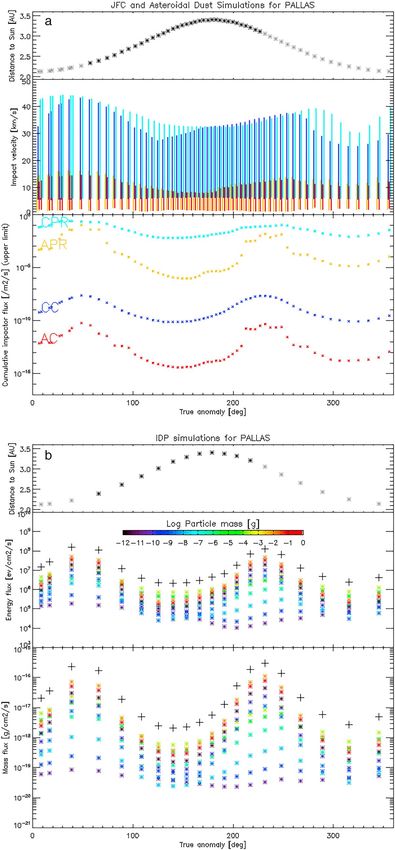
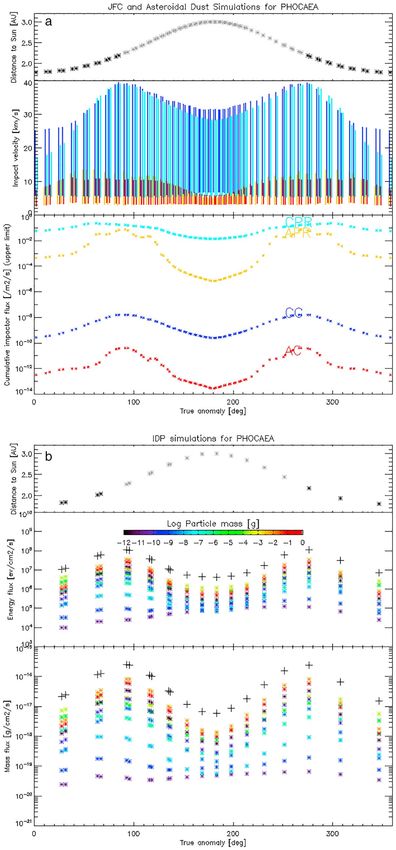
Journal of Geophysical Research: Planets 10.1029/2018JE005563

 Figure 6. Range values of impact velocity (upper panel) and kinetic energy flux (lower panel), as function of the
 semimajor axis, for all asteroids selected in this work.

 6. Conclusion
 Simulating experimentally the effect of micrometeoroid impacts on asteroid surfaces is an important step to
 understand how dust acts as a space weathering agent to modify the body's surface physical properties. The
 modeling presented in this work constrained the impact speed and kinetic energy flux regimes to be repro-
 duced in the laboratory to perform impact experiments as close as possible to the conditions that prevail
 for main belt and near Earth asteroids. The numerical simulations performed in this work were performed
 using the micrometeoroid environment model (IMEM) developed for ESA to reproduce the contribution of
 dust from asteroids and JFCs in the inner solar system and a separate ISD model. The contribution of dust
 from HTCs was evaluated based on preliminary runs of the latest version of IMEM, under development, and
 by scaling the JFC contribution. The asteroids used for the simulations were chosen such as to represent
 the diversity of the asteroid dynamical families of the main belt and near Earth. The simulations show the
 variation of the dust impact speed, dust mass influx, and kinetic energy as function of the position of the
 asteroids on their orbits. The dust impactors appear to deposit orders of magnitude less energy than solar
 radiations. While their contribution in terms of energy is comparable to heavy solar wind ions and elec-
 trons, the kinetic energy is deposited onto the surface over a much larger cross section and may therefore
 lead to different alteration processes, related in particular to the dissipation of the energy within the surface
 material through the formation of an impact plasma and shock waves. We quantified the relative contribu-
 tion of the dust impactor of interstellar, cometary, and asteroidal origin, showing that large cometary grains
 dominate the kinetic energy flux. This fact has important implications for constraining future laboratory
 impact simulations since the properties of large cometary grains have been investigated in details by the
 Rosetta mission. Overall, we find that the dust bombardment of asteroids with prograde orbits in the inner
 solar system varies little with the asteroid's orbital elements, suggesting that dust impacts are unlikely to be
 responsible for the surface spectral trends, although they may counteract by surface gardening the effect of
 solar wind implementation.

 Appendix A: Annex
 In this annex we provide figures for each asteroid discussed in this work, summarizing for IDPs and ISD the
 computations of the dust impact velocity and flux values along the asteroid's trajectory. The flux computa-
 tions for IDPs include the particle's flux, as well as the mass and kinetic energy flux (see caption of Figure
 A1 for details). Figures A1–A19 show the computations for IDPs, while Figures A20–A38 show the impact
 velocity computations for ISD.
 A1. Individual Asteroid Simulations for IDPs

ALTOBELLI ET AL. 1056
Journal of Geophysical Research: Planets 10.1029/2018JE005563

 Figure A1. Upper plot:flux and velocity of dust impactors along the asteroid's orbit. Top: distance of the asteroid to the
 Sun in astronomical units as function of its true anomaly. The gray (black) symbols indicate when the asteroid is
 located at southern i ecliptic latitude. Middle: impact speed range. Bottom: maximum cumulative particle flux. The red
 and yellow colors in the middle and lower panels stand for the asteroidal asteroid collision (AC) and asteroid
 Poynting-Robertson (APR) dust populations, and the dark and light blue curves for the cometary comet collision (CC)
 and comet Poynting-Robertson (CPR) dust populations. Bottom plot: maximum kinetic energy and mass flux delivered
 by Jupiter family comets (JFCs) and asteroidal dust along the asteroid's orbit, as function of the body true anomaly. The
 distance to the Sun is plotted in the upper panel; the kinetic energy and mass flux are plotted in the middle and lower
 panels, respectively. The upper panel shows the body distance to the Sun, with the black (gray) symbols indicating the
 northern (southern) latitudes of the orbit. The different colors stand for the different dust mass bins (from 10−12 to 1 g)
 for which the simulations have been performed. The black crosses in the middle and lower panel indicate the total
 maximum kinetic energy and total mass flux, respectively. IDP = interplanetary dust population.

ALTOBELLI ET AL. 1057
Journal of Geophysical Research: Planets 10.1029/2018JE005563

 Figure A2. See Figure A1 caption.

ALTOBELLI ET AL. 1058
Journal of Geophysical Research: Planets 10.1029/2018JE005563

 Figure A3. See Figure A1 caption.

ALTOBELLI ET AL. 1059
Journal of Geophysical Research: Planets 10.1029/2018JE005563

 Figure A4. See Figure A1 caption.

ALTOBELLI ET AL. 1060
Journal of Geophysical Research: Planets 10.1029/2018JE005563

 Figure A5. See Figure A1 caption.

ALTOBELLI ET AL. 1061
Journal of Geophysical Research: Planets 10.1029/2018JE005563

 Figure A6. See Figure A1 caption.

ALTOBELLI ET AL. 1062
Journal of Geophysical Research: Planets 10.1029/2018JE005563

 Figure A7. See Figure A1 caption.

ALTOBELLI ET AL. 1063
Journal of Geophysical Research: Planets 10.1029/2018JE005563

 Figure A8. See Figure A1 caption.

ALTOBELLI ET AL. 1064
Journal of Geophysical Research: Planets 10.1029/2018JE005563

 Figure A9. See Figure A1 caption.

ALTOBELLI ET AL. 1065
Journal of Geophysical Research: Planets 10.1029/2018JE005563

 Figure A10. See Figure A1 caption.

ALTOBELLI ET AL. 1066
Journal of Geophysical Research: Planets 10.1029/2018JE005563

 Figure A11. See Figure A1 caption.

ALTOBELLI ET AL. 1067
You can also read