SOUTH DAKOTA TEACHER COMPENSATION REVIEW BOARD - JULY 16, 2021 - SD ...
←
→
Page content transcription
If your browser does not render page correctly, please read the page content below

SOUTH DAKOTA
TEACHER COMPENSATION REVIEW BOARD
JULY 16, 2021
BLUEPRINT OF PRESENTATION First Look at Core Data Blue Ribbon Task Force – Status of Recommendations Current Data Enrollment and Teacher Workforce Projections Opportunities for the Board
SDCL 1-45-39.Teacher Compensation Review Board.
   There is hereby created the Teacher Compensation Review Board within the Department of
Education. The board shall review teacher compensation, including comparable wage indexes, in
surrounding states at the completion of every three school years. The board will report its findings to
the Governor and the Legislature no later than September 30, 2018, and by September thirtieth in
every third year thereafter.

 The initial appointment of the members to the board shall be made no later than March 1, 2018. The
members shall serve a term of three years.
 The board shall consist of nine members to be appointed as follows:
  (1) Three members of the South Dakota Senate appointed by the president pro tempore of the
      Senate, no more than two of whom may be from the same political party;
  (2) Three members of the South Dakota House of Representatives appointed by the speaker of the
      House of Representatives, no more than two of whom may be from the same political party; and
  (3) Three members appointed by the Governor.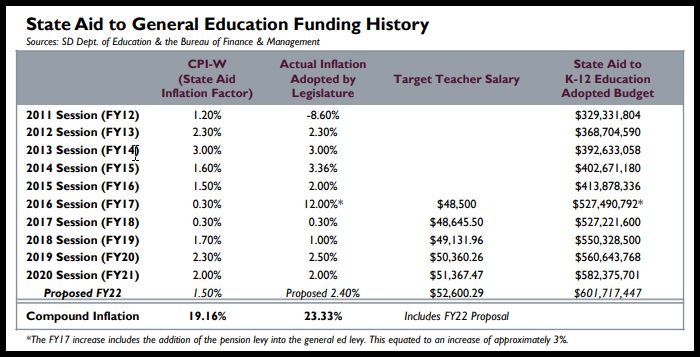
TEACHER COMPENSATION
Salary Increases Over Time
1.South Dakota’s average teacher salary in 2013-14 was $40,023. This ranked last among the 50 states and the District of Columbia.
Average SD Adjusted by
NEA BEA
Target Teacher Salary Teacher Salary BEA Regional Price
Ranking Ranking
(NEA) Parities
School Year 2013-14 $40,023 51
School Year 2014-15 $40,935 51
School Year 2015-16 $42,025 51
School Year 2016-17 $48,500 $46,922 48 $53,203.85 38
School Year 2017-18 $48,645.50 $47,631 47 $53,698.99 39
School Year 2018-19 $49,131.96 $48,204 48 $54,839.59 40
School Year 2019-20 $50,360.26 $48,984 50 $55,790.43 45
School Year 2020-21 $51,367.47 $49,993*
Percent Increase from SY 2017 – SY 2021 5.91% 6.54%
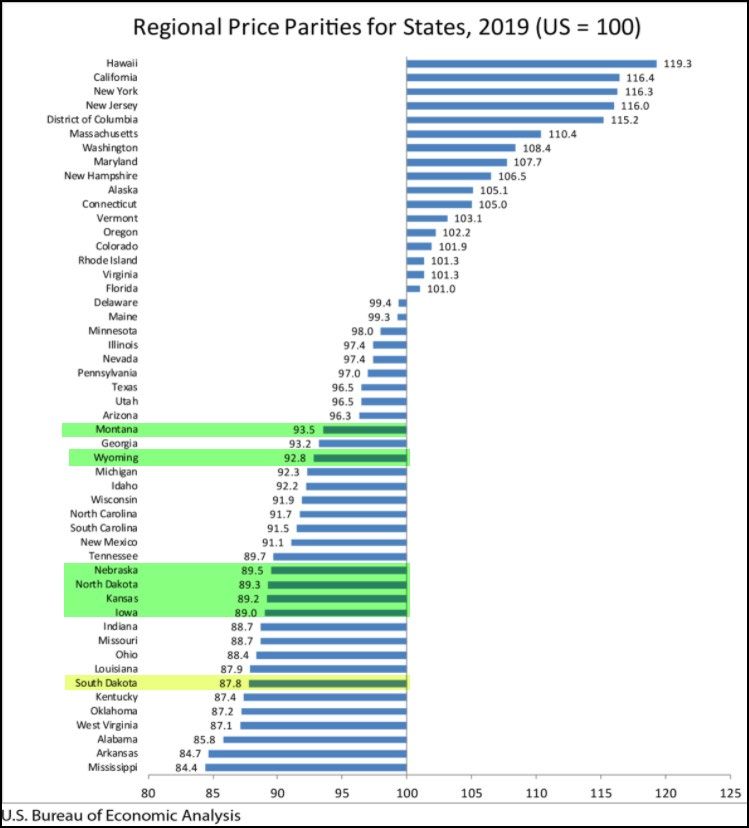
*NEA estimateREGIONAL PRICE PARITIES Regional price parities (RPPs) measure the differences in price levels across states and metropolitan areas for a given year and are expressed as a percentage of the overall national price level. RPPs allow comparisons of buying power across the 50 states and the District of Columbia for a given year. Price levels are expressed as a percentage of the overall national level. Source: Bureau of Economic Analysis
HOW DOES TEACHER COMPENSATION IN SD COMPARE
    TO NEIGHBORING STATES?*
                                     Average Teacher Salary                                                                Adjusted for Regional Price Parity
  $70,000                                                                                     $70,000.00

  $60,000                                                                                     $60,000.00

  $50,000                                                                                     $50,000.00

  $40,000                                                                                     $40,000.00

  $30,000                                                                                     $30,000.00

  $20,000                                                                                     $20,000.00

  $10,000                                                                                     $10,000.00

      $0                                                                                          $0.00
            South Dakota   Montana   North Dakota   Nebraska     Iowa   Minnesota   Wyoming                South Dakota   Montana   North Dakota    Nebraska    Iowa   Minnesota   Wyoming

                                             2018-19   2019-20                                                                            2018-19     2019-20
                                                                                                                                                                                             7

Source: National Education Association and Bureau of Economic Analysis
HOW DOES TEACHER COMPENSATION IN SD COMPARE
TO NEIGHBORING STATES?
Average Teacher Salary
$70,000
$58,663 $59,786
$60,000 $58,184
$55,267
$52,135 $53,525
$48,984
$50,000
$40,000
$30,000
$20,000
$10,000
$0
South Dakota Montana North Dakota Nebraska Iowa Minnesota Wyoming
2018-19 2019-20
8
Source: National Education AssociationHOW DOES TEACHER COMPENSATION IN SD COMPARE
TO NEIGHBORING STATES?
Adjusted for Regional Price Parity
$70,000.00
$65,375.28 $64,424.57
$61,750.84
$59,938.41 $59,860.20
$60,000.00 $55,790.43 $55,759.36
$50,000.00
$40,000.00
$30,000.00
$20,000.00
$10,000.00
$0.00
South Dakota Montana North Dakota Nebraska Iowa Minnesota Wyoming
2018-19 2019-20
9
Source: National Education Association and Bureau of Economic AnalysisSOUTH DAKOTA IS WITHIN $5K
OF BEING RANKED MUCH HIGHER (2019/20)
$65,000
$60,000
$55,000 $53,907 $54,095 $54,096 $54,150 $54,256
$53,329 $53,525
$52,875
$51,745 $51,862 $52,135
$51,320 $51,566
$50,456 $50,782 $50,817
$50,238
$50,000 $48,984 $49,102
$46,843
$45,000
$40,000
Mississippi South Florida West Arkansas Arizona Missouri Kansas Louisiana Indiana Tennessee Montana Idaho South North Kentucky Alabama Oklahoma North New
Dakota Virginia Carolina Dakota Carolina Mexico
Source: National Education AssociationTHE PICTURE CHANGES WHEN SALARIES ARE ADJUSTED FOR
REGIONAL PRICE PARITY (2019/20)
$65,000
$63,048
$61,678 $62,037
$59,570 $59,938
$60,000 $58,664 $59,051 $59,038
$58,337 $58,283
$57,679 $57,534 $57,817
$57,291 $57,348
$55,501 $55,790 $55,759
$55,000
$52,733
$50,000 $48,616
$45,000
$40,000
Mississippi South Florida West Arkansas Arizona Missouri Kansas Louisiana Indiana Tennessee Montana Idaho South North Kentucky Alabama Oklahoma North New
Dakota Virginia Carolina Dakota Carolina Mexico
Source: National Education Association and Bureau of Economic AnalysisSOUTH DAKOTA’S RANKING INCREASES WITH RPP ADJUSTMENT
(2019/20)
$65,000
$63,048
$61,678 $62,037
$59,570 $59,938
$60,000 $58,664 $59,038 $59,051
$58,283 $58,337
$57,534 $57,679 $57,817
$57,291 $57,348
$55,501 $55,759 $55,790
$55,000
$52,733
$50,000 $48,616
$45,000
$40,000
Florida Arizona Mississippi Montana South Missouri Idaho Kansas West Tennessee South Indiana Louisiana New North Arkansas North Kentucky Oklahoma Alabama
Dakota Virginia Carolina Mexico Carolina Dakota
Source: National Education Association and Bureau of Economic AnalysisCOMPARABLE WAGE INDEX – UPPER MIDWEST REGION
Average Teacher Salary Comparable Salary
Source: Bureau of Economic Analysis – Regional Price Parities (Comparable Wage
Source: NEA
Index for Teachers)
1.05 1.05
1.00 1.00
0.95 0.95
0.90 0.90
0.85 0.85
0.80 0.80
0.75 0.75
0.70 0.70
2015-16 2016-17 2017-18 2018-19 2019-20 2015 2016 2017 2018 2019
South Dakota Iowa Nebraska Montana South Dakota Iowa Nebraska Montana
Wyoming Minnesota North Dakota Wyoming Minnesota North DakotaSD SALARY RANGES FOR OCCUPATIONS
WITH COMPARABLE REQUIREMENTS
$40,000 $50,000 $60,000 $70,000 $80,000 $90,000 $100,000 $110,000
Mean Salary $71,940
Architecture and Engineering Occupations
Mean Salary $66,540
Business and Financial Operations
Occupations
Mean Salary $42,670
Community and Social Service Occupations
Mean Salary $70,000
Computer and Mathematical Occupations
Mean Salary $43,680
Educational Instruction and Library
Occupations
Mean Salary $73,010
Healthcare Practitioners and Technical
Occupations
Mean Salary $57,970
Life, Physical, and Social Science Occupations
Mean Salary $109,890
Management Occupations
Mean Salary $43,770
Protective Service Occupations
Mean Salary $42,910
Sales and Related Occupations
*SOC - Standard Occupational Classification
For more information about the wage estimates, please visit https://www.bls.gov/oes/current/oes_abo.htm.
Source: U.S. Bureau of Labor Statistics. Provided by Labor Market Information Center, South Dakota Department of Labor and Regulation, April 2021.RESULTS
SOUTH DAKOTA
BLUE RIBBON TASK-FORCERECOMMENDATION: NEW FUNDING FORMULA
Result: All 1. Adopt a new formula based on a statewide target for statewide average
teacher salary of $48,500 and maintain the average statewide student-to
recommendations have teacher ratio at approximately 14.1
been followed and enacted.
2. Replace current small school adjustment with a sliding scale, depending
on school enrollment, for the target student-to-teacher ratio.
3. Retain the current statutory minimum inflation factor of 3% or inflation,
whichever is less in the new formula.
4. Reevaluate teacher salaries every three years to assure South Dakota
remains competitive with surrounding states.
5. No change to the Limited English Proficiency Adjustment
6. No change to the sparsity formulaRECOMMENDATION: NEW FUNDING FOR TEACHER SALARIES Result: All 1. At least $75 million in new ongoing funding for teacher salaries recommendations have 2. Use existing funds to the greatest extent possible been acted on. Ongoing 3. Increase the state sales and use tax for additional ongoing revenue funding for teacher salaries is $67 million.
RECOMMENDATION: ACCOUNTABILITY
Result: Both 1. Adopt mechanisms to monitor the implementation of the new formula
recommendations have been 2. Develop benchmarks, in particular for average teacher salaries to ensure
followed and enacted. goals are met
SDCL 1-45-38. School Finance Accountability Board.
There is hereby created the School Finance Accountability Board within the Department of Education. The board shall consist of five members appointed by the
Governor.
The members shall serve a term of four years.
The board may recommend that the provisions of § 13-13-73.5 be waived for a school district if the district can demonstrate that its lowest monthly general cash fund
cash balance percentage is the result of special circumstances.
The board may recommend that a penalty against a school district imposed under § 13-13-73.6 be waived, in whole or in part, if the district can demonstrate that its failure
to comply with § 13-13-73.6 is due to special circumstances.
The School Finance Accountability Board shall promulgate rules pursuant to chapter 1-26 to establish the appeals process provided for in § 13-13-73.6, and to establish the
factors that may be considered in considering a waiver requested by a school district, which shall include the impact of retirements.
The Joint Committee on Appropriations or the Interim Committee on Appropriations shall review any waivers of § 13-13-73.5 or 13-13-73.6 recommended by the School
Finance Accountability Board. For a waiver recommended by the board under this section, the committee may provide any suggested change to the waiver. Not more than
thirty days following receipt of a suggested change from the committee, the board may amend the recommended waiver in accordance with the suggested change and shall
resubmit the recommended waiver. The Joint Committee on Appropriations or the Interim Committee on Appropriations shall approve, amend, or deny any waiver
recommended by the board. The Department of Education shall annually report to the Governor and the Legislature the information collected pursuant to §§ 13-8-47 and
13-13-73.6.RECOMMENDATION: VOLUNTARY SHARED SERVICES Result: The recommendations 1. Authorize funds to expand shared state services have been acted on. 2. Create incentives for sharing personnel
RECOMMENDATION: STATEWIDE INNOVATIONS IN LEARNING Result: All 1. Double the e-Learning Center’s Course Offerings recommendations have 2. Allocate funds for innovation in virtual education and customized learning been acted on. 3. Appropriate $1 million in ongoing funds for learning innovation
RECOMMENDATION:
CHANGES FOR CAPS ON GENERAL FUND RESERVES
Result: All 1. Reinstate statutory caps on school district general fund reserves
recommendations have 2. Develop a tiered reserve caps system based on school enrollments
been followed and enacted 3. Districts that exceed the reserve fund cap have its state aid payment
reduced on a dollar-by-dollar basis
4. Phase in the caps over a three-year period
5. Establish an oversight committee to help districts with phase-in strategies
for reserve caps, and assist when unique circumstances arise that may
make the caps unrealisticGENERAL FUND BALANCES HAD BEEN DECREASING
$300,000,000
$244,634,946
$250,000,000 $235,845,320
$226,115,607 $223,268,773
$220,804,633 *
$210,499,181
$197,603,725 $199,093,135 $194,485,202
$200,000,000 $188,289,484
$150,000,000
$100,000,000
$50,000,000
$0
2011 2012 2013 2014 2015 2016 2017 2018 2019 2020 *
Source: South Dakota Department of Education School Financial Data
*COVID-19 affected school spending in the 4th quarter of the fiscal year.RECOMMENDATION:
ELIMINATE THE PENSION LEVY
1. Eliminate the pension levy. The general education levies should be
Result: The
increased by 0.263 mills which would raise the same amount that the
recommendation has been pension levy currently raises
followed and enacted. • The pension levy has been eliminated
• General education levies have been increased by 0.263 millsRECOMMENDATION: EQUALIZE OTHER REVENUES
Result: The 1. Equalize other revenue to establish greater equity by equalizing future
growth in other revenue sources
recommendation has been
6 revenue sources, equalized like property tax:
followed and enacted.
Gross receipts tax on utilities
Local revenue in lieu of taxes
County apportionment of revenue from traffic fines
County revenue in lieu of taxes
Renewable energy (wind & solar) taxes
Bank franchise tax
Have the look & feel of a state tax. Funds are maintained locally
(counts toward local effort).RECOMMENDATION:
TEACHER RECRUITMENT & RETENTION
Result: All 1. Full reciprocity be granted to teachers who are certified to teach in
another state
recommendations have been
2. Appropriate funds of $1 million annually for mentoring
followed and enacted.
3. Create a New Teachers Academy
4. Restore funding for National Board CertificationRECOMMENDATION: PHASED-IN APPROACH
Result: All 1. Fully implement all recommendations at the end of three years.
recommendations have been 2. With a phased-in approach, two points must be considered:
enacted. a) $75 million in new funding for teacher salaries is intended as a
supplement to the current appropriations for schools. If the new
funding is phased-in over a period of years, it should be in addition to
the inflationary increases required under current law.
b) Target teacher salary of $48,000 was chosen based on the most
recent available data. If the reforms are phased-in over a period of
years, the target salary must be increased in order to remain
competitive with surrounding states.WHERE ARE WE NOW? CURRENT DATA ON THE EDUCATOR WORKFORCE
THE PERCENTAGE OF TEACHERS
  BY GRADE BAND HAS BEEN STABLE OVER TIME
  100%
                       10%                             12%                        13%                         13%                          13%
   90%

   80%
                       26%                             25%                        25%                         25%                          25%
   70%

   60%
                       18%                             18%                        18%                         18%                          18%
   50%

   40%

   30%
                       47%                             45%                        45%                         44%                          44%
   20%

   10%

    0%
                     2016-17                         2017-18                     2018-19                     2019-20                      2020-21
              Elementary Teachers FTE (Includes Kindergarten)        MS/JH Teachers FTE    High School Teachers FTE    Special Education Teachers FTE

Source: South Dakota Department of Education Personnel Record Form
10% OF SOUTH DAKOTA TEACHERS LEFT
THEIR POSITIONS AFTER THE 2019-20 SCHOOL YEAR
12%
10%
10% 9%
8%
8%
6%
6%
4% 4% 4%
4% 3% 3%
2%
2% 1%
0%
0%
Percent of Prior Year Staff Staff Leaving Education in Staff Moving to a Different Other
South Dakota Position in Education
SY 2017-18 SY 2018-19 SY 2019-20
Source: Personnel Record FormRETIREMENT & MOVEMENT TO ANOTHER SCHOOL REPRESENT NEARLY
60% OF WHY TEACHERS LEAVE THEIR POSITIONS
100%
11%
90% 20% 16%
25% 22% 24% 22%
80% 21%
70% 24%
22% 21%
22% 22%
22%
60%
Percentage
27%
50% 24%
25% 23% 23%
21% 21%
40%
10%
30% 8% 8% 10%
9% 10% 8%
10%
20% 10% 6% 7% 11% 10%
9%
8% 9% 15% 9%
10% 8% 5% 6%
7% 9% 8% 7% 8% 6% 8%
0%
2014-15 2015-16 2016-17 2017-18 2018-19 2019-20 2020-2021
School Year
Employed in another school/district outside of state Family/personal relocation
Other employment in education Other employment outside of education
Retirement Employed in another accredited SD school/district
Other/unknown
Source: SD DOE Personnel Record FormTHE NUMBER OF EDUCATOR CERTIFICATES PROCESSED HAS INCREASED EACH YEAR Source: South Dakota Educator Certification System
THE NUMBER OF SOUTH DAKOTA GRADUATES AND APPLICANTS
 FROM OUT-OF-STATE IS INCREASING
700                                                                                                        661
600                                                                           562
                    520                                                                                    248
500
                    139                             409                        198
400
                                                    137
300

200                 381                                                                                    413
                                                                               364
                                                    272
100

 0
                  FY 2018                         FY 2019                    FY 2020                      FY 2021
                               Initial Educators (New Graduates)   Out-of-State Educators (Reciprocity)

 Source: South Dakota Department of Education
BASELINE TEACHER SALARY
SY 2016 $32,546
SY 2017 $37,520
SY 2018 $38,187
SY 2019 $38,838
SY 2020 $39,594
$25,000 $27,000 $29,000 $31,000 $33,000 $35,000 $37,000 $39,000 $41,000
Source: South Dakota Department of EducationTHERE ARE MORE TEACHER PREPARATION GRADUATES THAN INITIAL CERTIFICATES PROCESSED Initial (Initial Educator and COVID-19) 381 272 364 Source: South Dakota Educator Certification System *First year Presentation College no longer offered an educator preparation program
THE MAJORITY OF SOUTH DAKOTA HIGH SCHOOL GRADUATES
WHO COMPLETE A TEACHER EDUCATION ARE PLACED
                            BOR Teacher Graduate Placements From SD High School
                                               FY 2017-2020
     100%

                   15%                         11%
     90%                                16%                                   20%    18%
                                                                       26%
     80%

     70%

     60%

     50%

                   85%                         89%
     40%                                84%                                   80%    82%
                                                                       74%
     30%

     20%

     10%

      0%
                  BHSU                  DSU    NSU                     SDSU   USD   System
                                                 Placed   Not Placed

     Source: South Dakota Board of Regents
SOUTH DAKOTA EDUCATION GRADUATES FROM BOARD OF REGENTS
UNIVERSITIES WERE PLACED IN SOUTH DAKOTA AT A HIGHER RATE THAN
OTHER MAJOR AREAS IN 2019
100%
90%
80.4% 80.2% 79.3% 79.2%
80%
73.9%
70% 64.7%
60%
49.5%
50%
40%
31.9%
30% 25.3%
21.9% 22.8%
18.4% 18.5%
20%
10% 7.8%
0%
Education Engineering Business Health Professions Computer and Info Agriculture Public Admin and
Svcs Social Svcs
From SD Not From SD
Source: SDBOR Graduate Placement DashboardUNFILLED VACANCIES AT THE BEGINNING OF 20-21 WERE HIGHER
THAN THE 4-YEAR AVERAGE IN ALMOST ALL CATEGORIES
11.48
Elementary 12.15
9.87
Special Education 10.74
7.53
Non-Credit 11.92
6.11
Miscellaneous 14.77
5.86
Language Arts 6.73
4.37
Math 5.9
4.13
Music 4.8
4.06
CTE 4.36
3.14
Science 6.43
2.27
Fine Arts 4.51
1.94
World Language 2.04
1.44
Social Science 2.72
0.85
PE-Health 1.97
0.28
English Language… 0.12
Computers 0.13
0.5
0 2 4 6 8 10 12 14 16
Four Year Average 2020-21THE NUMBER OF JOB POSTINGS FOR TEACHERS IS INCREASING
SOUTH DAKOTA EDUCATOR JOB POSTINGS
Highest Categories of Positions Posted on the Teacher Placement Center
2018 2019 2020 2021
April
SPED/Early Childhood 62 SPED/Early Childhood 39 SPED/Early Childhood 53 SPED/Early Childhood 71
Elementary Teachers 61 Elementary Teachers 37 Elementary Teachers 52 Elementary Teachers 69
Math 27 Art/Music/Health/PE 26 CTE 35 Math Teachers 52
Administrators 26 English/Language Arts 24 Art/Music/Health/PE 28 English/Language Arts 52
August
SPED/Early Childhood 10 SPED/Early Childhood 8 SPED/Early Childhood 8
Elementary Teachers 7 Elementary Teachers 5 Elementary Teachers 4
English /Language Arts 5 Art/Music/Health/PE 5 Math Teachers 4
Administrators 4 Technology Education 4 Speech Pathologist 4
SOURCE: Associated School Boards of South Dakota – Teacher Placement CenterASBSD TEACHER PLACEMENT DATA
600
551
493
500
398
400
347
300
254
168
200
88 89
100
65
47
0
Month Sept Oct Nov Dec Jan Feb Mar April May June July Aug
2016-2017 2017-2018 2018-2019 2019-2020 2020-2021CTE, LANGUAGE ARTS, AND ELEMENTARY POSITIONS HAVE SEEN THE
HIGHEST NUMBERS OF ‘PLANS OF INTENT*’ FOR THE PAST 3 YEARS
140
131
120
108 107
97 99
100
81
77 77
Head Count
80
70 70 70
64 63 63 63 64
59 59
60
49 50
46
41 42
39
40 35 33
32
20
0
2017-18 2018-19 2019-20
School Year
Career and Technical Education Language Arts Science Elementary Social Science Special Education (Non-Core) PE-Health Math Other
Source: South Dakota Personnel Record Form
*Plan of Intent represents a teacher who is teaching an assignment they are either unauthorized or an uncertified instructor.PROJECTIONS PROJECTED DATA ON THE EDUCATOR WORKFORCE
FIVE-YEAR TEACHER WORKFORCE PROJECTION
5 YEAR STUDENT ENROLLMENT PROJECTION

                                        Average   Lower    Upper
                                 2021   136349    135284   137415
                                 2022   136986    135158   138814
                                 2023   137745    135292   140199
                                 2024   138536    135499   141573
                                 2025   139304    135626   142981
SUMMARY OF ENROLLMENT AND WORKFORCE PROJECTIONS • The trend for student enrollment shows an increase of 800 students per year. • The trend for teacher workforce shows an increase of 40 teachers per year. • The ratio of additional students to additional teachers is 20:1. • The target ratio is 14:1.
FUTURE PRIORITIES & OPPORTUNITIES
HOW CAN WE PLAN FOR THE FUTURE?
WHAT ARE THE IMPLICATIONS OF KEY TRENDS IN OUR DATA? Growth of large and mid-sized cities Increasing demand for SPED and EL teachers Potential increase in student enrollment in the next 5 years Ongoing trend of increasing teacher salaries among neighboring states Reciprocity data reflect more teachers coming into South Dakota from out of state
WHAT SHORT-TERM INVESTMENTS CAN WE MAKE THAT WILL HAVE
SUSTAINABLE IMPACT ON THE WORKFORCE?
ARP STATE PLAN A3. Continuing to address issues of educator recruitment and retention Within the last six years, South Dakota has taken proactive steps to address educator recruitment and retention challenges. The pandemic likely will exacerbate some of those challenges; therefore, understanding the pandemic’s true impact on the education workforce will be paramount. That understanding will drive innovative strategies that will target both traditional students coming out of teacher preparation programs and individuals interested in entering the teaching field through an alternative pathway. The department expects strategies in this area to build upon existing efforts established in 2016 with passage of historic legislation (i.e., Blue Ribbon Task Force on Teachers and Students). That legislation resulted in a half- cent sales tax with revenues going to the state’s school funding formula – specifically, to support raising teacher salaries statewide. In related recruitment/retention efforts, the department developed a statewide mentoring program for first- and second-year teachers; facilitated entry into the teaching profession through alternative certification routes; partnered with School Administrators of South Dakota to mentor new principals; and partnered with Black Hills State University to offer two cohorts of paraprofessionals working in high-needs schools the opportunity to earn a teaching degree and certification.
ARP STATE PLAN
F. Supporting the Educator Workforce
The Department recognizes the toll that the COVID-19 pandemic has taken on the Nation’s educators as well as students. In
this section, SEAs will describe strategies for supporting and stabilizing the educator workforce and for making staffing
decisions that will support students’ academic, social, emotional, and mental health needs.
Long before the pandemic, South Dakota has struggled with teacher shortages. In 2015, South Dakota created the Blue Ribbon Task Force on
Teachers and Students to address the challenge comprehensively as a state. A 26-member panel studied related issues and brought forward
recommendations during the 2016 legislative session. Legislation established a Teacher Compensation Review Board, which is to meet every
three years to review the state’s progress as it relates to educator salaries, recruitment and retention.That board is set to meet summer
2021 and provide recommendations for next steps.
The department anticipates additional recruitment/retention strategies to be recommended by the Teacher Compensation Review
Board, which is meeting this summer. Strategies will likely build upon programs implemented successfully through the 2016 Blue Ribbon
legislation mentioned previously (e.g., statewide mentoring program for 1st year teachers; partnership with School Administrators of South
Dakota for new administrator mentoring; National Board Certification cohorts).The department expects to work with educator preparation
programs and professional education organizations to establish an updated, multi-dimensional approach to educator workforce needs.ADDITIONAL DATA NEEDED For the next steps in recommendations. For the final report.
BOARD INPUT ON FRAMEWORK FOR FINAL REPORT
PUBLIC COMMENT
OPEN BOARD DISCUSSION
BACKGROUND INFORMATION
RECOMMENDATION: NEW FUNDING FORMULA BACK
1. Adopt a new formula based on a statewide target for statewide average teacher salary of
$48,000 and maintain the average statewide student-to-teacher ratio at approximately 14.1
Has a new formula been adopted? Yes The target teacher salary was established in the new formula at $48,500 and has
increased each year since implementation.
Is the funding formula still based on a per No
student allocation (PSA)?
Has the statewide average teacher salary Yes 2015-16 avg teaching salary = $42,025
reached $48,000? 2016-17 avg teaching salary = $46,922
2017-18 avg teaching salary = $47,631
2018-19 avg teaching salary = $48,204
2019-20 avg teaching salary = $48,984
Has the avg student to teacher ratio stayed Yes 2015-16 ratio = 14.1
at approximately 14.1? 2016-17 ratio = 14.1
2017-18 ratio = 14.1
2018-19 ratio = 14.2
2019-20 ratio = 14.2RECOMMENDATION: NEW FUNDING FORMULA BACK
2. Replace current small school adjustment with a sliding scale, depending on school
enrollment, for the target to student-to-teacher ratio.
Has the small school Yes The new funding formula was initially based on a target statewide average teacher salary of $48,500
adjustment been (increased annually by CPI for 2022 = $52,600.29) and works as follows:
replaced with the
recommended For each district, calculate a target student-to-teacher ratio, based on a sliding scale by student enrollment.
formula from the
Blue-Ribbon Task The law provides the following sliding scale for the target ratio, based on student enrollments (districts use the
Force? current year state aid fall enrollment):
• Less than 200 – 12 students to 1 teacher
• Between 200 & 600 – Sliding scale between 12 to 1 and 15 to 1
• Greater than 600 – 15 to 1
This sliding scale retains the same enrollment thresholds as the small school adjustment of the previous
funding formula.
The formula does not require school districts to strictly meet the target ratio or to use a certain level of
funding for benefits and overhead costs. Those are merely used to calculate total need, and districts retain
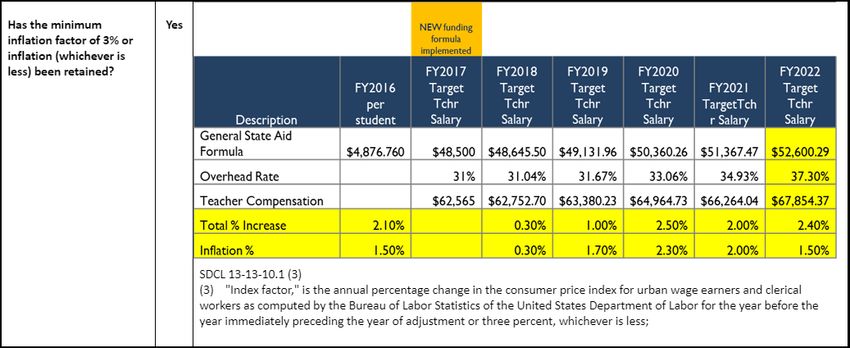
local control on how to use the dollars they receive.RECOMMENDATION: NEW FUNDING FORMULA BACK 3. Retain the current statutory minimum inflation factor of 3% or inflation, whichever is less in the new funding formula.
RECOMMENDATION: NEW FUNDING FORMULA                                                                                                                        BACK

4.Reevaluate teacher salaries every three years to assure South Dakota remains competitive with
surrounding states.
     Have teacher      Yes SDCL 1-45-39 requires the Teacher Compensation Review Board to review teacher compensation every three years.
     salaries been
                            1-45-39. Teacher Compensation Review Board.
     reevaluated for
                                There is hereby created the Teacher Compensation Review Board within the Department of Education. The board shall
     comparison to          review teacher compensation, including comparable wage indexes, in surrounding states at the completion of every three school
     surrounding            years. The board will report its findings to the Governor and the Legislature no later than September 30, 2018, and by
     states?                September thirtieth in every third year thereafter.

                               The initial appointment of the members to the board shall be made no later than March 1, 2018. The members shall serve a
                            term of three years.

                                The board shall consist of nine members to be appointed as follows:
                                (1) Three members of the South Dakota Senate appointed by the president pro tempore of the Senate, no more than two
                                      of whom may be from the same political party;

                                (2)    Three members of the South Dakota House of Representatives appointed by the speaker of the House of
                                      Representatives, no more than two of whom may be from the same political party; and

                                (3) Three members appointed by the Governor.

                            Source: SL 2016, ch 83, § 22.
RECOMMENDATION: NEW FUNDING FORMULA BACK
5. No change to the Limited English Proficiency Adjustment
Have there been any changes to the No No changes have been made as recommended by the Blue Ribbon Panel Task Force.
Limited English Proficiency
SDCL 13-13-10.1 (2D)
Adjustment?
(2D) "Limited English proficiency (LEP) adjustment," is calculated by multiplying 0.25 times the number of
kindergarten through twelfth grade students who, in the prior school year, scored below level four on the
state-administered language proficiency assessment as required in the state's consolidated state application
pursuant to 20 USC § 6311(b)(7) as of January 1, 2013;
Have there been reviews to ensure Yes The exit criteria for English Learners (EL) is currently set at an overall composite score of 5.0. The current
this factor continues to align with formula for EL funding only allows for additional funding to districts for those EL students who score less
than an overall composite score of 4.0. A data analysis will be completed to determine if a change is needed
actual costs?
to the funding formula so all students in the EL program are funded.RECOMMENDATION: NEW FUNDING FORMULA BACK
6. No change to the Sparsity Formula
Have there been any No Recognizing the unique challenges faced by extremely rural, isolated schools, districts that meet the definition of “sparse” receive
changes to the sparsity additional money outside of the formula. These districts are eligible for additional state dollars not to exceed $110,000 per district. If
the total appropriation for sparsity is less than the calculated amount for each district, the dollars available will be prorated to each
factor?
district.
The criteria for meeting the definition of “sparse” include:
State aid fall enrollment less than 500
•State aid fall enrollment per square mile of 0.5 or less
•School district area of 400 sq. miles or more
•Distance of at least 15 miles between a district’s secondary attendance center and that of an adjoining district
•Must operate a secondary attendance center
•Levies at the maximum levy for general fund purposes
Calculation of this additional aid is outlined in SDCL 13-13-79.
13-13-79. Distribution of funds to sparse school districts.
At the same time that state aid is distributed to school districts pursuant to §§ 13-13-10.1 to 13-13-41, inclusive, the secretary of the
Department of Education shall distribute funds to sparse school districts by multiplying the result of the calculation in either subdivision
13-13-78(2) or subdivision 13-13-78(3) by seventy-five percent of the per student equivalent as defined in § 13-13-10.1. However, no
sparse school district may receive a sparsity benefit that exceeds one hundred ten thousand dollars in any fiscal year.RECOMMENDATION: NEW FUNDING FOR TEACHER SALARIES
1. At least $75 Million in New Ongoing Funding for Teacher Salaries
Has at least $75 million in No. The final Based on the recommendations of the Blue Ribbon Task Force three bills passed the 2016 legislature (House Bill 1182,
new ongoing funding for estimate was Senate Bill 131 and Senate Bill 133) taking effect on July 1, 2016. House Bill 1182 included a half-cent increase in the state
$67 million sales tax, which took effect June 1, 2016. This was estimated to provide an additional $67 million for K-12 education, $36
teacher salaries been
million for property tax relief, and $3 million for technical institutes.
allocated?
The following bills were passed during the 2016 Legislative Session:
HB 1182
SB 131
SB 133
BACKRECOMMENDATION: NEW FUNDING FOR TEACHER SALARIES
2. Use existing funds to the greatest extent possible
Have existing funds continued to be used? Yes The South Dakota Department of Education continues to utilize all existing funds
BACKRECOMMENDATION: NEW FUNDING FOR TEACHER SALARIES
3. Increase the State Sales and Use Tax for Additional Ongoing Revenue
Were the state sales and use tax Yes, Sales Tax Based on the recommendations of the Blue Ribbon Task Force three bills passed the 2016
increased? legislature (House Bill 1182, Senate Bill 131 and Senate Bill 133) taking effect on July 1, 2016.
House Bill 1182 included a half-cent increase in the state sales tax, which took effect June 1,
2016. This was estimated to provide an additional $67 million for K-12 education, $36 million for
property tax relief, and $3 million for technical institutes.
The following bills were passed during the 2016 Legislative Session:
HB 1182
SB 131
SB 133
BACKRECOMMENDATION: ACCOUNTABILITY BACK
1. Adopt Mechanisms to Monitor the Implementation of the New Formula
Have mechanisms Yes Teacher Compensation:
to monitor the 13-13-73.6. Increases in teacher compensation.
implementation of The Department of Education shall calculate the following for each school district:
(1) The average teacher salary, based on data collected pursuant to §§ 13-8-47 and 13-3-51;
the new formula (2) The increase in local need pursuant to § 13-13-10.1, excluding any effect due to change in the school district's fall enrollment and less the amount of
been adopted? revenue generated in school fiscal year 2016 pursuant to § 13-10-6 as a percentage increase, from fiscal year 2016 to fiscal year 2017; and
(3) The increase in average teacher compensation as a percentage increase, as defined in § 13-8-47, from fiscal year 2016 to fiscal year 2017.
For each school district, the district's increase in average teacher compensation from fiscal year 2016 to 2017 shall be equal to at least eighty-five percent of the
district's increase in local need, as defined in subdivision (2), from fiscal year 2016 to fiscal year 2017 and, notwithstanding any negotiated agreement, at least
eighty-five percent of the increase in state aid to general education funding the school district receives for fiscal year 2017 less the amount of revenue
generated in fiscal year 2016 pursuant to § 13-10-6 shall be used to increase instructional salaries and benefits for certified instructional staff.
If a district fails to comply with the requirements of this section, state aid to general education funding to the district in fiscal year 2018 shall be decreased by an
amount equal to fifty percent of the amount calculated in subdivision (2). For fiscal years 2019, 2020, and 2021, if a district's average teacher compensation is
less than the district's average teacher compensation in fiscal year 2017, state aid to general education funding to the district in the following fiscal year shall be
reduced by an amount equal to five hundred dollars for each teacher employed in the school district.
A school district may request a waiver from any penalty imposed under this section from the School Finance Accountability Board.
Yes Excess Monthly Cash:
13-13-73.5. Reduction of state aid by subtracting allowable general fund cash balance from lowest general fund monthly cash balance.
Beginning on July 1, 2018, a school district's state aid for general education as calculated pursuant to § 13-13-73 shall be reduced by subtracting the allowable
general fund cash balance from the lowest general fund monthly cash balance. If the result is less than zero, the reduction equals zero.
A school district created or reorganized after July 1, 2016, is exempt from the reduction provided by this section for a period of three years immediately
following its creation.RECOMMENDATION: ACCOUNTABILITY BACK
2. Develop Benchmarks, in Particular for Average Teacher Salaries to Ensure Goals are Met
Have benchmarks been identified to ensure goals are met?
Yes
Benchmark 1: State Aid to General Education Funding
Benchmark 2: Teacher Compensation Report FY 2020 Teacher Compensation Summery
History of Teacher Compensation 2017-2020RECOMMENDATION: VOLUNTARY SHARED SERVICES BACK
1. Authorize Funds to Expand Shared State Services and Create Incentives for Sharing Personnel
Has funding been Yes Senate Bill 133 from the 2016 legislative session included an on-going appropriation to the South Dakota Department of
authorized to Education to provide two types of shared services: 1) those involving state-purchased goods and services provided to districts,
FY17 and 2) those involving district sharing employees. Grants were awarded to public school districts during the 2016-17 and 2017-18
expand shared Appropriation - school years. Details of the grants are available at https://doe.sd.gov/grants/sharedservices.aspx.
state services? $1,600,000
After the initial years, the interest in voluntary shared services via grants between school districts waned. At the same time,
districts expressed needs for state support for career counseling services at the middle and high school levels. The shared services
FY18-FY20
funding was shifted in 2018 to address that need. The Career Launch SD program, in partnership with the Department of Labor &
Appropriation -
Regulation (DLR), continues with high utilization. In addition, DLR has redirected some employment specialists’ time to support
$1,000,000
the Career Launch SD program.
FY21 Career Launch SD was established to increase student awareness about career opportunities and to help meet South Dakota’s
$600,000 dem and for a skilled workforce. The program’s staff assists schools in offering career exploration and career development
activities in classrooms. They also serve as a connection point between industry and schools to arrange work-based learning and
exploration opportunities for students.
In 2018, 12 FTE were supported between DOE and DLR funding for a pilot program. The pilot initially served four districts, but
expanded as demand grew. The scope of the program has broadened over the years to build schools’ own capacity to operate
work-based learning programs locally. Currently the program is statewide and offers districts a menu of services and resources to
complement the services directly provided to students and businesses.
Last year, nearly 70 school districts expressed an interest in Career Launch SD services. Even with the re-direction of state
resources for shared services, demand for the program outpaces the current staff capacity.RECOMMENDATION:
STATEWIDE INNOVATIONS IN LEARNING
1. Double the E-Learning Center’s Course Offerings
Have the e- Yes The E-Learning Center at Northern State
Learning University has more than doubled course
offerings and registrations since passage of the
Centers Course
Blue Ribbon legislative package. The additional
Offerings funding included in this legislation has allowed
increased? NSU E-Learning to serve as a safety net for
schools struggling to fill open teaching
positions. It has also ensured a continuity of
instruction, and pathway for schools to connect
students with high-quality instructors.
Upon receiving additional funding available
through passage of the Blue Ribbon legislative
package, the E-Learning Center at Northern State
University was able to increase its staffing which
allowed the development of 23 new courses. As
a result, the number of registrations for courses
has increased.
• Added 9 new teaching staff in 2016-17
• Added 1 additional teacher in 2017-18
BACKRECOMMENDATION:
STATEWIDE INNOVATIONS IN LEARNING
2. Allocate Funds for Innovation in Virtual Education and Customized Learning
Have funds been allocated for virtual education? Yes Funds for virtual education were included in the allocation for the E-Learning Center at Northern State
University. Refer to #1.
Have funds been allocated for customized learning? No Funds for customized learning were included in the allocation for learning innovations. Refer to #3.
BACKRECOMMENDATION:
STATEWIDE INNOVATIONS IN LEARNING
3. Appropriate $1 Million in Ongoing Funds for Learning Innovation
Was $1 million in funds appropriated for learning Yes Appropriated $1,000,000 in FY2017 for the classroom innovation grants. The ongoing general fund
innovation? appropriation was reduced to $0 in FY2018. The department granted $2,282,974 in two different
rounds to schools which comprised $1,000,000 from Classroom Innovations and remaining general
funds from the Shared Services grants. The Classroom Innovation grants were primarily used for training
in customized learning, technology, and Maker's Spaces.
July 18, 2016: Eighteen Classroom Innovation Grants were awarded a combined total of almost $1
million. The purpose of the grant program was to provide funding for developing teacher training and
classroom access to virtual education and customized learning tools.
December 12, 2016: Twenty-five Classroom Innovation Grants were awarded to South Dakota school
districts for a combined total of over $1.3 million.
Grant recipients launched a variety of projects including implementing customized learning models,
which personalize the teaching and learning experience; developing makerspaces and STEM labs
designed to encourage experimentation and hands-on learning; and creating online, digital curriculum
that meets state standards.
BACKRECOMMENDATION:
CHANGES FOR CAPS ON GENERAL FUND RESERVES
1. Reinstate Statutory Caps on School District General Fund Reserves
Have statutory caps been Yes SDCL 13-13-10.1 (8-10)
reinstated on school (8) "Monthly cash balance," the total amount of money for each month in the school district's general fund, calculated by adding all
district general cash deposits made during the month to the beginning cash balance and deducting all disbursements or payments made during the month;
balances?
(9) "General fund base percentage," is determined as follows:
(a) Forty percent for a school district with a fall enrollment as defined in subdivision (2A) of two hundred or less;
(b) Thirty percent for a school district with fall enrollment as defined in subdivision (2A) of more than two hundred but less than six
hundred; and
(c) Twenty-five percent for a school district with fall enrollment as defined in subdivision (2A) greater than or equal to six hundred.
When determining the general fund base percentage, the secretary of the Department of Education shall use the lesser of the school
district's fall enrollment as defined in subdivision (2A) for the current school year or the school district's fall enrollment from the previous
two years;
(10) "Allowable general fund cash balance," the general fund base percentage multiplied by the district's general fund expenditures in
the previous school year.
BACKRECOMMENDATION:
CHANGES FOR CAPS ON GENERAL FUND RESERVES
2. Develop a tiered reserve caps system based on school enrollments
Is the reserve cap a tiered system Yes SDCL 13-13-10.1 (9)
based on school enrollments?
(9) "General fund base percentage," is determined as follows:
(a) Forty percent for a school district with a fall enrollment as defined in subdivision (2A) of two
hundred or less;
(b) Thirty percent for a school district with fall enrollment as defined in subdivision (2A) of more than
two hundred but less than six hundred; and
(c) Twenty-five percent for a school district with fall enrollment as defined in subdivision (2A) greater
than or equal to six hundred.
When determining the general fund base percentage, the secretary of the Department of Education shall
use the lesser of the school district's fall enrollment as defined in subdivision (2A) for the current school year
or the school district's fall enrollment from the previous two years;
BACKRECOMMENDATION:
CHANGES FOR CAPS ON GENERAL FUND RESERVES BACK
3. Districts that exceed the reserve fund cap have state aid payment reduced on a dollar-by-
dollar basis
Is there a requirement that Yes 13-13-73.5. Reduction of state aid by subtracting allowable general fund cash balance from lowest general fund monthly cash
districts who exceed their reserve balance.
fund cap have the state aid
Beginning on July 1, 2018, a school district's state aid for general education as calculated pursuant to § 13-13-73 shall be reduced by
payment reduced? subtracting the allowable general fund cash balance from the lowest general fund monthly cash balance. If the result is less than zero, the
reduction equals zero.
A school district created or reorganized after July 1, 2016, is exempt from the reduction provided by this section for a period of three years
immediately following its creation.
Has this occurred? Yes DISTRICTS NOT RECEIVING STATE AID
SY 2018 SY 2019 SY 2020
Agar, Blunt, Onida X X X
Elk Mountain X X X
Hoven X X X
Lead Deadwood X
Plankinton* X
*Received general state aid and a portion of their excess cash balance was waived by SFAB
DISTRICTS APPLYING FOR WAIVERS
Arlington (the total excess was waived) x
Haakon (a portion of the excess was waived) x
Tripp Delmont x
DISTRICTS PENALIZED BUT DID NOT SUBMIT A WAIVER
Highmore-Harrold XRECOMMENDATION:
CHANGES FOR CAPS ON GENERAL FUND RESERVES
4. Phase in the Caps Over a Three-Year Period
If a reserve cap has been implemented, was there a phase Yes The excess cash calculation penalty was not effective until 2019.
in period as recommended?
BACKRECOMMENDATION:
CHANGES FOR CAPS ON GENERAL FUND RESERVES BACK
5. Establish an Oversight Committee to Help Districts with Phase-in Strategies for Reserve Caps,
and Assist When Unique Circumstances Arise that may Make the Caps Unrealistic
Has an oversight committee Yes 1-45-38. School Finance Accountability Board.
been created?
There is hereby created the School Finance Accountability Board within the Department of Education. The board shall consist of five
members appointed by the Governor. The members shall serve a term of four years.
The board may recommend that the provisions of § 13-13-73.5 be waived for a school district if the district can demonstrate that its
lowest monthly general cash fund cash balance percentage is the result of special circumstances.
The board may recommend that a penalty against a school district imposed under § 13-13-73.6 be waived, in whole or in part, if the
district can demonstrate that its failure to comply with § 13-13-73.6 is due to special circumstances.
The School Finance Accountability Board shall promulgate rules pursuant to chapter 1-26 to establish the appeals process provided for
in § 13-13-73.6, and to establish the factors that may be considered in considering a waiver requested by a school district, which shall
include the impact of retirements.
The Joint Committee on Appropriations or the Interim Committee on Appropriations shall review any waivers of § 13-13-73.5 or 13-13-
73.6 recommended by the School Finance Accountability Board. For a waiver recommended by the board under this section, the
committee may provide any suggested change to the waiver. Not more than thirty days following receipt of a suggested change from the
committee, the board may amend the recommended waiver in accordance with the suggested change and shall resubmit the
recommended waiver. The Joint Committee on Appropriations or the Interim Committee on Appropriations shall approve, amend, or deny
any waiver recommended by the board. The Department of Education shall annually report to the Governor and the Legislature the
information collected pursuant to §§ 13-8-47 and 13-13-73.6.RECOMMENDATION: ELIMINATE THE PENSION LEVY
1. Eliminate the Pension Levy. The General Education Levies Should be Increased by 0.263 Mills
Which Would Raise the Same Amount That the Pension Levy Currently Raises
Yes/No Outcome
Has the pension levy been eliminated? Yes
Have the general education levies been Yes
increased by 0.263 mills?
BACKRECOMMENDATION: EQUALIZE OTHER REVENUES
1. Equalize Other Revenue to Establish Greater Equity by Equalizing Future Growth in Other
Revenue Sources
Has other revenue been equalized? Yes Beginning in FY2018 the calculation of local effort included the phase-in of “other revenue” equalization.
These other revenues include:
• utility taxes (rural electric & telephone)
• revenue in lieu of taxes (local and county)
• county apportionment
• bank franchise
• wind farm taxes
Each school district has been assigned a hold harmless base amount, based on the greatest of its previous three
years of collections. This base will be stepped down over five years, at 20% per year.
Each year, any revenue collected beyond the “hold harmless base” will be counted as local effort and equalized
across districts through the funding formula. These revenue sources will be treated in the same way as local
property taxes. The new money will not offset state or local funding and will not take funds away from the state’s
education system. The state’s share of funding ratio will be adjusted so the state’s dollar amount contribution is
not reduced, and local property taxes not impacted.
BACKRECOMMENDATION: TEACHER RECRUITMENT & RETENTION
1. Full Reciprocity be Granted to Teachers Certificated to Teach in Another State
Yes/No Explain the Changes Based on changes, what are the results?
Can certified teachers in Yes In 2017, when the Educator Certification rules were overhauled, one of the The number of out-of-state educators requesting a
other states receive updates included new rules addressing reciprocity. These rules allow an South Dakota certificate have increased:
reciprocity in South Dakota educator who has received a teaching certificate from out-of-state to receive July 1, 2017 – June 30, 2018 = 144
a South Dakota certificate without passage of additional tests and July 1, 2018 – June 30, 2019 = 141
coursework if they meet the following requirements. July 1, 2019 – June 30, 2020 = 219
• Must have an active/valid out-of-state certificate
• Must complete South Dakota Indian Studies course. Can receive a
preliminary certificate for up to two years to allow time to complete
the course.
• If the out-of-state applicant has completed an out-of-state alternative
certification route, they must have 3 years of teaching experience to
qualify for reciprocity.
If the applicant does not have a valid out-of-state certificate, they can
receive a South Dakota educator certificate, however they must meet South
Dakota requirements to add an endorsement.
BACKRECOMMENDATION: TEACHER RECRUITMENT & RETENTION
2. Appropriate Funds of $1 Million Annually for Mentoring
BACKRECOMMENDATION: TEACHER RECRUITMENT & RETENTION
2. Appropriate Funds of $1 Million Annually for Mentoring
BACKRECOMMENDATION: TEACHER RECRUITMENT & RETENTION
2. Appropriate Funds of $1 Million Annually for Mentoring
BACKRECOMMENDATION: TEACHER RECRUITMENT & RETENTION
2. Appropriate Funds of $1 Million Annually for Mentoring
New Teacher Data
700 100.00%
90.00%
600
590 80.00%
558 549
500 542
70.00%
Number of New Teachers
60.00%
400 57.38%
50.00% New Teachers in Mentoring Program
300 43.53% Total Number of New Teachers
39.43% 311 40.00%
Percentage
200 30.51% 239 30.00%
220
180 20.00%
100
10.00%
0 0.00%
16-17 17-18 18-19 19-20
Program Years BACKRECOMMENDATION: TEACHER RECRUITMENT & RETENTION
3. Create a New Teachers Academy
Has a New Teachers Academy been created? Yes The New Teachers Academy is held each year in June. It is incorporated into the State Mentoring Program. The
academy has grown from 335 participates in SY 2016-17 to 968 participants in SY 2020-21.
BACKRECOMMENDATION – TEACHER RECRUITMENT & RETENTION
YEAR COUNSELORS TEACHERS TOTAL EXPENDED
1993 1 1 2 $0
4. Restore Funding for National Board Certification 1999 0 0 0 $0
2000 0 0 0 $0
2001 0 7 7 $0
2002 1 4 5 $0
2003 1 6 7 $15,400
2004 3 13 16 $24,563
Was funding for Yes In 2000, the South Dakota Legislature established a program that rewards 2005 0 7 7 $48,579
National Board public school teachers who earn National Board Certification by providing 2006 0 18 18 $55,444
Certification them with a stipend. This funding was discontinued in 2011. Included in the 2007 0 3 3 $79,474
restored? 2016 Blue Ribbon legislation was funding to re-instate the stipends. 2008 0 6 6 $51,483
2009 0 4 4 $67,252
Currently, the stipend is $2,000 per year for five years. Half of the amount is 2010 0 3 3 $0
2011 0 15 15 $116,000
paid by the employing school district and half by the state. A district may
2012 1 12 13 $0
opt to continue payments for an additional five years. 2013 0 5 5 $0
2014 0 2 2 $0
2015 0 0 0 $0
2016 0 0 0 $0
2017 1 5 6 $150,000
2018 4 5 9 $143,740
2019 4 5 9 $51,000
2020 3 4 7 $60,500
19 125 144 $863,435
BACKCAPITAL OUTLAY RECOMMENDATIONS Members of the Blue Ribbon Task Force discussed recommendations for a change in capital outlay. A consensus could not be reached so the task force made no recommendation for change. Recommendation 1: Some members of the Blue Ribbon Task Force advocated for a mechanism to lower capital outlay mill levies by 0.5 mills, and to repurpose those tax collections for general purposes. There was support to hold districts harmless with present committed bond obligations and to allow a phase-in period. Recommendation 2: A related proposal would have made the current capital outlay flexibility permanent, and perhaps expand it to allow for great movement of dollars between funds. Recommendation 3: Other task force members opposed making this change, on the basis that schools rely on these funds for construction and maintenance costs and the task force should not attempt to repurpose any existing dollars in school budgets
CAPITAL OUTLAY FUND BALANCES CONTINUE TO INCREASE
$400,000,000

$350,000,000                                                                                                                                           $335,250,218

                                                                                                                         $294,684,588
$300,000,000                                                                                                                            $290,503,932

                                                                                                          $255,733,114
$250,000,000
                                                                                           $213,353,805
                                                             $205,640,429
                                                                            $199,425,657
$200,000,000

                $154,920,847   $160,355,151   $155,272,876
$150,000,000

$100,000,000

 $50,000,000

         $0
                  2011           2012           2013           2014           2015           2016           2017           2018           2019           2020

    Source: South Dakota Department of Education                                                                                                               BACK
You can also read