Socioeconomic position and mental health during the COVID- 19 pandemic: a cross-sectional analysis of the CovidLife study version 1; peer review: ...
←
→
Page content transcription
If your browser does not render page correctly, please read the page content below
Wellcome Open Research 2021, 6:139 Last updated: 19 NOV 2021

RESEARCH ARTICLE

Socioeconomic position and mental health during the COVID-
19 pandemic: a cross-sectional analysis of the CovidLife study
[version 1; peer review: awaiting peer review]
Miranda Pierre 1, Markéta Keller2, Drew Altschul3, Chloe Fawns-Ritchie 3,
Louise Hartley 2, Clifford Nangle 2, Rachel Edwards 4,5, Rebecca Dawson2,
Archie Campbell 2,4, Robin Flaig 2,4, David J. Porteous 2,4
1Scottish Medicines Consortium, Healthcare Improvement Scotland, Glasgow, UK
2Usher Institute for Population Health Sciences and Informatics, University of Edinburgh, Edinburgh, UK
3Department of Psychology, University of Edinburgh, Edinburgh, UK
4Centre for Genomic and Experimental Medicine, Institute of Genetics & Molecular Medicine, University of Edinburgh, Edinburgh,

UK
5MRC Human Genetics Unit, MRC Institute of Genetics & Molecular Medicine, The University of Edinburgh, Western General

Hospital, Crewe Road South, Edinburgh, EH4 2XU, UK

v1   First published: 03 Jun 2021, 6:139                                         Open Peer Review
     https://doi.org/10.12688/wellcomeopenres.16820.1
     Latest published: 03 Jun 2021, 6:139
     https://doi.org/10.12688/wellcomeopenres.16820.1                            Reviewer Status AWAITING PEER REVIEW

                                                                                 Any reports and responses or comments on the

Abstract                                                                         article can be found at the end of the article.
Background: The coronavirus disease 2019 (COVID-19) pandemic has
been linked to an increase in mental health problems. This study
examined their association with socioeconomic position (SEP), as well
as potential confounding and mediating factors.

Methods: We analysed data from the CovidLife study (N=14,387;
66.4% female; mean [SD] age, 57.4 [13.9] years). Data were collected in
an online survey of UK adults (aged 18 years or over) between 17 April
and 7 June 2020. SEP measures included area deprivation (the Scottish
Index of Multiple Deprivation [SIMD]), education level, household
income, and employment status. Mental health was measured using
the Patient Health Questionnaire-9 (PHQ-9) and the Generalised
Anxiety Disorder-7 (GAD-7) scale. Worry indices were derived using
principal component analysis. Logistic regression was used to
estimate the associations between SEP and mental health.

Results: Low SEP was associated with increased odds of depression
and anxiety (odds ratio [OR] range 1.18-2.69). These associations
remained significant after adjusting for age, sex, relationship status,
and psychiatric history. Multivariable adjustment for medical worry
and isolation during the pandemic had the largest attenuating effects
(ranges 18-60% and 4-46%, respectively) on mental health outcomes.
When adding further adjustment for the remaining SEP markers and

                                                                                                                          Page 1 of 18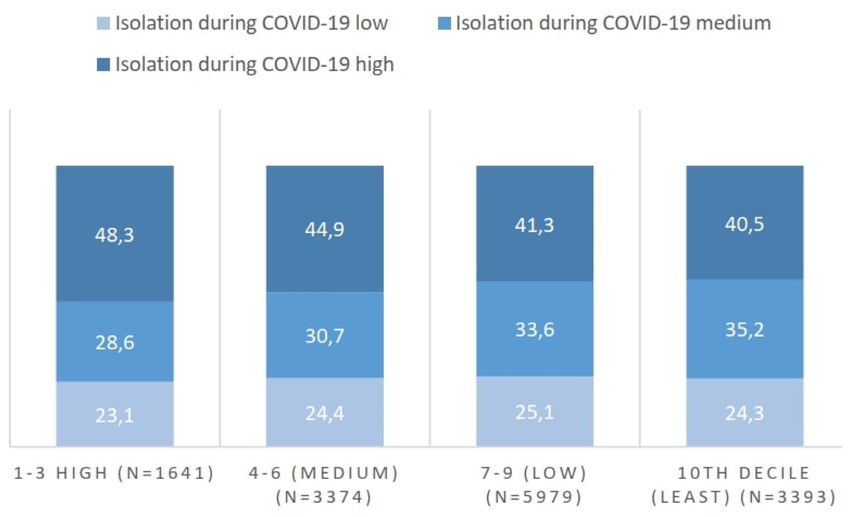
Wellcome Open Research 2021, 6:139 Last updated: 19 NOV 2021

all potential confounding and mediating factors, depression was
associated with high area deprivation and low education level and
income, whilst anxiety was only associated with low education level.
No dose-response relationship was observed.

Conclusions: SEP was inversely associated with mental health, which
was mostly explained by medical worry and isolation during the
COVID-19 pandemic. Mental health interventions might target these
factors to prevent widening inequalities in mental health. Future
studies should use longitudinal data to investigate the association.

Keywords
Socioeconomic, COVID-19, pandemic, depression, anxiety

         This article is included in the Generation
         Scotland gateway.

                This article is included in the Coronavirus
                (COVID-19) collection.

 Corresponding author: Miranda Pierre (msmirandapierre@gmail.com)
 Author roles: Pierre M: Conceptualization, Formal Analysis, Methodology, Visualization, Writing – Original Draft Preparation, Writing –
 Review & Editing; Keller M: Conceptualization, Methodology, Supervision, Writing – Review & Editing; Altschul D: Data Curation,
 Methodology, Resources, Software, Writing – Review & Editing; Fawns-Ritchie C: Methodology, Resources, Writing – Review & Editing;
 Hartley L: Data Curation, Project Administration; Nangle C: Data Curation, Project Administration, Supervision; Edwards R: Project
 Administration; Dawson R: Project Administration; Campbell A: Data Curation, Project Administration, Resources, Supervision, Writing –
 Review & Editing; Flaig R: Supervision; Porteous DJ: Funding Acquisition, Project Administration, Supervision
 Competing interests: No competing interests were disclosed.
 Grant information: Generation Scotland received core support from the Chief Scientist Office of the Scottish Government Health
 Directorates [CZD/16/6] and the Scottish Funding Council [HR03006], and is currently supported by the Wellcome Trust [216767/Z/19/Z].
 Genotyping of the Generation Scotland: Scottish Family Health Study samples were carried out by the Genetics Core Laboratory at the
 Wellcome Trust Clinical Research Facility, University of Edinburgh, Scotland, funded by the MRC and Wellcome Trust [104036/Z/14/Z]. CH
 is supported by an MRC University Unit Programme Grant [MC_UU_00007/10] (QTL in Health and Disease). DA is supported by the British
 Academy [PF20\100086].
 The funders had no role in study design, data collection and analysis, decision to publish, or preparation of the manuscript.
 Copyright: © 2021 Pierre M et al. This is an open access article distributed under the terms of the Creative Commons Attribution License,
 which permits unrestricted use, distribution, and reproduction in any medium, provided the original work is properly cited.
 How to cite this article: Pierre M, Keller M, Altschul D et al. Socioeconomic position and mental health during the COVID-19
 pandemic: a cross-sectional analysis of the CovidLife study [version 1; peer review: awaiting peer review] Wellcome Open
 Research 2021, 6:139 https://doi.org/10.12688/wellcomeopenres.16820.1
 First published: 03 Jun 2021, 6:139 https://doi.org/10.12688/wellcomeopenres.16820.1

                                                                                                                                 Page 2 of 18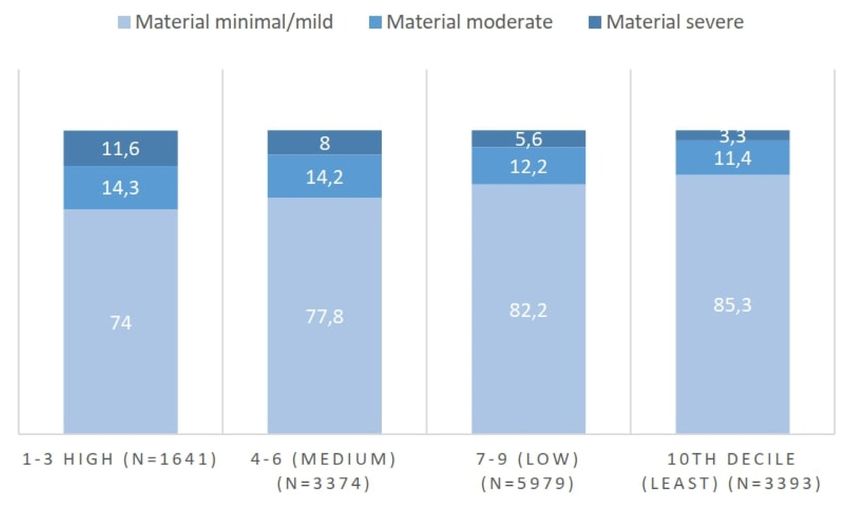
Wellcome Open Research 2021, 6:139 Last updated: 19 NOV 2021
Introduction Methods
The coronavirus disease 2019 (COVID-19) pandemic has Study sample
been associated with an increase in mental health problems Data were drawn from the CovidLife study; a survey of more
(Niedzwiedz et al., 2021). Yet this secondary health impact is than 18,000 adults of how the COVID-19 pandemic is affect-
unlikely to be evenly distributed across socioeconomic groups ing people in the UK from an economic, psychological, and
(Ettman et al., 2020). In general, socioeconomic position social perspective (Pierre, 2021). The survey launched on
(SEP) is an important marker of both physical and mental 17 April 2020, about a month into the national lockdown that
health (Braveman et al., 2011; Lorant et al., 2003). In the Uni- was announced on 23 March 2020. Data collection for this sur-
versity College London (UCL) COVID-19 Social Study, the vey continued until 7 June 2020. The survey was conducted
odds of severe depressive symptoms were more than five times online using the Qualtrics platform. Inclusion criteria were
greater among those with low SEP (Iob et al., 2020a). that participants were willing and able to give informed consent;
aged 18 years or over; and currently resident in the UK. Exclu-
It is unclear which factors may account for this association. sion criteria were that the participant was not resident in the
As reported in non-pandemic research, differential exposure to UK; had a lack of capacity to provide informed consent; or did
psychosocial and material adversity may partly account for the not have internet access. The survey took about 30 minutes to
association (Crowe & Butterworth, 2016; Domènech-Abella complete.
et al., 2018). Low SEP-groups are more likely to have adverse
experiences related to COVID-19 measures (Bu et al., 2020; Participants were recruited to the study through multiple chan-
Wright et al., 2020). These adversities including loneliness, abuse, nels. All the current volunteers from the Generation Scotland
and difficulty accessing food and medication, are in turn them- (GS) cohort were sent an email or letter inviting them to take part
selves associated with poor mental health (Horigian et al., 2021; in CovidLife. Details about the cohort are published elsewhere
Iob et al., 2020b; Wright et al., 2021). Adversity worries have (Smith et al., 2012). In brief, GS is a family and population-
also been associated with lower mental health, but the role of based genetic study of approximately 24,000 adults across
SEP in that association is unclear (Wright et al., 2021). In a Scotland ages 18–98 years. Participants were recruited to the
nationally representative American study, the relationship cohort from general practice registers between 2006 and 2011.
between income and depression during COVID-19 was signifi- Volunteers were also recruited to the CovidLife study from
cantly mediated by interpersonal resources, perceived control, the Aberdeen Children of the 1950s study, the Scottish Health
perceived financial resources, and COVID-19 related news con- Research Register (McKinstry et al., 2017) and the Discover
sumption. In contrast, no significant mediators were reported North West London’s health research register2. The CovidLife
for education level (Wanberg et al., 2020). Thus, the importance survey was also advertised on social media channels (Facebook,
of mediating factors may vary depending on the SEP indicator. Twitter, and Instagram).
Similarly, there are potential differences between mental health
outcomes, as low SEP is more frequently associated with Ethical standards
depression than anxiety (Stansfeld et al., 2008). The CovidLife study was approved by the NHS East of
Scotland Research Ethics Service (Reference: 20/ES/0021 AM02).
Understanding which factors may explain this association is
critical to prevent widening inequalities in mental health. Here, Consent
we examine the associations between SEP and mental health Informed consent was obtained electronically from all par-
during the COVID-19 pandemic. The aim of this study was ticipants. On arriving at the CovidLife survey landing page,
to compare how the associations and the role of mediating fac- volunteers first read through a volunteer information page. Next,
tors varied between different markers of SEP and mental volunteers completed an online consent form. This included
health. We analysed data from the CovidLife study1, a survey consenting to taking part in the CovidLife survey and also
of more than 18,000 UK adults of the economic, psychologi- consenting to re-contact in the future. Participants indicated
cal, and social impacts of the COVID-19 pandemic. For a com- their consent to participate by ticking the boxes to each
prehensive assessment of SEP, we included measures at both the statement.
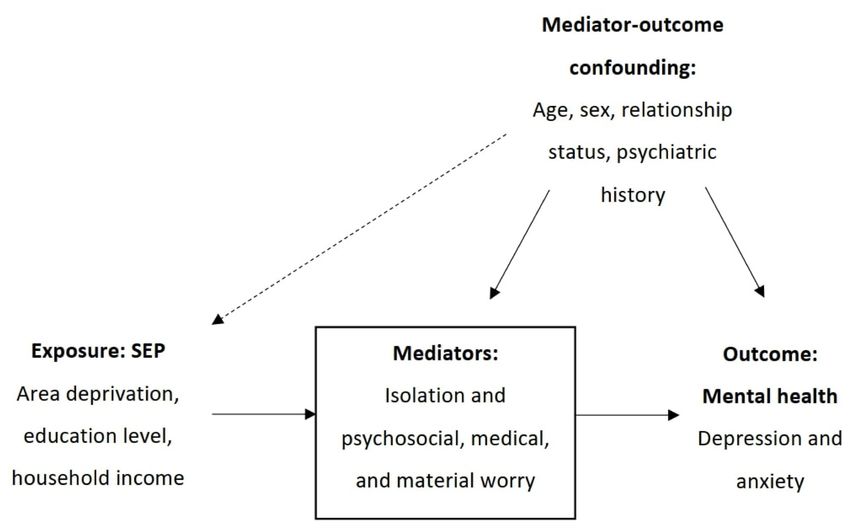
household and area-level. For potential mediating factors,
we assessed isolation levels and pandemic-related worries in Measures
three domains: (1) psychosocial (not being able to see friends Socioeconomic position
and family members outside the household, having life plans put Area deprivation. The Scottish Index of Multiple Depriva-
on hold); (2) medical (physical health, access to general practi- tion (SIMD) is a composite index of socioeconomic depriva-
tioner [GP] and National Health Service [NHS] services, social tion across seven domains: employment, income, education,
care or other support services, and medication); and (3) material health, access to services, crime, and housing. The index is cre-
(access to food, losing your job or not getting paid, household ated by splitting Scotland into 6,976 small areas which are
finances, not being able to pay your mortgage or rent). then ranked across the domains from most to least deprived.
1 2
https://www.ed.ac.uk/generation-scotland/for-researchers/covidlife https://www.registerfordiscover.org.uk/
Page 3 of 18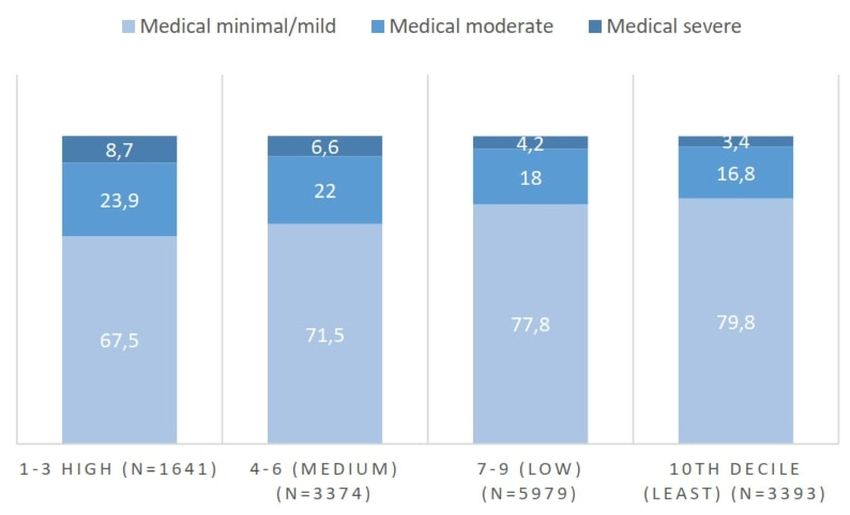
Wellcome Open Research 2021, 6:139 Last updated: 19 NOV 2021

Deprivation levels were categorised as follows: high (deciles 1–3),   attention deficit or attention deficit and hyperactivity disorder
medium (deciles 4–6), low (deciles 7–9), and least deprived           (ADD/ADHD); autism, Asperger’s or autism spectrum disor-
(decile 10). This variable was only available for participants        der; bulimia nervosa; depression; mania, hypomania, bipolar
resident in Scotland.                                                 or manic-depression; obsessive compulsive disorder (OCD);
                                                                      panic attacks; a personality disorder; psychological over-eating
Education level. Education level was assessed from the high-          or binge-eating; schizophrenia; social anxiety or social pho-
est qualification level given by participants. The following          bia; any other phobia (e.g. disabling fear of heights or spiders);
categories were used: low (GCSEs and below), medium (A lev-           any other type of psychosis or psychotic illness.
els or equivalent, professional or technical qualification), high
(undergraduate or postgraduate degree), and missing.                  Psychosocial, medical, and material worry. All participants
                                                                      were asked “Since COVID-19 measures were introduced, have
Household income. Total household income in the last year             you been worried about: not being able to see family members
(before tax) was recoded with the following categories: low           who don’t live with you; not being able to see friends; having
(below £30,000), medium (between £30,000 and £50,000),                life plans put on hold; losing your job/not getting paid; house-
high (£50,000 and above), and missing.                                hold finances; not being able to pay your mortgage or rent;
                                                                      access to food; access to GP and NHS services; access to social
Employment status. Participants were asked to give their              care or other support services; access to medication; your mental
employment status now and before COVID-19 measures                    well-being; and your physical health”. Each item was rated on
were introduced i.e., in January 2020. Categories were employed,      a Likert scale, ranging from not at all worried (1) to extremely
not employed, retired, and missing. Participants who reported         worried (5).
that they were in unpaid employment, homemakers, looking
after children, looking after other dependents, still in school or    Isolation. Participants were asked to rate on a 10-point scale
studying full-time, unemployed as sick or disabled or                 how much they felt isolated from others now and before
unemployed were categorised as not employed.                          COVID-19 measures were introduced i.e., in January 2020
                                                                      (0=not at all, 10=a lot). In this study, isolation during and before
Mental health                                                         COVID-19 was recoded as low (0–3), medium (4–7), and
Depression. Depression was assessed using the Patient Health          high (8–10).
Questionnaire-9 (PHQ-9), which is a well-known screener for
major depressive disorder (Kroenke et al., 2001). For each            Missing data
item, participants rate how often they have been bothered by          Table 1 shows the percentage of missing data for the study vari-
the symptom over the last two weeks on a Likert scale, ranging        ables. Complete case analysis was used for variables with 5%).
consistency (Cronbach’s alpha = 0.89).                                ‘Not applicable’ responses for the worry variables were recoded
                                                                      as 0. Thus, for example, if the person is unemployed, they
Anxiety. Anxiety was measured using the Generalised Anxiety           would not be worried about losing their job. Hence, this item
Disorder-7 (GAD-7) scale, which is a brief self-report instru-        would add 0 to their score in the material domain. To make the
ment used to identify anxiety disorders (Spitzer et al., 2006).       scoring work on the depression and anxiety scales, missing out-
For each of the 7 items, participants rate on a Likert scale how      come data were excluded. Missing SIMD data were also removed
often in the last 2 weeks they have been bothered by each prob-       from the analysis, as the participant did not provide a valid post-
lem, ranging from not at all (0) to nearly every day (3). Scores      code or were located outside Scotland. Responses were also
range from 0 to 21, with higher scores indicating more severe         coded as missing and removed if they were unrealistic (for
anxiety. A score of ≥10 was used as the cut-off value for anxi-       example, an age of 128 years and older) or if the participant
ety (Spitzer et al., 2006). The instrument had excellent internal     was below 18 years old.
consistency (Cronbach’s alpha = 0.91).
                                                                      Statistical analyses
Confounding and mediating factors                                     We estimated the crude and adjusted associations between SEP
Demographic background. Demographic information was                   and mental health using logistic regression. Categorical data
extracted on age (years, continuous), sex (male/female), and          were described with frequencies and proportions and continu-
relationship status (dichotomised: 0=other, 1=married or in           ous data with means and standard deviations (SD). Chi-square
civil partnership). Categories including single, in a relation-       tests were performed to examine whether there were signifi-
ship (living together or separately), widowed, divorced, and          cant differences in isolation and worry levels by deprivation
separated were included in other relationship status.                 status. Principal component analysis (PCA) was used to derive
                                                                      worry indices. Multicollinearity was evaluated by calculat-
Psychiatric history. Participants were asked if they had ever         ing variance inflation factors (VIF). Model fit was also evalu-
been diagnosed with one or more of the following mental               ated by calculating Nagelkerke’s R² statistic. Parameter estimates
health conditions (dichotomised; 0=no, 1=yes): agoraphobia;           for each model were exponentiated and are presented as odds
anorexia nervosa; anxiety, nerves or generalised anxiety disorder;    ratios (ORs) with 95% Confidence Intervals (CIs). A significance
                                                                                                                              Page 4 of 18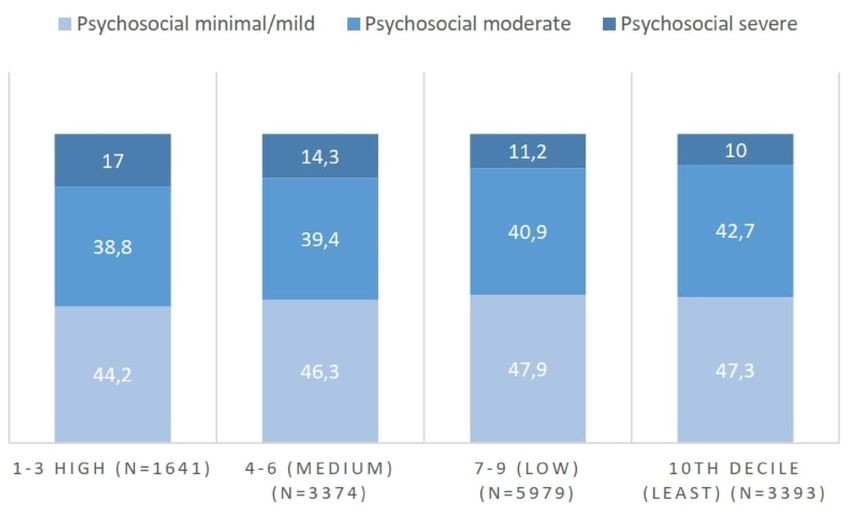
Wellcome Open Research 2021, 6:139 Last updated: 19 NOV 2021

level of p
Wellcome Open Research 2021, 6:139 Last updated: 19 NOV 2021

Table 2. Descriptive summary of the CovidLife survey.                                     (41.6%), having a high education level (49.5%), high household
                                                                                          income (28.4%), and being employed both during and before
                                                                                          COVID-19 (44.3% and 48.0%, respectively).
 Variable                                                                 N (%)
 Age (mean, SD)                                                           57.4 (13.9)     The mean age of respondents was 57 years (SD=13.9) and
 Sex                                                                                      about two thirds of the sample were female (66.4%) and mar-
                                                              Female                      ried or in a civil partnership (65.2%). About one in three had a
                                                                          9 554 (66.4)
                                                                                          self-reported history of a diagnosed mental health condi-
 Relationship status                                                                      tion (31.1%). Further, around ten times as many participants
                            Married or civil partnership                  9 386 (65.2)    reported high levels of isolation during COVID-19 than before
 History of mental illness                                                                COVID-19 measures were introduced (42.7 % vs. 4.1%).
                                                                    Yes   4 500 (31.3)
                                                                                          Principal component analysis
 Area deprivation                                                                         The PCA was undertaken on the 12 worry items with orthogo-
                                                          1–3 (High)      1 641 (11.4)    nal rotation (varimax). The component selection was based
                                                    4–6 (Medium)          3 374 (23.5)    on Parallel analysis and visual examination of the Scree plot.
                                                           7–9 (Low)      5 979 (41.6)    Both techniques suggested that three components were appro-
                                              10th decile (Least)         3 393 (23.6)    priate to extract. Together, the three components explained
                                                                                          60% of the variance. The Kaiser-Meyer Olkin (KMO) meas-
 Education level                                                                          ure confirmed the sampling adequacy for the analysis (KMO
                                                                   Low    1 480 (10.3)    = 0.83). For each item, the KMO values were equal to or above
                                                             Medium       5 017 (34.9)    0.76, and hence clearly above the acceptable limit of 0.5.
                                                                   High   7 116 (49.5)    Bartlett’s test of sphericity, χ2 (66) = 55150.56, p
Wellcome Open Research 2021, 6:139 Last updated: 19 NOV 2021
Table 3. Rotated standardised loadings of the 12 worry items on each
component.
Worry item RC1 RC2 RC3
Medication access 0.79 0.05 0.03
Access to GP and NHS services 0.78 0.18 -0.01
Your physical health 0.60 0.32 0.13
Access to social care or other support services 0.57 -0.02 0.16
Food access 0.56 0.22 0.17
Not being able to see friends 0.10 0.86 0.02
Not being able to see family members outside the household 0.15 0.78 0.09
Having life plans put on hold 0.15 0.76 0.15
Your mental well-being 0.41 0.46 0.32
Not being able to pay your mortgage or rent 0.12 0.07 0.87
Losing your job or not getting paid 0.04 0.08 0.85
Household finances 0.22 0.17 0.81
Note: Abbreviations: General Practitioner (GP); National Health Service (NHS); Rotated component
(RC).
Table 4. Grouping of worry items based on results of the Principal Component Analysis (PCA) and reliability of the indices.
Worry index Items included in the index Cronbach’s
alpha
Psychosocial Seeing family members outside the household, seeing friends, having life plans put on hold. 0.77
Medical Physical health and access to GP and NHS services, social care or other support services, and medication. 0.70
Material Losing your job/not getting paid, household finances, mortgage or rent payment, access to food. 0.76
Note: Abbreviations: General Practitioner (GP); National Health Service (NHS).
to worries, isolation levels were high across all deprivation cat- association was slightly stronger for depression. Relative to
egories. Again, the differences in the proportions were highly the employed group, people who were not employed during
significant (pWellcome Open Research 2021, 6:139 Last updated: 19 NOV 2021 Figure 2. Prevalence of minimal/mild, moderate, and severe psychosocial worries by area deprivation. Note: χ2 (6) = 70.48, p
Wellcome Open Research 2021, 6:139 Last updated: 19 NOV 2021

Figure 4. Prevalence of minimal/mild, moderate, and severe material worries by area deprivation. Note: χ2 (6) = 179.41,
p
Wellcome Open Research 2021, 6:139 Last updated: 19 NOV 2021

            Table 5. Odds ratios and 95% confidence intervals for unifactorial associations between socioeconomic
            position and mental health (N=14,387).

             Variable                                        N       % with       % with     Depression               Anxiety
                                                                     depression   anxiety    OR (95% CI)              OR (95% CI)

             Area deprivation (ref=10th
             decile/least)
                                              1–3 (High)     1 641   29.1         21.9       2.69*** (2.33 to 3.12)   2.23*** (1.90 to 2.61)
                                         4–6 (Medium)        3 374   20.9         17.4       1.74*** (1.53 to 1.98)   1.67*** (1.46 to 1.93)
                                              7–9 (Low)      5 979   15.6         12.9       1.21** (1.08 to 1.37)    1.18* (1.03 to 1.34)

             Education level (ref=High)
                                                       Low   1 480   20.1         16.6       1.22** (1.05 to 1.40)    1.18* (1.01 to 1.37)
                                                 Medium      5 017   17.9         13.7       1.05 (0.96 to 1.16)      0.94 (0.85 to 1.04)
                                                 Missing     7 74    20.0         17.6       1.21* (1.00 to 1.46)     1.26* (1.03 to 1.53)

             Household income
             (ref=High)
                                                       Low   3 032   25.4         18.1       1.93*** (1.72 to 2.17)   1.43*** (1.26 to 1.63)
                                                 Medium      2 829   17.9         14.8       1.24** (1.09 to 1.41)    1.13 (0.98 to 1.30)
                                                 Missing     3 442   15.2         13.0       1.02 (0.90 to 1.14)      0.97 (0.85 to 1.10)

             Employment status during
             COVID-19 (ref=Employed)
                                      Not employed           1 129   38.2         29.9       2.37*** (2.07 to 2.71)   2.07*** (1.79 to 2.39)
                                                 Retired     3 888   8.8          6.4        0.37*** (0.33 to 0.42)   0.33*** (0.29 to 0.38)
                                                 Missing     2 900   15.9         14.0       0.72*** (0.64 to 0.81)   0.79*** (0.70 to 0.89)

             Employment status before
             COVID-19 (ref=Employed)
                                      Not employed           863     41.3         31.6       2.63*** (2.27 to 3.05)   2.19*** (1.87 to 2.56)
                                                 Retired     3 817   8.8          6.4        0.36*** (0.32 to 0.41)   0.32*** (0.28 to 0.37)
                                                 Missing     2 800   15.0         13.4       0.66*** (0.58 to 0.74)   0.73*** (0.65 to 0.83)
            Note: *p
Wellcome Open Research 2021, 6:139 Last updated: 19 NOV 2021
Table 6. Odds ratios and 95% confidence intervals for unifactorial associations of potential confounding and
mediating factors with mental health (N=14,387).
Variable N % with % with Depression Anxiety
depression anxiety OR (95% CI) OR (95% CI)
Age - 0.95*** (0.95 to 0.96) 0.95*** (0.95 to 0.96)
Sex (ref=Male)
Female 9 554 21.0 17.4 2.03*** (1.84 to 2.25) 2.14*** (1.92 to 2.40)
Relationship status
(ref=Other)
Married or civil 9 386 13.4 11.8 0.44*** (0.40 to 0.48) 0.55*** (0.50 to 0.60)
partnership
History of mental
illness (ref=No)
Yes 4 500 36.2 28.2 5.42*** (5.00 to 5.94) 4.33*** (3.93 to 4.77)
Isolation during
COVID-19 (ref=Low)
Medium 4 708 12.5 9.7 2.98*** (2.50 to 3.58) 2.59*** (2.14 to 3.15)
High 6 150 29.6 24.3 8.79*** (7.46 to 10.42) 7.72*** (6.49 to 9.27)
Isolation before
COVID-19 (ref=Low)
Medium 1 609 37.4 29.0 3.55*** (3.17 to 3.97) 3.00*** (2.66 to 3.39)
High 583 35.7 29.3 3.30*** (2.76 to 3.93) 3.06*** (2.53 to 3.68)
Psychosocial worry
(ref=Minimal/mild)
Moderate 5 862 19.8 16.2 2.44*** (2.19 to 2.70) 2.80*** (2.49 to 3.16)
Severe 1 772 44.1 39.8 7.75*** (6.85 to 8.79) 9.57*** (8.36 to 10.97)
Medical worry
(ref=Minimal/mild)
Moderate 2 781 31.1 26.5 3.46*** (3.13 to 3.82) 3.75*** (3.37 to 4.17)
Severe 730 61.5 55.6 12.26*** (10.45 to 14.40) 13.05*** (11.12 to 15.33)
Material worry
(ref=Minimal/mild)
Moderate 1 830 33.3 27.9 3.50*** (3.13 to 3.91) 3.46*** (3.07 to 3.90)
Severe 908 55.1 45.3 8.57*** (7.44 to 9.88) 7.39*** (6.39 to 8.53)
Note: *pTable 7. Odds ratios and 95% confidence intervals for multifactorial associations between area deprivation and mental health (N=14,387).
Depression Anxiety
OR (95% CI) OR (95% CI)
Area deprivation (ref=10th Low Medium High Nagelkerke’s % attenuated Low Medium High Nagelkerke’s % attenuated
decile/least deprived) R² (high R² (high
deprivation) deprivation)
Adjustments
Age and sex 1.15* 1.49*** 2.22*** .13 1.11 1.43*** 1.79*** 0.12
(1.01 to 1.30) (1.30 to 1.70) (1.91 to 2.58) (0.97 to 1.27) (1.24 to 1.65) (1.52 to 2.11)
Age, sex, relationship status, 1.10 1.30*** 1.70*** .24 1.07 1.29*** 1.46*** 0.18
psychiatric (0.96 to 1.25) (1.13 to 1.50) (1.45 to 2.00) (0.93 to 1.23) (1.11 to 1.49) (1.23 to 1.73)
history
Age, sex, relationship status,
psychiatric history plus each of
the following adjustments
Isolation during COVID-19 1.08 1.27** 1.67*** .33 4 1.05 1.25** 1.40*** 0.27 13
(0.94 to 1.24) (1.10 to 1.47) (1.41 to 1.98) (0.91 to 1.21) (1.08 to 1.46) (1.17 to 1.67)
Isolation before COVID-19 1.08 1.28*** 1.63*** .26 10 1.06 1.27** 1.40*** 0.20 13
(0.95 to 1.24) (1.11 to 1.48) (1.39 to 1.92) (0.92 to 1.22) (1.10 to 1.48) (1.17 to 1.66)
Psychosocial worry 1.10 1.28** 1.68*** .30 3 1.07 1.26** 1.42*** 0.27 9
(0.96 to 1.26) (1.10 to 1.48) (1.42 to 1.99) (0.93 to 1.23) (1.08 to 1.47) (1.19 to 1.70)
Medical worry 1.05 1.16 1.49*** .31 30 1.02 1.14 1.24* 0.28 48
(0.92 to 1.21) (1.00 to 1.34) (1.26 to 1.76) (0.89 to 1.18) (0.97 to 1.33) (1.03 to 1.48)
Material worry 1.04 1.20* 1.54*** .28 23 1.02 1.19* 1.32** 0.22 30
(0.91 to 1.19) (1.04 to 1.38) (1.30 to 1.82) (0.89 to 1.17) (1.03 to 1.39) (1.11 to 1.57)
Note: *pTable 8. Odds ratios and 95% confidence intervals for multifactorial associations between education level and mental health (N=14,387).
Depression Anxiety
OR (95% CI) OR (95% CI)
Education level Low Medium Missing Nagelkerke’s % Low Medium Missing Nagelkerke’s R² %
(ref=High) R² attenuated attenuated
(low (low
education) education)
Adjustments
Age and sex 1.95*** 1.39*** 1.49*** .12 1.87*** 1.23*** 1.54*** .12
(1.67 to 2.27) (1.26 to 1.54) (1.22 to 1.80) (1.59 to 2.20) (1.10 to 1.37) (1.25 to 1.89)
Age, sex, relationship 1.80*** 1.31*** 1.37*** .24 1.73*** 1.15* 1.45*** .19
status, psychiatric history (1.53 to 2.11) (1.17 to 1.45) (1.11 to 1.68) (1.46 to 2.05) (1.03 to 1.29) (1.17 to 1.78)
Age, sex, relationship status,
psychiatric history plus each
of the following
adjustments
Isolation during COVID-19 1.59*** 1.19** 1.22 .33 26 1.50*** 1.03 1.29* .27 32
(1.34 to 1.88) (1.06 to 1.33) (0.98 to 1.51) (1.26 to 1.79) (0.92 to 1.16) (1.03 to 1.61)
Isolation before COVID-19 1.76*** 1.32*** 1.38** .26 5 1.68*** 1.15* 1.45*** .21 7
(1.49 to 2.06) (1.19 to 1.47) (1.11 to 1.70) (1.42 to 1.99) (1.03 to 1.29) (1.17 to 1.79)
Psychosocial worry 1.76*** 1.27*** 1.46*** .30 5 1.67*** 1.10 1.57*** .27 8
(1.49 to 2.08) (1.14 to 1.41) (1.18 to 1.81) (1.40 to 1.98) (0.98 to 1.24) (1.26 to 1.96)
Medical worry 1.66*** 1.24*** 1.35** .32 18 1.56*** 1.07 1.43** .28 23
(1.40 to 1.96) (1.11 to 1.39) (1.08 to 1.67) (1.30 to 1.86) (0.95 to 1.21) (1.14 to 1.78)
Material worry 1.65*** 1.24*** 1.32** .28 19 1.59*** 1.09 1.41** .22 19
(1.40 to 1.94) (1.11 to 1.38) (1.07 to 1.63) (1.33 to 1.88) (0.97 to 1.23) (1.13 to 1.74)
Note: *pTable 9. Odds ratios and 95% confidence intervals for multifactorial associations between household income and mental health (N=14,387).
Depression Anxiety
OR (95% CI) OR (95% CI)
Household income Low Medium Missing Nagelkerke’s % attenuated Low Medium Missing Nagelkerke’s % attenuated
(ref=High) R² (low income) R² (low income)
Adjustments
Age and sex 2.70*** 1.46*** 1.82*** .14 1.89*** 1.31*** 1.68*** .12
(2.38 to 3.07) (1.27 to 1.67) (1.60 to 2.07) (1.65 to 2.17) (1.13 to 1.51) (1.47 to 1.93)
Age, sex, relationship 1.89*** 1.25** 1.47*** .24 1.45*** 1.17* 1.44*** .18
status, (1.64 to 2.17) (1.08 to 1.44) (1.28 to 1.69) (1.25 to 1.68) (1.01 to 1.36) (1.25 to 1.66)
psychiatric history
Age, sex, relationship status,
and psychiatric history,
plus each of the following
adjustments
Isolation during 1.65*** 1.13 1.21** .33 27 1.24** 1.06 1.20* .26 46
COVID-19 (1.43 to 1.91) (0.98 to 1.31) (1.05 to 1.40) (1.06 to 1.44) (0.91 to 1.23) (1.03 to 1.39)
Isolation before 1.77*** 1.22** 1.39*** .26 13 1.35*** 1.15 1.37*** .20 20
COVID-19 (1.53 to 2.03) (1.06 to 1.41) (1.21 to 1.60) (1.16 to 1.57) (0.99 to 1.33) (1.19 to 1.58)
Psychosocial worry 1.81*** 1.18* 1.42*** .30 9 1.35*** 1.09 1.39*** .27 20
(1.56 to 2.09) (1.02 to 1.36) (1.23 to 1.63) (1.16 to 1.57) (0.93 to 1.27) (1.12 to 1.61)
Medical worry 1.62*** 1.21* 1.31*** .32 30 1.18* 1.12 1.27** .28 60
(1.40 to 1.87) (1.04 to 1.40) (1.14 to 1.51) (1.01 to 1.38) (0.96 to 1.31) (1.10 to 1.48)
Material worry 1.69*** 1.21** 1.48*** .28 22 1.28** 1.13 1.44*** .22 37
(1.46 to 1.95) (1.05 to 1.40) (1.28 to 1.70) (1.10 to 1.49) (0.97 to 1.32) (1.25 to 1.67)
Note: *pWellcome Open Research 2021, 6:139 Last updated: 19 NOV 2021
largest attenuating effects for household income (30% and Table 10 shows the fully adjusted associations (including
60%), followed by isolation during COVID-19 (27% and 46%) all factors) with mental health. Depression was associated
(Table 9). with high area deprivation (aOR, 1.24; 95% CI: 1.04-1.50;
Table 10. Odds ratios and 95% confidence intervals for fully adjusted associations with mental
health (N=14,387).
Variable Depression Anxiety
OR (95% CI) OR (95% CI)
Area deprivation (ref=10th decile/least deprived)
1–3 (High) 1.24* (1.04 to 1.50) 1.08 (0.89 to 1.31)
4–6 (Medium) 1.03 (0.88 to 1.21) 1.05 (0.89 to 1.24)
7–9 (Low) 0.98 (0.85 to 1.13) 0.97 (0.84 to 1.13)
Education level (ref=High)
Low 1.31** (1.09 to 1.58) 1.30** (1.06 to 1.57)
Medium 1.09 (0.97 to 1.23) 0.96 (0.84 to 1.09)
Missing 1.24 (0.97 to 1.58) 1.29* (1.00 to 1.64)
Household income (ref=High)
Low 1.24** (1.05 to 1.47) 0.94 (0.78 to 1.13)
Medium 1.04 (0.89 to 1.21) 0.99 (0.84 to 1.17)
Missing 0.99 (0.82 to 1.18) 0.94 (0.78 to 1.13)
Employment status during COVID-19 (ref=Employed)
Not employed 1.19 (0.99 to 1.41) 1.08 (0.90 to 1.30)
Retired 0.87 (0.73 to 1.04) 0.82* (0.68 to 1.00)
Missing 1.09 (0.90 to 1.31) 1.20 (0.99 to 1.46)
Age 0.97*** (0.96 to 0.97) 0.97*** (0.96 to 0.97)
Sex (ref=Male)
Female 1.23*** (1.09 to 1.40) 1.34*** (1.17 to 1.53)
Relationship status (ref=Other)
Married or civil partnership 0.74*** (0.66 to 0.83) 0.95 (0.84 to 1.07)
History of mental illness (ref=No)
Yes 3.37*** (3.03 to 3.74) 2.51*** (2.25 to 2.81)
Isolation during COVID-19
(ref=Low)
Medium 2.15*** (1.77 to 2.62) 1.75*** (1.43 to 2.17)
High 4.39*** (3.64 to 5.32) 3.36*** (2.76 to 4.12)
Isolation before COVID-19
(ref=Low)
Medium 2.00*** (1.74 to 2.31) 1.74*** (1.50 to 2.01)
High 1.83*** (1.47 to 2.27) 1.89*** (1.50 to 2.35)
Psychosocial worry (ref=Minimal/mild)
Moderate 1.43*** (1.26 to 1.62) 1.68*** (1.47 to 1.93)
Severe 2.55*** (2.18 to 2.99) 3.35*** (2.84 to 3.94)
Medical worry (ref=Minimal/mild)
Moderate 2.11*** (1.88 to 2.38) 2.35*** (2.08 to 2.65)
Severe 4.06*** (3.33 to 4.95) 4.47*** (3.69 to 5.42)
Page 15 of 18Wellcome Open Research 2021, 6:139 Last updated: 19 NOV 2021
Variable Depression Anxiety
OR (95% CI) OR (95% CI)
Material worry (ref=Minimal/mild)
Moderate 1.52*** (1.32 to 1.75) 1.43*** (1.24 to 1.65)
Severe 2.41*** (2.02 to 2.88) 1.94*** (1.62 to 2.31)
Nagelkerke’s R² .41 .37
Note: *pWellcome Open Research 2021, 6:139 Last updated: 19 NOV 2021
SEP and mental health (Crowe & Butterworth, 2016; study. Specifically, those who had a low education level and
Domènech-Abella et al., 2018). The role of mediating factors income and lived in the most deprived areas were susceptible to
varied across SEP indicators, which is supported by the litera- depression. Anxiety was also related to low education level. The
ture (Domènech-Abella et al., 2018; Skalická et al., 2009). Edu- associations were not accounted for by age, sex, relationship
cation is thought to be important for developing social skills status, and psychiatric history. Also, since medical worry and iso-
and networks (Skalická et al., 2009), which may explain why lation were important explanatory factors, they may be suitable
isolation during the pandemic had the largest attenuating targets for mental health promotion among low-SEP groups.
effects for this variable. In contrast, medical worry in terms of
access to healthcare is more closely tied to financial resources Importantly, mental health problems accounted for a large share
but also area deprivation, since two of the SIMD domains of the disease burden prior to COVID-19 (Vos et al., 2015).
are health and access to services. Furthermore, mental health problems are often comorbid with
physical health problems (Iacovides & Siamouli, 2008), both
This study has a few limitations. First, potential selection bias of which are influenced by socioeconomic factors (Braveman
due to non-participation by low-SEP groups may have caused et al., 2011; Lorant et al., 2003). Thus, identifying factors that
the association to be underestimated. In particular, given that could potentially reduce these inequalities has important impli-
severe worries were unevenly distributed between SEP groups, cations for the overall disease burden. The large sample size
the association is likely stronger than is reported here. Second, and the use of comprehensive, valid, and reliable measures are
as the study sample may not be representative of the UK notable strengths of the study. This study has also provided
population, the external validity may be limited. Third, the valuable baseline data on mental health at a critical point in the
cross-sectional design means that causality cannot be deter- COVID-19 pandemic. Future research should use longitudi-
mined. Reverse causation and bidirectional influences cannot nal data, including follow-up of this study sample, to investigate
be excluded. For example, anxiety may cause medical worries the mental health sequalae of the pandemic.
because of the care needs of the condition, rather than
vice versa. Finally, although this study has accounted for Data availability
mediator-outcome confounding, exposure-mediation interaction or Underlying data
mediation-confounding affected by the exposure may be present CovidLife data access is through a system of managed open
(Richiardi et al., 2013). The conceptual model in this study may access. The steps below highlight how to apply for access to
therefore have limited validity; nevertheless, it had the benefit CovidLife data. Non-identifiable information from CovidLife is
of structuring the analysis and clarifying causal assumptions. available to researchers in the UK and to international collabo-
rators through application to the Generation Scotland Access
Implications for policy, practice, and research Committee (access@generationscotland.org). The Generation
Medical worry and isolation could be important targets for Scotland data access process includes an application form,
intervention, as these were the most influential factors in the and proposals are reviewed by the Generation Scotland Access
study. There have been concerns about the impact of deferred Committee. The data collected by the CovidLife surveys have
healthcare as a result of the pandemic (Gogia et al., 2020), and been incorporated in the main Generation Scotland dataset and
the findings here confirm the importance of this concern for governance process. Summary information to help researchers
mental health. Similarly, this study highlights the prominent assess the feasibility and statistical power of a proposed project
concern about increased isolation during the pandemic (Hwang is available on request by contacting resources@generationscot-
et al., 2020). Therefore, one important issue is to ensure that land.org.
mental and physical health services are adequately funded and
available, for example through telehealth and community serv- Extended data
ices. Although material factors were not as influential, they Zenodo: CovidLife questionnaire used for “Socioeconomic
explained a modest percentage of the effect estimates. Therefore, position and mental health during the COVID-19 pandemic: a
prevention through economic and social policy interventions cross-sectional analysis of the CovidLife study”. https://doi.
may also be warranted. Future epidemiological studies should org/10.5281/zenodo.4744539 (Pierre, 2021).
investigate the association using a longitudinal study design.
This should be used to confirm the temporal ordering of the Data are available under the terms of the Creative Commons
association, including potential confounding and mediating fac- Attribution 4.0 International license (CC-BY 4.0).
tors, and if the association has been amplified by the pandemic.
Finally, gender and ethnic differences in the association (Xue &
McMunn, 2020), the role of behavioural factors (Stanton et al.,
2020), and the impact on children and adolescents could also Acknowledgements
be the focus of future research. The authors wish to thank all volunteers, as well as the PIs and
staff of the Aberdeen Children of the 1950s study, the Scottish
Conclusions Family Health Register, and Discover North West London. This
Mental health outcomes and associated factors during the study was conducted as part of a master’s thesis at the
COVID-19 pandemic had an unequal social distribution in this University of Edinburgh.
Page 17 of 18Wellcome Open Research 2021, 6:139 Last updated: 19 NOV 2021
References
Alonso J, Angermeyer MC, Bernert S, et al.: Prevalence of mental disorders Marmot M, Allen J: COVID-19: exposing and amplifying inequalities.
in Europe: results from the European Study of the Epidemiology of Mental J Epidemiol Community Health. 2020; 74(9): 681–682.
Disorders (ESEMeD) project. Acta Psychiatr Scand Suppl. 2004; (s420): 21–27. PubMed Abstract | Publisher Full Text | Free Full Text
PubMed Abstract | Publisher Full Text McKinstry B, Sullivan FM, Vasishta S, et al.: Cohort profile: the Scottish
Bu F, Steptoe A, Fancourt D: Who is lonely in lockdown? Cross-cohort Research Register SHARE. A register of people interested in research
analyses of predictors of loneliness before and during the COVID-19 participation linked to NHS data sets. BMJ Open. 2017; 7(2): e013351.
pandemic. Public Health. 2020; 186: 31–34. PubMed Abstract | Publisher Full Text | Free Full Text
PubMed Abstract | Publisher Full Text | Free Full Text
Niedzwiedz CL, Green MJ, Benzeval M, et al.: Mental health and health
Braveman P, Egerter S, Williams DR: The social determinants of health: behaviours before and during the initial phase of the COVID-19 lockdown:
coming of age. Annu Rev Public Health. 2011; 32: 381–398. longitudinal analyses of the UK Household Longitudinal Study, J Epidemiol
PubMed Abstract | Publisher Full Text Community Health. 2021; 75(3): 224–231.
Crowe L, Butterworth P: The role of financial hardship, mastery and social PubMed Abstract | Publisher Full Text | Free Full Text
support in the association between employment status and depression: Pierre M: CovidLife questionnaire used for “Socioeconomic position and
results from an Australian longitudinal cohort study. BMJ Open. 2016; 6(5): mental health during the COVID-19 pandemic: a cross-sectional analysis of
e009834. the CovidLife study” (Version 1.0). 2021.
PubMed Abstract | Publisher Full Text | Free Full Text http://www.doi.org/10.5281/zenodo.4744539
Domènech-Abella J, Mundó J, Leonardi M, et al.: The association between Richiardi L, Bellocco R, Zugna D: Mediation analysis in epidemiology:
socioeconomic status and depression among older adults in Finland, methods, interpretation and bias. Int J Epidemiol. 2013; 42(5): 1511–1519.
Poland and Spain: a comparative cross-sectional study of distinct PubMed Abstract | Publisher Full Text
measures and pathways. J Affect Disord. 2018; 241: 311–318.
PubMed Abstract | Publisher Full Text Skalická V, van Lenthe F, Bambra C, et al.: Material, psychosocial, behavioural
and biomedical factors in the explanation of relative socio- economic
Ettman CK, Abdalla SM, Cohen GH, et al.: Prevalence of depression symptoms inequalities in mortality: evidence from the HUNT study. Int J Epidemiol.
in US adults before and during the COVID-19 pandemic. JAMA Netw Open. 2009; 38(5): 1272–1284.
2020; 3(9): e2019686. PubMed Abstract | Publisher Full Text
PubMed Abstract | Publisher Full Text | Free Full Text
Spitzer RL, Kroenke K, Williams JBW, et al.: A brief measure for assessing
Field A, Miles J, Field Z: Discovering statistics using R. SAGE, London, UK. 2012.
Generalized Anxiety Disorder: the GAD-7. Arch Intern Med. 2006; 166(10):
Reference Source
1092–1097.
Gogia S, Newton-Dame R, Boudourakis L, et al.: Covid-19 X-Curves: illness PubMed Abstract | Publisher Full Text
hidden, illness deferred. NEJM Catalyst Innovations in Care Delivery. 2020.
Stansfeld SA, Clark C, Rodgers B, et al.: Childhood and adulthood socio-
Reference Source
economic position and midlife depressive and anxiety disorders. Br J
Heflin CM, Iceland J: Poverty, Material Hardship, and Depression†. Soc Sci Q. Psychiatry. 2008; 192(2): 152–153.
2009; 90(5): 1051–1071. PubMed Abstract | Publisher Full Text
PubMed Abstract | Publisher Full Text | Free Full Text
Stanton R, To QG, Khalesi, S, et al.: Depression, anxiety and stress during
Horigian VE, Schmidt RD, Feaster DJ: Loneliness, mental health, and COVID-19: associations with changes in physical activity, sleep, tobacco
substance use among US young adults during COVID-19. J Psychoactive and alcohol use in Australian adults. Int J Environ Res Public Health. 2020;
Drugs. 2021; 53(1): 1–9. 17(11): 4065.
PubMed Abstract | Publisher Full Text PubMed Abstract | Publisher Full Text | Free Full Text
Hwang TJ, Rabheru K, Peisah C, et al.: Loneliness and social isolation during Smith BH, Campbell A, Linksted P, et al.: Cohort Profile: Generation Scotland:
the COVID-19 pandemic. Int Psychogeriatr. 2020; 32(10): 1217–1220. Scottish Family Health Study (GS:SFHS). The study, its participants and
PubMed Abstract | Publisher Full Text | Free Full Text their potential for genetic research on health and illness. Int J Epidemiol.
Iacovides A, Siamouli M: Comorbid mental and somatic disorders: an 2012; 42(3): 689–700.
epidemiological perspective. Curr Opin Psychiatry. 2008; 21(4): 417–421. PubMed Abstract | Publisher Full Text
PubMed Abstract | Publisher Full Text
Vos T, Barber RM, Bell B, et al.: Global, regional, and national incidence,
Iob E, Frank P, Steptoe A, et al.: Levels of severity of depressive symptoms prevalence, and years lived with disability for 301 acute and chronic
among at-risk groups in the UK during the COVID-19 Pandemic. JAMA Netw diseases and injuries in 188 countries, 1990– 2013: a systematic analysis for
Open. 2020a; 3(10): e2026064. the Global Burden of Disease Study 2013. Lancet. 2015; 386(9995): 743–800.
PubMed Abstract | Publisher Full Text | Free Full Text PubMed Abstract | Publisher Full Text | Free Full Text
Iob E, Steptoe A, Fancourt D: Abuse, self-harm and suicidal ideation in the Wanberg CR, Csillag B, Douglass RP, et al.: Socioeconomic status and well-
UK during the COVID-19 pandemic. Br J Psychiatry. 2020b; 217(4): 543–546. being during COVID-19: a resource-based examination. J Appl Psychol. 2020;
PubMed Abstract | Publisher Full Text | Free Full Text 105(12): 1382–1396.
Kroenke K, Spitzer RL, Williams JB: The PHQ-9: validity of a brief depression PubMed Abstract | Publisher Full Text | Free Full Text
severity measure. J Gen Intern Med. 2001; 16(9): 606–613. Wright L, Steptoe A, Fancourt D: Are we all in this together? Longitudinal
PubMed Abstract | Publisher Full Text | Free Full Text assessment of cumulative adversities by socioeconomic position in the
Lone NI, McPeake J, Stewart NI, et al.: Influence of socioeconomic deprivation first 3 weeks of lockdown in the UK. J Epidemiol Community Health. 2020;
on interventions and outcomes for patients admitted with COVID-19 to 74(9):683–688.
critical care units in Scotland: a national cohort study. The Lancet Regional PubMed Abstract | Publisher Full Text | Free Full Text
Health - Europe. 2021; 1: 100005. Wright L, Steptoe A, Fancourt D: Does thinking make it so? Differential
Publisher Full Text associations between adversity worries and experiences and mental
Lorant V, Deliège D, Eaton W, et al.: Socioeconomic inequalities in depression: health during the COVID-19 pandemic. J Epidemiol Community Health. 2021;
a meta-analysis. Am J Epidemiol. 2003; 157(2): 98–112. jech-2020-215598.
PubMed Abstract | Publisher Full Text PubMed Abstract | Publisher Full Text | Free Full Text
Luo M, Guo L, Yu M, et al.: The psychological and mental impact of Xue B, McMunn A: Gender differences in the impact of the COVID-19
coronavirus disease 2019 (COVID-19) on medical staff and general public lockdown on unpaid care work and psychological distress in the UK.
- A systematic review and meta-analysis. Psychiatry Res. 2020; 291: 113190. SocArxiv. 2020.
PubMed Abstract | Publisher Full Text | Free Full Text Publisher Full Text
Page 18 of 18You can also read