JANUS HENDERSON GLOBAL LIFE SCIENCES FUND - SWEETWATER ...

Page created by Glen Swanson
 
CONTINUE READING
JANUS HENDERSON GLOBAL LIFE SCIENCES FUND - SWEETWATER ...
For US Financial Professionals servicing non-US persons. Not for onward distribution. For
promotional purposes.
The value of an investment and the income from it can fall as well as rise and you may not get back
the amount originally invested.

Janus Henderson
Global Life Sciences Fund
31 October 2020
JANUS HENDERSON GLOBAL LIFE SCIENCES FUND - SWEETWATER ...
Contents

•   Why Health Care?

•   Global Life Sciences Fund

•   Investment Process

•   Performance and Characteristics

•   Appendix

                                      2
JANUS HENDERSON GLOBAL LIFE SCIENCES FUND - SWEETWATER ...
Janus Henderson Firm Overview

 346 Investment Professionals                          Risk & Analytics                     Research Resources
 • 133 portfolio managers with an average              • Independent investment risk team   • 117 global research analysts with an
   of 21 years of experience                                                                  average of 14 years of experience
                                                       • Global compliance
 • 35 trader/dealers                                                                        • Access to management teams and
                                                       • Experienced legal team
                                                                                              high quality deal flow
 • 24 client portfolio managers
                                                                                            • Large proprietary research budget

  Over $358.3bn in firmwide AUM

                15%

                                 55%
          30%

          North America         $198.7bn
          EMEA & LatAm          $106.8bn
          Asia Pacific           $52.8bn

                                                                                                               Office locations (27 total)

Source:    Janus Henderson Investors, as at 30/09/20

                                                                                                                                             3
JANUS HENDERSON GLOBAL LIFE SCIENCES FUND - SWEETWATER ...
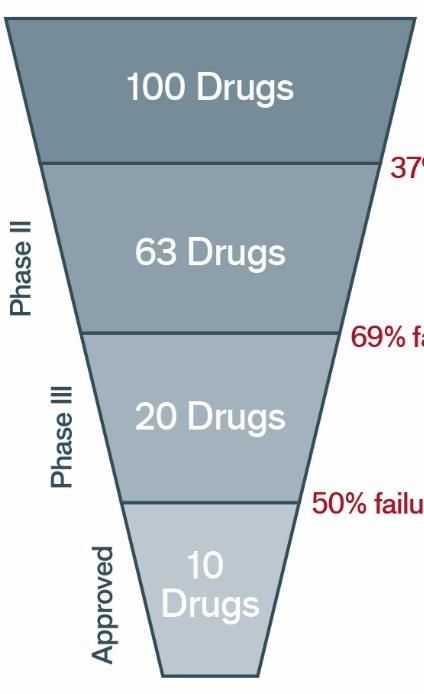
Why Health Care?

The opinions and views expressed are as at 31 October 2020 and are subject to change without notice. They are for
information purposes only and should not be used or construed as an offer to sell, a solicitation of an offer to buy, or a
recommendation to buy, sell or hold any security, investment strategy or market sector. No forecasts can be guaranteed.
Opinions and examples are meant as an illustration of broader themes and are not an indication of trading intent. It is not
intended to indicate or imply that any illustration/example mentioned is now or was ever held in any portfolio. Janus Henderson
Group plc through its subsidiaries may manage investment products with a financial interest in securities mentioned herein and
any comments should not be construed as a reflection on the past or future profitability. There is no guarantee that the
information supplied is accurate, complete, or timely, nor are there any warranties with regards to the results obtained from its
use. Past performance is no guarantee of future results. Investing involves risk, including the possible loss of principal and
fluctuation of value.
JANUS HENDERSON GLOBAL LIFE SCIENCES FUND - SWEETWATER ...
Why Health Care?

Innovation: Accelerating innovation addressing unmet medical needs

Demographics: Aging global populations drive health care spending growth

Globalisation: Rising standards of living lead to higher health care spending globally

Diversification and defensive characteristics: Historically, the sector has one of the lowest
correlations to the broader equity markets and has held up better in down markets

                                                                                                5
Why Health Care? Opportunities for Innovation
What are we seeking:
Innovative and differentiated therapies addressing unmet medical needs
                        Cardiovascular Disease                                                                               Cancer

                                  Cardiovascular disease is the leading                                                   38% of people will be diagnosed with
                                  cause of death worldwide – an estimated                                                 cancer at some point during their
                                  17.9 million deaths each year. That’s                                                   lifetimes. The number of new cases is
                                  one every two seconds. The cost of                                                      expected to rise by 28 million over the next
                                  cardiovascular disease is estimated at                                                  2 decades. Cancers figure among the

 $863B                            $863 billion per year worldwide. 47% of
                                  Americans have one of the three key risk
                                  factors associated with heart disease.
                                                                                          $1.16T                          leading causes of morbidity and mortality
                                                                                                                          worldwide, with approximately 17 million
                                                                                                                          new cases and 9.4 million cancer-related
   Annual global spend                                                                     Annual global spend            deaths in 2018.

                                   Diabetes                                                                          Genetic Diseases

                                 The number of people with diabetes                                                       Over 7,000 genetic diseases have been
                                 globally has risen from 108 million in 1980                                              identified, but fewer than 5% have
                                 to 422 million in 2014. 9.3% of the United                                               available treatments. A better
                                 States population has diabetes. If                                                       understanding of the genetic causes of
                                 current trends continue as many as 1 in 3                                                diseases is driving rapid progress,

$825B                            American adults will have diabetes in
                                 2050. The total annual estimated cost of
                                 diagnosed diabetes globally is $825 billion.
                                                                                          7,000+                          including new therapies for haemophilia,
                                                                                                                          sickle cell anemia, muscular dystrophy
                                                                                                                          and many more.
  Annual global spend                                                                        Genetic diseases

Sources: American Cancer Society, as at 2018. World Health Organisation – Diabetes, as at June 2016. Cancer Connect.net – http://news.cancerconnect.com/worldwide-cancer-has-
         biggest-economic-impact-of-any-cause-of-death

                                                                                                                                                                                6
Why Health Care? Accelerating Innovation
Dramatic improvements in genetic sequencing

Cost per genome                                                                                                                                                                               Gene sequencing advancing medicine
$100,000,000
                                                                                                                                                                                              • The Human Genome Project was
                                                                                                                                                                                                initially completed in 2000 after 13 years
 $10,000,000                                                                                                                                                                                    and $3B in costs.
                                                                                                                                                 Moore’s Law*
                                                                                                                                                                                              • Rapid innovation has driven cost below
  $1,000,000
                                                                                                                                                                                                $1000 per genome.

    $100,000                                                                                                                                                                                  • Applications include targeted cancer
                                                                                                                                                                                                therapy, prenatal screening, and
                                                                                                                                                                                                treatments for rare genetic diseases.
        $10,000

          $1,000

           $100
                   Jul-01

                            Jul-02

                                     Jul-03

                                              Jul-04

                                                       Jul-05

                                                                Jul-06

                                                                         Jul-07

                                                                                  Jul-08

                                                                                           Jul-09

                                                                                                    Jul-10

                                                                                                             Jul-11

                                                                                                                      Jul-12

                                                                                                                               Jul-13

                                                                                                                                        Jul-14

                                                                                                                                                 Jul-15

                                                                                                                                                          Jul-16

                                                                                                                                                                   Jul-17

                                                                                                                                                                            Jul-18

                                                                                                                                                                                     Jul-19
Source:    National Human Genome Research Institute, as at July 2019
Note:      *Moore's law refers to a prediction by Intel co-founder Gordon Moore that the number of transistors on
           integrated circuits would double every two years. Moore’s law has been credited with driving advances
           in the semiconductor industry that helped make computing widespread and affordable.

                                                                                                                                                                                                                                             7
Why Health Care? Accelerating Innovation
Dramatic improvements in scientific productivity

Number of drugs receiving FDA approval                     Blockbuster biotech drug sales ($Billions)
 240                                                       $300
                                                 220                                                                             $269B
                                96% Increase
 200                                                       $250

                                     158                   $200
 160

                                                           $150
 120              112

                                                           $100
  80

                                                            $50
  40

                                                             $0

                                                                  1999
                                                                  2000
                                                                  2001
                                                                  2002
                                                                  2003
                                                                  2004
                                                                  2005
                                                                  2006
                                                                  2007
                                                                  2008
                                                                  2009
                                                                  2010
                                                                  2011
                                                                  2012
                                                                  2013
                                                                  2014
                                                                  2015
                                                                  2016
                                                                  2017
                                                                  2018
                                                                  2019
    0
              2005-2009            2010-2014   2015-2019

                                                             Source: Janus Henderson Investors, ISI Evercore Research, as at 31/12/19
Source:   FDA, as at 31/12/19                                Note:   Blockbuster drug = > $1 billion in annual sales

                                                                                                                                         8
Why Health Care? Demographics
Health care spending to increase as the US undergoes a demographic shift

US population age 65+ (millions)                                 Health care spending per capita

                                                               $20,000
                                                                                                                          18,424

                                                               $15,000

                                                                                                     3.0x

                                                               $10,000

                                                                                        6,125
                                                                $5,000

                                                                    $0
                                                                                  Adults 65 years

    • 10K people a day in the US will turn 65 through 2030      •    People over 65 spend 3x more on health care
                                                                     than adults under 65

                                                             Sources: Kaiser Family Foundation analysis of a 5 percent sample of Medicare claims from
                                                                      the Chronic Conditions Data Warehouse, 2011. Center for Medicare and Medicaid
Source:   U.S. Census Bureau.                                         Services, Office of the Actuary, National Health Statistics Group, 2010.

                                                                                                                                                    9
Why Health Care? Globalisation
Higher GDP correlated with higher health care spending

GDP growth drives health care spending*

Source: * OECD Health Data 2011; WHO Global Health Expenditure Database as at 28 October 2011

                                                                                                10
Why Health Care? Defensive Characteristics
 Health care has typically held up better in down markets with lower volatility
  Performance and downside capture
  MSCI World Health Care IndexSM averaged 51% downside capture of MSCI World IndexSM returns
                         MSCI World IndexSM                 MSCI World Health Care IndexSM                      Downside Capture

                                          4/2000 - 9/2002                          11/2007 - 2/2009                       5/2011 - 9/2011                  2/2020 - 3/2020
                            0
Cumulative Returns (%)

                                                                                                                                       -9.56
                          -10                           -14.15                                                                                                           -13.88
                                                                                                                        -19.43
                          -20                                                                                                                             -23.53

                          -30                                                                    -34.54

                          -40           -46.31                                                                                   49%                               59%
                          -50                                                    -53.65

                          -60
                                                 31%                                      64%

                                             Beta                                                                     Standard Deviation
                                             10 Year Period (30/09/10 – 30/09/20)                                     10 Year Period (30/09/10 – 30/09/20)
                                             MSCI World Health Care IndexSM                                           MSCI World Health Care Index
                                                                                                                                                     SM
                                                                                                                                                           12.27
                                                                                              0.73
                                             vs. MSCI World IndexSM
                                                                                                                                        SM
                                                                                                                      MSCI World Index                     13.57

   Source:                   FactSet, as at 30/09/20
   Note:                     Past performance is no guarantee of future results.
                             Chart reflects market declines of 15% or greater in the MSCI World IndexSM since 2000.

                                                                                                                                                                                  11
Why Health Care? Historical Valuations
Historical health care valuations (1 year forward P/E)

                      70.0x

                      60.0x

                      50.0x
 1 Year Forward P/E

                      40.0x

                      30.0x
                                                                                                                                                                                                                                                                                      25.6x
                      20.0x                                                                                                                                               Average: 18.1x
                                                                                                                                                                                                                                                                                      17.7x
                                                                                                                                                                                                                                                                                     12.0x
                      10.0x

                       0.0x
                              Sep-93

                                       Sep-94

                                                Sep-95

                                                         Sep-96

                                                                  Sep-97

                                                                           Sep-98

                                                                                    Sep-99

                                                                                             Sep-00

                                                                                                      Sep-01

                                                                                                               Sep-02

                                                                                                                        Sep-03

                                                                                                                                 Sep-04

                                                                                                                                          Sep-05

                                                                                                                                                   Sep-06

                                                                                                                                                            Sep-07

                                                                                                                                                                     Sep-08

                                                                                                                                                                              Sep-09

                                                                                                                                                                                       Sep-10

                                                                                                                                                                                                Sep-11

                                                                                                                                                                                                         Sep-12

                                                                                                                                                                                                                  Sep-13

                                                                                                                                                                                                                           Sep-14

                                                                                                                                                                                                                                    Sep-15

                                                                                                                                                                                                                                             Sep-16

                                                                                                                                                                                                                                                      Sep-17

                                                                                                                                                                                                                                                               Sep-18

                                                                                                                                                                                                                                                                        Sep-19

                                                                                                                                                                                                                                                                                 Sep-20
                                                  S&P 500® Index                                         S&P 500® Health Care Index                                                     S&P Biotechnology Select Industry Index

                                                                                                  S&P 500® Health Care Index Average P/E (30/09/93 – 30/09/20)

Source: Bloomberg, as at 30 September 2020

                                                                                                                                                                                                                                                                                              12
The Case for Active Management
Active management based on fundamental research is important as:
• Binary nature of drug development often results in extreme outcomes
• Large disparity between winners and losers

10 year average disparity of returns for the top 5 and                                                                                                                                                                                                           Average performance of top 5 and bottom 5
bottom 5 of each Sector (01/01/10 – 31/12/19)                                                                                                                                                                                                                    health care stocks
                                350                                                                                                                                                                                                                                             Average of Top 5
Difference in Performance (%)

                                                                                                                                                                                                                                                                400             Average of Bottom 5
                                300
                                                                                                                                                                                                                                                                350             Avg. of All Health Care Stocks
                                250

                                                                                                                                                                                                                                Annual Stock Performance (%)
                                                                                                                                                                                                                                                                300
                                200
                                                                                                                                                                                                                                                                250
                                150
                                                                                                                                                                                                                                                                200
                                100
                                                                                                                                                                                                                                                                150
                                50
                                                                                                                                                                                                                                                                100
                                 0-
                                                                                                                                                                                                                                                                  50
                                          Health Care

                                                                                                          Industrials

                                                                                                                        Financials

                                                                                                                                     Energy

                                                                                                                                                                                                                    Utilities
                                                                                 Consumer Discretionary

                                                                                                                                                          Consumer Staples

                                                                                                                                                                             Communication Services

                                                                                                                                                                                                      Real Estate
                                                        Information Technology

                                                                                                                                              Materials

                                                                                                                                                                                                                                                                   0
                                                                                                                                                                                                                                                                 -50
                                                                                                                                                                                                                                                               -100

                                                                                                                                                                                                                                                                         2010

                                                                                                                                                                                                                                                                                  2011

                                                                                                                                                                                                                                                                                         2012

                                                                                                                                                                                                                                                                                                2013

                                                                                                                                                                                                                                                                                                        2014

                                                                                                                                                                                                                                                                                                               2015

                                                                                                                                                                                                                                                                                                                       2016

                                                                                                                                                                                                                                                                                                                              2017

                                                                                                                                                                                                                                                                                                                                      2018

                                                                                                                                                                                                                                                                                                                                             2019
                                                                                                                                                                                                                                                               Source:   Wilshire 5000 Index as at 31/12/19. Includes average performance of stocks
                                                                                                                                                                                                                                                                         over $500M in market cap.
                                                                                                                                                                                                                                                               Note:     When valuations fall and market and economic conditions change it is
Source:                               Janus Henderson Analytics, as at 31/12/19                                                                                                                                                                                          possible for both actively and passively managed investments to lose value.
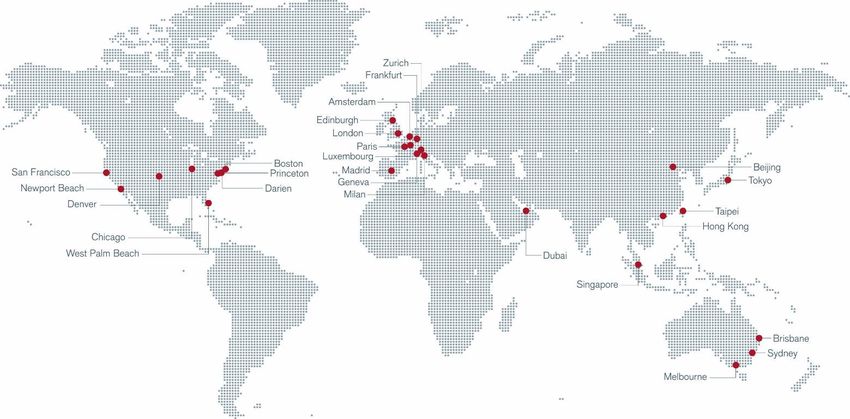
                                                                                                                                                                                                                                                                                                                                                       13
The Case for Active Management: The 90/90 Rule
Clinical Risk                                                    Commercial Risk

90% of drugs that enter human clinical trials                    90% of the time consensus estimates for new drug
never make it to the market.                                     launches are wrong, in our experience.

          Phase I                                                                                            Actual Revenue
                                                                                                             (above consensus)

                                              37% failure rate

            Phase II

                                                                  Revenue
                                           69% failure rate                                                  Initial consensus
                                                                                                             estimates

               Phase III

                                        50% failure rate
                                                                                                             Actual Revenue
                 Approved                                                                                    (below consensus)

                                                                    Launch      Year 1          Year 2    Year 3
                                                                                         Time

Source:   BIO Industry Analysis, 2016

                                                                                                                                 14
Commercial Risk
Evaluation of the “Three P’s”

Physicians:                                                         Tools:
     •     Improvement over current practice                          •      Proprietary Physician Surveys
     •     Ease of administration                                     •      Prescription Trend Analysis
     •     Financial considerations                                   •      Scenario Simulations

Patients:                                                           Case Study: Dupixent Revenues (USD)
     •     Size of addressable population                           Actual vs. Consensus

     •     How patient functions, feels, or survives                $2,500                                       +99%     2,322
                                                                                 Consensus
     •     Affordability and ease of use                                         Actual
                                                                    $2,000

Payers:
                                                         Millions                                    +82%
                                                                    $1,500
                                                                                                                  1,164
     •     Cost effectiveness                                                                              931
                                                                    $1,000
     •     Reimbursement hurdles
                                                                                  +122%             512
                                                                     $500
                                                                                          247
                                                                                 111
                                                                       $0
                                                                                    2017              2018           2019

Source:   Bloomberg consensus data as of January 2017.
Note:     For illustrative purposes only.

                                                                                                                                  15
Janus Henderson
    Global Life Sciences Fund

Investment Objective
The Fund aims to provide capital growth over the long term.
Performance target: To outperform the MSCI World Health Care Index by at least 2% per annum, before the deduction of
charges, over any 5 year period.
The Fund invests in shares (also known as equities) of companies, of any size, with a life sciences orientation, in any country.
The Fund may also invest in other assets including cash and money market instruments.
The investment manager may use derivatives (complex financial instruments) to reduce risk, to manage the Fund more
efficiently, or to generate additional capital or income for the Fund.
The Fund is actively managed with reference to the MSCI World Health Care Index, which is broadly representative of the
companies in which it may invest, as this forms the basis of the Fund’s performance target. The investment manager has
discretion to choose individual investments for the Fund with weightings different to the index or not in the index, but at times
the Fund may hold investments similar to the index.
Investment Philosophy

We believe in the power of deep fundamental research to identify life science companies trading at a
significant discount to intrinsic value. We believe the quality of our team, the depth of our research and
our disciplined long-term approach set us apart in pursuing superior risk-adjusted results for our clients.

Janus Henderson Global Life Sciences Fund

Experienced and specialized investment team
   •   More than a century of combined health care investment experience

Differentiated fundamental research
   •   Seek to understand the science and the business

Disciplined investment process
   •   Diversified approach across industries, geographies and market capitalizations
   •   Value at Risk Framework

                                                                                                              17
Janus Henderson Global Life Sciences
Experienced team of specialists with over a century of combined health care investment experience

      Portfolio Management                           Broader Health Care Team

                                                              Daniel Lyons, PhD, CFA                          Aaron Schaechterle
                       Andy Acker, CFA                        Biotechnology                                   Medical Technology
                       Portfolio Manager                      20yrs investment experience                     13yrs investment experience
                       24yrs investment experience

  •    Leads the firm’s Health Care Sector
       Research Team
                                                              Rich Carney, CFA                                Luyi Guo, PhD, CFA
                                                              Health Care Services
  •    Joined Janus in 1999 as a research                     26yrs investment experience
                                                                                                              Pharmaceuticals
                                                                                                              7yrs investment experience
       analyst focused on biotechnology and
       pharmaceutical companies

  •    B.S. degree in biochemical sciences
       from Harvard University, graduating
                                                              Agustin Mohedas, PhD                            Tim McCarty, CFA
       magna cum laude and Phi Beta Kappa                     Biotechnology                                   Medical Technology
                                                              6yrs investment experience                      8yrs investment experience
  •    MBA with honors from Harvard Business
       School

                                                                                            Ryan Smith, CFA
                                                                                            Pharmaceuticals
                                                                                            Associate Analyst
                                                                                            11yrs investment experience

Source: Janus Henderson Investors, as at 30/09/20
Note:   See appendix for complete biographies.

                                                                                                                                            18
Investment Process Overview
Intensive fundamental analysis

            Fundamental research          Financial modeling               Valuation

           Identify investment          Forecast key leverage     Establish absolute
           opportunities through:       points using:             valuation targets:
Focused    • Physician interviews       • Model components        • Primary valuation tools          Buy-rated
universe   • Medical conferences          •   Revenue build out     •   Discounted Cash               stocks
           • Scientific literature        •   Expense analysis          Flow (DCF) analysis
                                        • Income statement,         •   Free cash flow yield
           • Industry contacts                                      •   Sum of the parts valuation
           • Management meetings          balance sheet and
                                                                    •   Private transaction
           • Customer surveys             cash flow statement           multiples
           • Proprietary prescription   • Financial statements    • Secondary valuation
              database                    linked                    tools
                                                                    •   Relative valuation
                                                                    •   Peer group analysis

                                                                                                                 20
Investment Process Overview
Stock selection and portfolio construction

•       Objective is to construct a diversified sector portfolio that represents the best ideas of our
        Global Life Sciences Team
•       Analysts make recommendations; PMs make the final decision

        •     70–100 holdings                                                                        •     Non-US holdings range from 20%–40%
        •     85%–90% of portfolio “Buy” or “Strong Buy” rated                                       •     Diversified across subsectors and market cap

                    Core growth                                                Emerging growth                                                     Opportunistic
                     40%–60%                                                      20%–30%                                                           20%–30%

                                                                          Portfolio construction
    •       Dominant franchises – superior                        •      New product cycles                                      •      Restructurings, spinoffs and
            products and services                                 •      Significant pipeline opportunities                             mergers
    •       Strong management with                                •      Accelerating top/bottom line                            •      Hidden assets
            significant equity ownership                                                                                         •      Missed expectations or short-
    •       Efficient use of capital                                                                                                    term issues
    •       Sustainable free cash flow
            generation

Note:       Please note that these ranges are reflective of the portfolio managers’ investment process and style at the time of publication. They may not be hard limits and are subject
            to change without notice. Please refer to the Prospectus for the broader parameters within which the Fund may operate.

                                                                                                                                                                                           21
Portfolio Composition
Diversified across the sub sectors within health care

Portfolio composition                                                 MSCI World Health Care IndexSM
Target range                                                          (% of Index)
                              100%

    25% – 40%
                              90%
    Pharmaceuticals
                                                             34.77%
                              80%                                         40.34%        Pharmaceuticals
    25% – 40%
    Biotechnology             70%

                              60%
    15% – 30%
    Devices & Medical Tech.                                  30.31%       14.09%
                              50%                                                       Biotechnology

    10% – 20%                 40%
    Health Care Services

                              30%
                                                                          32.30%        Devices & Medical Tech.
    Other                                                    24.94%
                              20%

                              10%
                                                              9.75%       13.27%        Health Care Services
                               0%
                                     Mar-09

                                     Mar-10

                                     Mar-11

                                     Mar-12

                                     Mar-13

                                     Mar-14

                                     Mar-15

                                     Mar-16

                                     Mar-17

                                     Mar-18

                                     Mar-19

                                     Mar-20
                                     Sep-09

                                     Sep-10

                                     Sep-11

                                     Sep-12

                                     Sep-13

                                     Sep-14

                                     Sep-15

                                     Sep-16

                                     Sep-17

                                     Sep-18

                                     Sep-19

                                     Sep-20
                                                                       (as at Sep-20)

Source: Janus Henderson Investors, as at 30 September 2020

                                                                                                                  22
Portfolio Construction
Position sizing and value at risk

                                                                                                       VAR Example

                                                                                                                              Maximum Position
                     Larger                                     VaR
                     Position Size                                                                                                Size 2%

                                                                                                                                                            50%
 Discount                                                                                                                                                   potential
                                                                                                                                                            drawdown
to intrinsic
                                                                                                   100 bps VaR
   value

                                                 Risk
Value at risk framework
• Assess downside risk in worst-case scenario for any foreseeable event
• Limit position size so worst-case scenario impact on portfolio won’t exceed 100 basis points
• Example: If worst case is 50% drop in stock price, position size is no more than 2%

Note:   Any risk management process discussed includes an effort to monitor and manage risk which should not be confused with and does not imply low risk or the ability to
        control certain risk factors

                                                                                                                                                                              23
Investment Process Overview
Sell discipline

Reasons a stock may be sold:
•   Price rise reflects Janus Henderson’s estimate of intrinsic value
•   Company or industry fundamentals change or portfolio manager believes competitive
    advantages have deteriorated
•   Portfolio upgraded with a new idea that the portfolio manager believes represents
    better risk/reward opportunity
•   Position size exceeds “Value at Risk” parameters

                                                                                        24
Portfolio Review
Global Life Sciences Fund – Characteristics

 Top Holdings (%)                           Global Life           MSCI World Health                                              Global Life    MSCI World Health
                                                                                                    Countries (%)
 (29.03% of Fund)                         Sciences Fund             Care IndexSM                                               Sciences Fund      Care IndexSM

 UnitedHealth Group, Inc.                        3.47                      4.90                     United States                  82.05              69.17
 Merck & Co., Inc.                               3.39                      3.22                     Switzerland                    6.40               8.50
 Thermo Fisher Scientific, Inc.                  3.21                      3.17
                                                                                                    United Kingdom                 3.73               4.01
 AbbVie, Inc.                                    3.03                      2.55
                                                                                                    Denmark                        2.66               2.87
 Novartis AG (ADR)                               3.02                        —
                                                                                                    France                         2.01               2.34
 Roche Holding AG                                2.90                      3.82
                                                                                                    Japan                          1.29               6.41
 AstraZeneca PLC                                 2.85                      2.24
                                                                                                    Belgium                        0.91               0.49
 Abbott Laboratories                             2.47                      3.15
 Humana, Inc.                                    2.45                      0.90                     China                          0.53                —

 Bristol-Myers Squibb Co.                        2.24                      2.24                     Germany                        0.31               2.37

                                            Global Life          MSCI World Health                  Market Capitalization of      Global Life   MSCI World Health
 Characteristics
                                          Sciences Fund            Care IndexSM                     Equity Holdings (%)         Sciences Fund     Care IndexSM

 Number of Holdings                              124                       155                      $0 to $2B                       11.21              0.02
 Weighted Average Market Cap                   $86.6 B                  $124.0 B                    $2B to $10B                     17.24              2.78
 Median Market Cap                              $9.7 B                   $19.5 B                    $10B to $15B                     8.58              5.14
 Turnover Ratio (1 year trailing)                43%                        —                       Over $15B                       62.97             92.06

                                                                                                    Total                           100.00            100.00
Source:   Janus Henderson Investors, as at 31/10/20

Note:     Portfolio holdings are subject to change without notice. The portfolio holdings presented represent
          securities held as of the period indicated, and may not be representative of current or future
          investments. No assumption should be made that the securities identified as being profitable will
          continue to be profitable. This material is provided for illustrative purposes only and should not be
                                                                                                                                                                    25
          construed as an offer to sell, or the solicitation of offers to buy, or a recommendation for any security.
Performance and Characteristics
Performance
Strong long-term performance versus health care sector

  Performance (%)                                                        October              YTD          1 year         3 year          5 year       10 year       Since PM
                                                                            2020                                                                                     inception
                                                                                                                                                                     (01/05/07)

  Global Life Sciences Fund (Class I2 USD Shares)                                -1.79        7.50          20.96          12.86            8.66          16.17              11.69

  MSCI World Health Care IndexSM                                                 -4.88        1.07            9.45           9.28           7.53          12.29               8.30

  Difference (Fund vs MSCI World Health Care IndexSM)                         +3.09          +6.43         +11.51          +3.58           +1.13          +3.88              +3.39

  0                                                                                                                                                Janus Henderson Global Life
                                               10th                                                  2nd                        3rd
                                                                                                                                                   Sciences Fund (I2 USD shares)
 25                 25th                                                  21st

 50

 75

100
                1 year                     3 year                    5 year                    10 year               Since PM Inception

Source:   Morningstar, as at 31/10/20
Note:     Returns include reinvestment of dividends and capital gains. Returns greater than one year are annualised. Morningstar ranking are shown using the Sector Equity
          Healthcare Category, net of fees in USD.
          © 2020 Morningstar, Inc. All Rights Reserved.
          Past performance is not a guarantee of future results.

                                                                                                                                                                                     27
Performance
Strong long-term performance versus the broad market

  Performance (%)                                                         October             YTD          1 year      3 year   5 year   10 year   Since PM
                                                                             2020                                                                  inception
                                                                                                                                                   (01/05/07)

  Global Life Sciences Fund (Class I2 USD Shares)                              -1.79           7.50          20.96      12.86     8.66     16.17        11.69

  MSCI World IndexSM                                                          -3.07           -1.42           4.36      5.96     8.13       8.64        4.93

  Difference (Fund vs MSCI World IndexSM)                                     +1.28           +8.92         +16.60      +6.90    +0.53     +7.53       +6.76

Source:   Morningstar, as at 31/10/20
Note:     Returns include reinvestment of dividends and capital gains. Returns greater than one year are annualised.
          © 2020 Morningstar, Inc. All Rights Reserved.
          Past performance is not a guarantee of future results.

                                                                                                                                                                28
Consistent Outperformance
in Global Life Sciences Fund

Annualised monthly rolling 3 year performance*(%)

                                                                                                                                                                            79%
                                                       45
                                                                                    Outperformed
Global Life Sciences Fund (Annualised 3 year return)

                                                       40                                                                                                                                                of the time
                                                       35

                                                       30
                                                                                                                                                                            Janus Henderson Global Life
                                                                                                                                                                            Sciences Fund* outperformed
                                                       25                                                                                                                   the MSCI World Health Care
                                                       20
                                                                                                                                                                            Index 104 of 131 monthly
                                                                                                                                                                            rolling 3-year periods, or 79%
                                                       15                                                                                                                   of the time since implementing
                                                       10                                                                                                                   our “Value at Risk” approach on
                                                                                                                                                                            01/01/07.
                                                        5

                                                        0

                                                        -5                                                                                         Underperformed

                                                       -10
                                                             -10      -5       0        5        10       15       20       25       30       35       40       45
                                                                            MSCI World Health Care Index (Annualised 3 year return)

    Source: Morningstar, as at 31/10/20. * Data shown is for the “Value at Risk” approach period from 01/01/07 – 31/10/20
    Note:   * Statistics are for Class I2 USD Shares. See pages 27 and 28 for complete performance and disclosure.
            © 2020 Morningstar, Inc. All Rights Reserved.
                                                             Past performance is not a guarantee of future results. There is no assurance that the investment process will consistently lead to successful investing.

                                                                                                                                                                                                                        29
Performance
Global Life Sciences Fund vs MSCI World Healthcare Index

 Annualised Performance (%)                              I2 USD (Net)                         Index                      I2 USD (Gross)      Target (Gross)*

 5 years (annualised)                                         9.61                             9.90                            11.45              12.09
 10 years (annualised)                                       16.58                            13.08                            18.57              15.34
 Since Inception (annualised)                                 8.19                             7.59                            10.02              9.74

 Discrete Performance (%)                                I2 USD (Net)                         Index                      I2 USD (Gross)      Target (Gross)*

 Sept 2019 – Sept 2020                                       29.90                            20.81                            32.05              23.23
 Sept 2018 – Sept 2019                                       -6.80                             -1.83                               -5.26          0.15
 Sept 2017 – Sept 2018                                       16.66                            14.17                            18.63              16.45
 Sept 2016 – Sept 2017                                       13.19                            12.41                            15.11              14.65
 Sept 2015 – Sept 2016                                       -1.01                             5.33                                0.67           7.44

                                                                                                                                           For Dutch Investors:

Source:   Janus Henderson Investors, 30/09/20
Note:     Since inception date: 31/03/00
          *Performance target: To outperform the MSCI World Health Care Index by at least 2% per annum, before the deduction of
          charges, over any 5 year period.
          Please note the performance target is to be achieved over a specific annualised time period.
          Discrete performance data may change due to final dividend information being received after quarter end if applicable.
          Past performance is not a guide to future performance.

                                                                                                                                                                  30
Performance and Risk/Reward Statistics
Performance in up and down markets
                                                                  Global Life Sciences Fund vs. MSCI World Health Care IndexSM
                                                        10 year average up and down monthly returns (31 October 2010 – 31 October 2020)
                                                       6.00
                         Average monthly returns (%)

                                                                Global Life Sciences Fund*
                                                                                                               3.64
                                                       4.00     MSCI World Health Care Index                                 2.99

                                                       2.00
                                                                             (-27 bps)
                                                       0.00
                                                       -2.00                                                      (+65 bps)

                                                       -4.00             -3.07         -2.80

                                                       -6.00
                                                                          41 down months                         80 up months

 Risk and Reward statistics (Fund vs MSCI World Health Care IndexSM)                                                     3 year                 5 year                 10 year

 Annualised Relative Return (Class I2 USD Shares)                                                                          3.58                   1.13                    3.88

 Information Ratio                                                                                                         0.50                   0.15                    0.47
 Sharpe Ratio                                                                                                              0.64                   0.44                    0.98

 Standard Deviation                                                                                                       17.30                  16.70                   15.74

 Beta (vs MSCI World Health Care IndexSM)                                                                                  1.09                   1.16                    1.13

 Beta (vs MSCI World IndexSM)                                                                                              0.86                   0.92                    0.86
 R-squared (%)                                                                                                            86.00                  85.10                   79.24

 Annualised Upside Capture / Downside Capture                                                                     117% / 105%            116% / 117%               121% / 113%
Source: Morningstar, as at 31 October 2020. © 2020 Morningstar, Inc. All Rights Reserved.
Note:   Up and down calendar months are determined by the returns of the index shown. *Statistics are for Class I2 USD Shares
        Past performance is not a guarantee of future results. There is no assurance that the investment process will consistently lead to successful investing.

                                                                                                                                                                                 31
Risk-Adjusted Return Percentile Rankings
Global Life Sciences Fund as at 31 October 2020

Information Ratio(%)                                                                                                         Sharpe Ratio(%)
                                 0                                                                                                                             0
                                                                                                     3rd                                                                                                        3rd
                                                   8th                                                                                                                        11th

                                                                                                                             Peer Group Percentile Ranking
Peer Group Percentile Ranking

                                                                            18th
                                25                                                                                                                            25                              26th

                                50                                                                                                                            50

                                75                                                                                                                            75

                                100                                                                                                                          100

                                                                        3 year        5 year       10 year                                                                                 3 year    5 year   10 year

                                Global Life Sciences Fund*                0.50          0.15           0.47                                                   Global Life Sciences Fund*    0.64      0.44       0.98

            MSCI World Health Care IndexSM                                  —              —               —                                   MSCI World Health Care IndexSM               0.51      0.47       0.94

            Sector Equity Healthcare                                     -0.25          -0.28         -0.40                                    Sector Equity Healthcare                     0.37      0.28       0.67
            Category Peer Group Median                                                                                                         Category Peer Group Median

            Member Count                                                   371           306           202                                     Member Count                                  371       306       202

     Source:                          Morningstar Inc., as at 31 October 2020
     Note:                            Ranking is for the share class shown only; other classes may have different performance characteristics. When an expense waiver is in effect, it may have a material
                                      effect on the total return or yield, and therefore the ranking and rating for the period. *Statistics are for Class I2 USD Shares.
                                      © 2020 Morningstar, Inc. All Rights Reserved.
                                      Past performance is not a guarantee of future results. There is no assurance that the investment process will consistently lead to successful investing.

                                                                                                                                                                                                                        32
Why Janus Henderson Global Life Sciences?

Experienced and specialised investment team
     •     Over a century of combined health care investment experience

Differentiated fundamental research
     •     Understand the science and the business

Disciplined investment process
     •      Diversified approach across industries, geographies and market capitalisations
     •      Value at Risk Framework

Strong performance
     •     The Global Life Sciences Fund* outperformed 97% of Morningstar Sector Equity Healthcare peers
           since PM inception
     •     The Global Life Sciences Fund* outperformed the MSCI World Index by 600 bps per year since
           PM inception

Source:   Janus Henderson Investors, as at 31 October 2020
Note:     * Statistics are for Class I2 USD Shares.
          Past performance is no guarantee of future results. See page 27 and 28 for performance.

                                                                                                           33
Appendix
Biographies – Investment Team
Andy Acker, CFA, Portfolio Manager
Andy Acker is a Portfolio Manager at Janus Henderson Investors responsible for managing the Global Life Sciences and Biotechnology strategies since 2007 and
2018, respectively. He also leads the firm’s Health Care Sector Research Team. Andy was assistant portfolio manager on the Global Life Sciences strategy from
2003 to 2007. He joined Janus in 1999 as a research analyst focused on companies in the biotechnology and pharmaceutical industries. Prior to this, he worked as
a strategy consultant for the Boston Consulting Group and as a health care analyst for Morgan Stanley Venture Partners.
Andy received his bachelor of science degree in biochemical sciences from Harvard University, graduating magna cum laude and Phi Beta Kappa. He also earned
an MBA with honors from Harvard Business School. Andy holds the Chartered Financial Analyst designation and has 24 years of financial industry experience.

Daniel Lyons, PhD, CFA, Portfolio Manager | Research Analyst
Daniel Lyons is a Portfolio Manager and Research Analyst at Janus Henderson Investors responsible for co-managing the Biotechnology strategy since 2018.
Daniel started consulting for Janus in 1997 and joined the Health Care Sector Research Team full time in 2000. As a research analyst, he focuses on the
biotechnology and life science tools sectors.
Daniel received his bachelor of arts degree in biochemistry and chemistry from Rice University, graduating magna cum laude. He also earned a PhD from Stanford
University’s program in immunology and conducted postdoctoral research with a Nobel Laureate at the University of Colorado. He holds the Chartered Financial
Analyst designation and has 20 years of financial industry experience.

Aaron Schaechterle, Research Analyst
Aaron Schaechterle is a Research Analyst at Janus Henderson Investors primarily focused on small- and mid-capitalisation companies in the Health Care and
Industrials & Materials sectors. He is a member of the Health Care and Industrials & Materials Sector Research Teams and covers health care information and
medical technology companies. Additionally, Aaron serves as Assistant Portfolio Manager on the US Small Company Growth, US Small-Mid Cap Growth, and US
Mid Cap Growth strategies. Prior to joining Janus in 2014, he worked in the information services and technology group at GTCR, a Chicago-based private equity
firm. Before that, he served as an investment banking analyst for Barclays Capital and Lincoln International, executing corporate finance transactions and advisory
projects for clients in the financial exchanges and industrial sectors.
Aaron earned his bachelor of business administration degree in finance from the University of Iowa, where he served as captain of the varsity tennis team. He
received his MBA from Harvard Business School, graduating with high distinction as a Baker Scholar. Aaron has 13 years of financial industry experience.

                                                                                                                                                                      35
Biographies – Investment Team
Rich Carney, Research Analyst
Rich Carney is a Research Analyst at Janus Henderson Investors primarily focused on companies in the Health Care sector. Prior to joining Janus in 2015, Rich
was a portfolio manager for Gerlach, Way, Scarth & Associates, where he managed high-net-worth portfolios. Previously, he was a partner and portfolio
manager/analyst at Platte River Capital responsible for co-managing an equity portfolio as the lead analyst in the health care and financial services sectors. Rich’s
experience also includes serving as a research analyst at The Boston Company, Silvergate Capital Management, and Invesco.
Rich received his bachelor of arts degree in economics from Rutgers University and a master of science degree in finance from Northeastern University. He holds
the Chartered Financial Analyst designation and has 26 years of financial industry experience.

Luyi Guo, PhD, CFA, Research Analyst
Luyi Guo is a Research Analyst on the Health Care Sector Research Team at Janus Henderson Investors, a position she has held since 2019. Before joining the
firm, she was vice president, senior equity analyst at PNC Capital Advisors from 2015. She held marketing roles in the oncology divisions at Novartis and its
predecessor, GlaxoSmithKline, from 2011 and was an assistant vice president in healthcare corporate banking at PNC Financial Services Group from 2009. Luyi
started her professional career as a medicinal chemist in 2002 in the biotechnology industry.
Luyi received her bachelor of science degree in chemistry from Central Michigan University, graduating summa cum laude and receiving the Michigan Governing
Board Award. She also earned a PhD in medicinal chemistry from the University of Michigan – Ann Arbor and an MBA from the Wharton School at the University of
Pennsylvania, where she graduated with distinction. She holds the Chartered Financial Analyst designation and has 7 years of financial industry experience.

Agustin Mohedas, PhD, Research Analyst
Agustin Mohedas, PhD is a Research Analyst at Janus Henderson Investors focused primarily on stocks in the biotechnology sector, a position he has held since
2019. Before joining the firm, Agustin was a senior analyst at Eventide Asset Management, working on the Healthcare and Life Sciences Fund from 2017. Prior to
this, he was an analyst with RA Capital Management, a long/short hedge fund focused on biotechnology, from 2014.
Agustin received his bachelor of science degree in biomedical engineering from Texas A&M University, graduating summa cum laude. He also earned a PhD in
medical engineering and medical physics from the Harvard-MIT Program in Health Sciences and Technology. His PhD research focused on drug development for
a rare genetic disease, resulting in multiple patents and publications. He has 6 years of financial industry experience.

                                                                                                                                                                        36
Biographies – Investment Team
Tim McCarty, CFA, Research Analyst
Tim McCarty is a Research Analyst on the Health Care Sector Research Team at Janus Henderson Investors, a position he has held since 2020. Before joining
the firm, Tim was at JPMorgan Asset Management from 2015, most recently as a research analyst focused on health care from 2017. He was a research associate
at Guttridge Capital Management from 2013 to 2015 while attending graduate school. He began his career in 2012 as an investment banking analyst at Stifel
Financial Corporation.
Tim received both a bachelor of arts degree (Hons) in economics with a pre-med concentration and a minor in entrepreneurship and management and his MBA
from Johns Hopkins University. He holds the Chartered Financial Analyst designation and has 8 years of financial industry experience.

Ryan Smith, CFA, Associate Analyst
Ryan Smith is an Associate Analyst at Janus Henderson Investors primarily focused on the health care sector. He has held this position since 2017. Prior to that,
Ryan was a research associate since 2014. Before joining the investment team, he worked in mutual fund operations on the financial and performance reporting
staff. Earlier in his career, Ryan was an investor accounting analyst at Aurora Bank FSB.
Ryan received his bachelor of science degree in finance from Miami University. He holds the Chartered Financial Analyst designation and has 11 years of financial
industry experience.

                                                                                                                                                                    37
Disclaimers

This material is intended solely for use by financial professionals from US only, servicing non-US persons only, where non-US Janus Henderson funds are made available to local
financial professionals for sale to persons based overseas or cross-border only. This material is not intended for citizens or residents of the United States.
Past performance is not a guide to future performance. The performance data does not take into account the commissions and costs incurred on the issue and
redemption of units. The value of an investment and the income from it can fall as well as rise and you may not get back the amount originally invested. Tax
assumptions and reliefs depend upon an investor’s particular circumstances and may change if those circumstances or the law change. If you invest through a third
party provider you are advised to consult them directly as charges, performance and terms and conditions may differ materially. Nothing in this document is intended to
or should be construed as advice. This document is not a recommendation to sell or purchase any investment. It does not form part of any contract for the sale or
purchase of any investment. The Fund is a recognised collective investment scheme for the purpose of promotion into the United Kingdom. Potential investors in the
United Kingdom are advised that all, or most, of the protections afforded by the United Kingdom regulatory system will not apply to an investment in the Fund and that
compensation will not be available under the United Kingdom Financial Services Compensation Scheme. The securities included in this document are not registered in
the Foreign Securities Registry of the Superintendencia de Valores y Seguros for public offering and, therefore, the use of this document is only for general information
purposes. This document is intended solely for the use of professionals and is not for general public distribution. Any investment application will be made solely on the
basis of the information contained in the Fund’s prospectus (including all relevant covering documents), which will contain investment restrictions. This document is
intended as a summary only and potential investors must read the Fund’s prospectus and key investor information document before investing. We may record
telephone calls for our mutual protection, to improve customer service and for regulatory record keeping purposes.
Janus Henderson Capital Funds Plc is a UCITS established under Irish law, with segregated liability between funds. Investors are warned that they should only make their
investments based on the most recent Prospectus which contains information about fees, expenses and risks, which is available from all distributors and paying agents, it should be
read carefully. An investment in the fund may not be suitable for all investors and is not available to all investors in all jurisdictions; it is not available to US persons. The rate of return
may vary and the principal value of an investment will fluctuate due to market and foreign exchange movements. Shares, if redeemed, may be worth more or less than their original
cost. This is not a solicitation for the sale of shares and nothing herein is intended to amount to investment advice.
The extract prospectus (edition for Switzerland), the articles of incorporation, the extract annual and semi-annual report, in German, can be obtained free of charge from the
representative in Switzerland: First Independent Fund Services Ltd (“FIF ”), Klausstrasse 33, CH-8008 Zurich, Switzerland, tel: +41 44 206 16 40, fax: +41 44 206 16 41, web:
http://www.fifs.ch. The Swiss paying agent is: Banque Cantonale de Genève, 17, quai de l’Ile, CH-1204 Geneva. The last share prices can be found on www.fundinfo.com. For
Qualified investors, institutional, wholesale client use only.
Austrian investors may obtain the current prospectus and simplified prospectus free of charge at Bank Austria Creditanstalt AG, AM Hof 2, 1010 Wien, Austria. This document is not
for public distribution in Belgium. German investors may obtain the current prospectus and simplified prospectus free of charge at State Street Bank GmbH, Brienner Str. 59, D-
80333, Munich, Germany. The Fund has been registered under the Act of the supervision of investment institutions in the Netherlands. Dutch investors may obtain the current
prospectus, simplified prospectus, annual report, semi annual report and Memorandum & Articles of Association from Citi Funds Services (Ireland) Ltd (in their capacity as
administrator). Janus Henderson Capital Funds Plc is an Irish collective investment scheme (IIC) registered in the National Securities Market Commission's (CNMV) registry with
registration number 265. Its custodian is Brown Brothers Harriman Trustee Services (Ireland) Limited and its Investment Advisor is Janus Capital International Limited, authorised
and regulated by the Financial Conduct Authority. Investors are warned that they should make their investments based on the IIC's latest documentation. You may consult with and
request from the distributor (Allfunds Bank, S.A.) and subdistributors in Spain as well as from the registries of the CNMV a copy of the marketing memorandum, the prospectus and
the latest published economic reports.

                                                                                                                                                                                                    38
Disclaimers
                                                                                                                                       Janus Henderson Investors
                                                                                                                                       201 Bishopsgate, London EC2M 3AE
                                                                                                                                       Tel: 020 7818 1818 Fax: 020 7818 1819

This document is intended to be distributed in Italy only to persons qualifying as professional investors, pursuant to article 31, paragraph 2, of CONSOB Regulation 11522/1998. Any
further dissemination of this document to other persons who do not qualify as professional investors is not permitted nor is authorised by Janus Henderson Investors.
Janus Henderson Investors is the name under which investment products and services are provided by Janus Capital International Limited (reg. no. 3594615), Henderson Global
Investors Limited (reg. no. 906355), Henderson Investment Funds Limited (reg. no. 2678531), AlphaGen Capital Limited (reg. no. 962757), Henderson Equity Partners Limited (reg.
no. 2606646), (each registered in England and Wales at 201 Bishopsgate, London EC2M 3AE and regulated by the Financial Conduct Authority) and Henderson Management S.A.
(reg. no. B22848 at 2 Rue de Bitbourg, L-1273, Luxembourg an regulated by the Commission de Surveillance du Secteur Financier).
Henderson Management S.A. is authorised to conduct its business in France through its French branch in accordance with the provisions of the European passporting system for
investment service providers pursuant to Directive 2004/39 of 21 April 2004 on markets in financial instruments. The French branch of Henderson Management S.A. is registered in
France as a société anonyme of an EC Member State or a State party to the Agreement on the European Economic Area, registered with the Paris Trade and Companies Register
(RCS) under number 848 778 544, and its registered office is located at 32, rue des Mathurins, 75008 Paris, France.
Janus Henderson, Janus, Henderson, Perkins, Intech, Alphagen, VelocityShares, Knowledge Shared and Knowledge Labs are trademarks of Janus Henderson Group plc or one of
its subsidiaries. © Janus Henderson Group plc.

                                                                                                                                                                                       39
You can also read