Sochacki Park Monitoring Data Summary 2020 - Brian Vlach Sr. Water Resources Manager - Three Rivers Park District
←
→
Page content transcription
If your browser does not render page correctly, please read the page content below
Sochacki Park Monitoring Data Summary
                2020

                           Brian Vlach
                           Sr. Water Resources Manager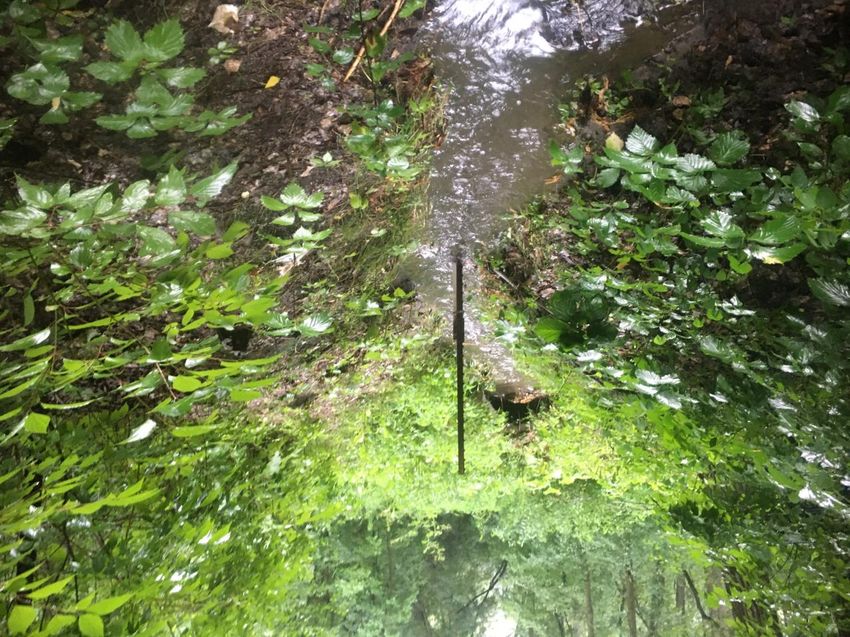
Sochacki Park
                   Sub-watershed Assessment
•   Sub-watershed Assessment conducted to understand and improve
    the water quality of the wetlands in Sochacki Park.
    ▪   Identify sources of pollutant loading
        ➢   Watershed
        ➢   Wetlands
    ▪   Implement Best Management Practices (BMP) to Improve Water Quality

•   Partnership Agencies
    ▪   Golden Valley
    ▪   Robbinsdale                   Joint Powers Agreement
    ▪   Three Rivers Park District
    ▪   Bassett Creek Watershed Management Commission

•   Objective
    ▪   Understand the ecological health of the wetlands
    ▪   Identify BMP’s to improve ecological health of the wetlands, improve
        aesthetics, and provide recreation and education opportunities
    ▪   Engage Stakeholders throughout the process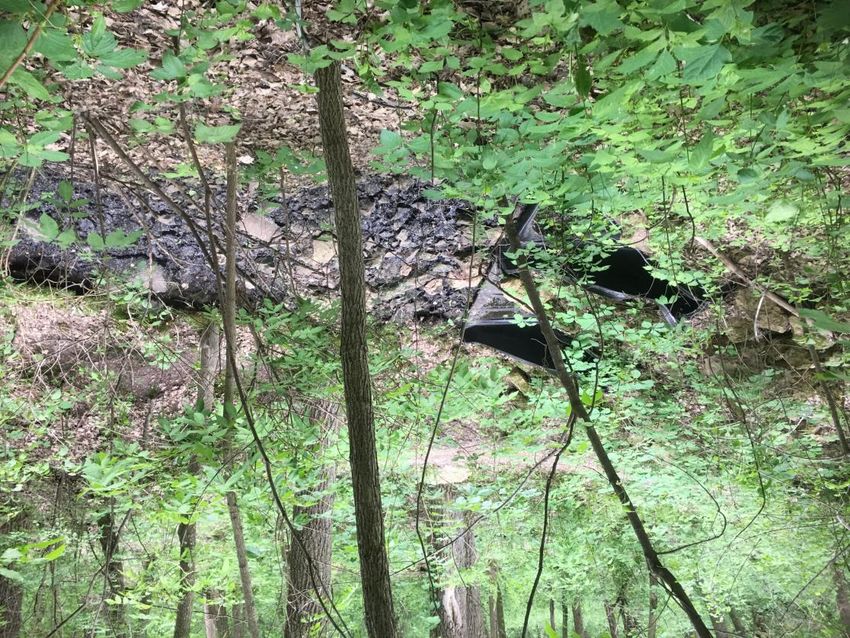
Sochacki Park Sub-watershed Assessment
                    Process
•   Monitoring – 2020 & 2021
    ▪   Watershed – Pollutant Loading Estimates
        ➢   Automated Sampling Equipment
        ➢   Flow & Velocity Measurements
        ➢   Water Quality – Nutrient Concentrations (TP, SRP, TSS, & TN)
    ▪   Wetlands
        ➢   Water Quality – (TP, SRP, Chl-a, and Secchi Depth)
        ➢   Aquatic Vegetation
        ➢   Dissolve Oxygen
        ➢   Sediment Core Analysis
        ➢   MnRAM – Assessing wetland function & value
        ➢   Water Levels

•   Watershed & Wetland Modeling (2021-2022)
    ▪   Calibrate Watershed and Wetland Model to monitoring Data
    ▪   Identify Sources of Pollutant Loading
    ▪   Develop recommended BMP’s that would result in pollutant load reductions to
        improve water quality
•   Implement BMP Practices to Improve Water Quality
    ▪   Identify those BMP practices that have a pollutant load reduction cost-benefit
    ▪   Develop BMP implementation plan
    ▪   Implementation of Project in the watershed and wetlands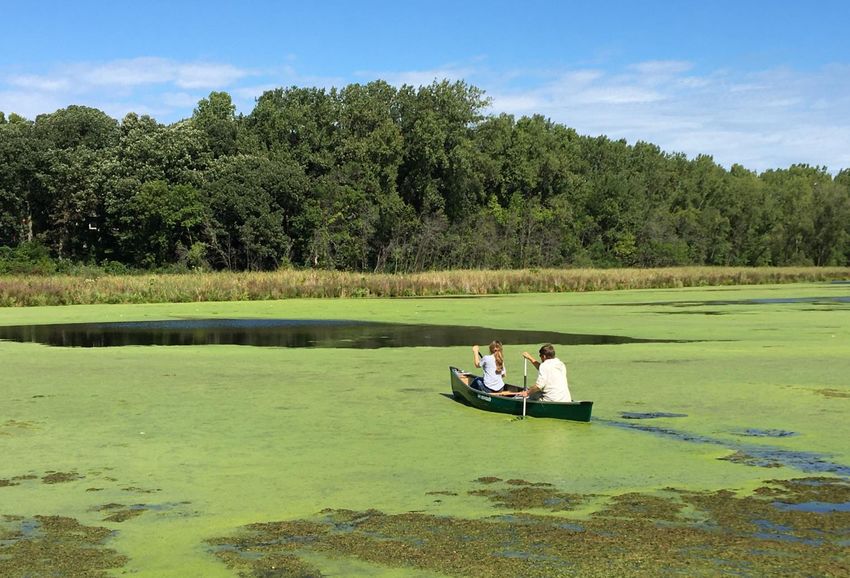
Bassett Creek Watershed Management Commission
              Barr Engineering Report
                       2013
• Assessment was completed on North and South Rice in 2013
  • Barr. (2013). Lake Water Quality Study Northwood Lake,
      North Rice Pond and South Rice Pond. Minneapolis, MN

• Water quality goals for the wetlands in the report
  •   Goals were set by the BCWMC
      •   Total phosphorus = 75 µg/L
      •   Chlorophyll-a = 40 µg/L
      •   Secchi = 1 m

  •   Since these are wetlands and not lakes, there are no state water
      quality standards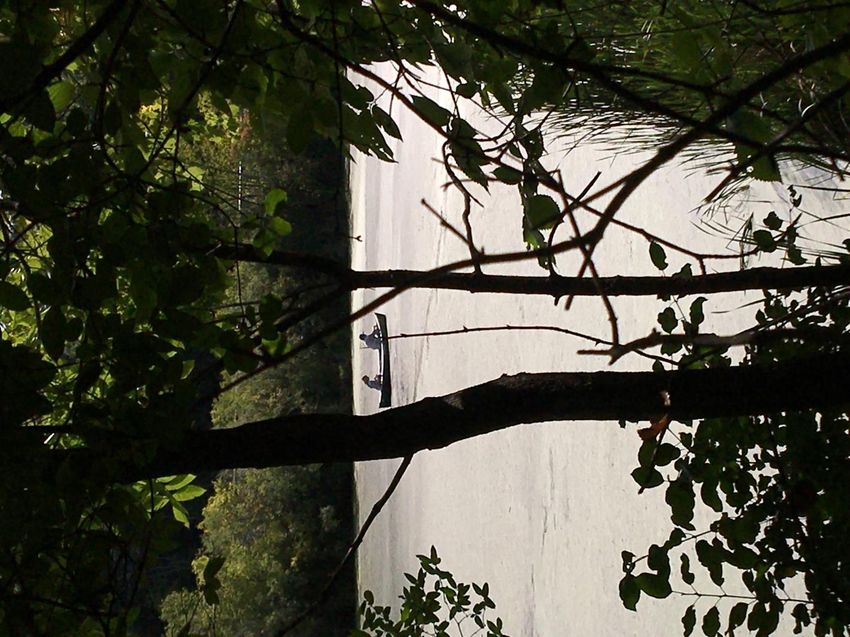
Monitoring
• 3 wetlands–water quality
• Grimes
• North Rice
• South Rice
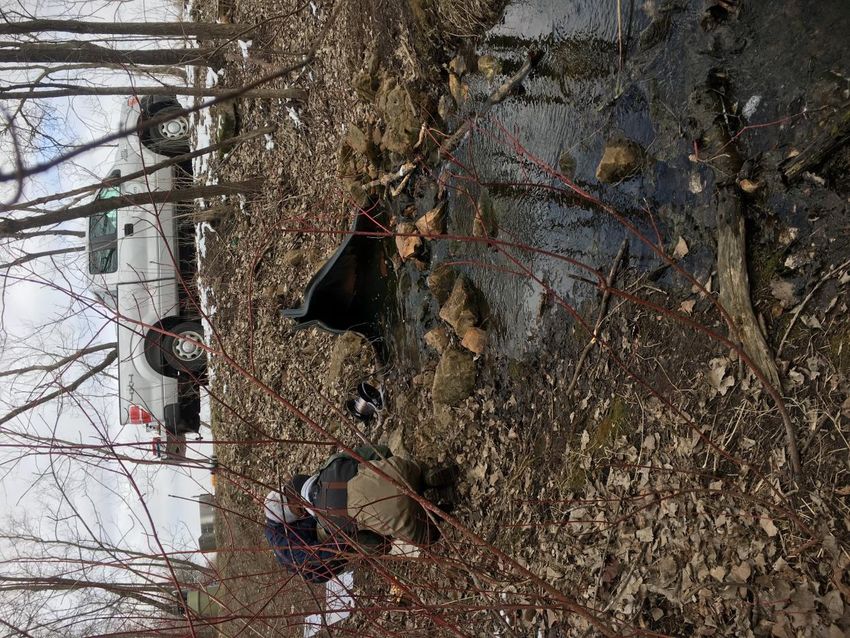
• 4 stormwater monitoring sites
• 2 sites where grab water
samples were collected
during storm events
• 5 sediment core locations
• Preliminary Data 2021
• Data presented on the
following slides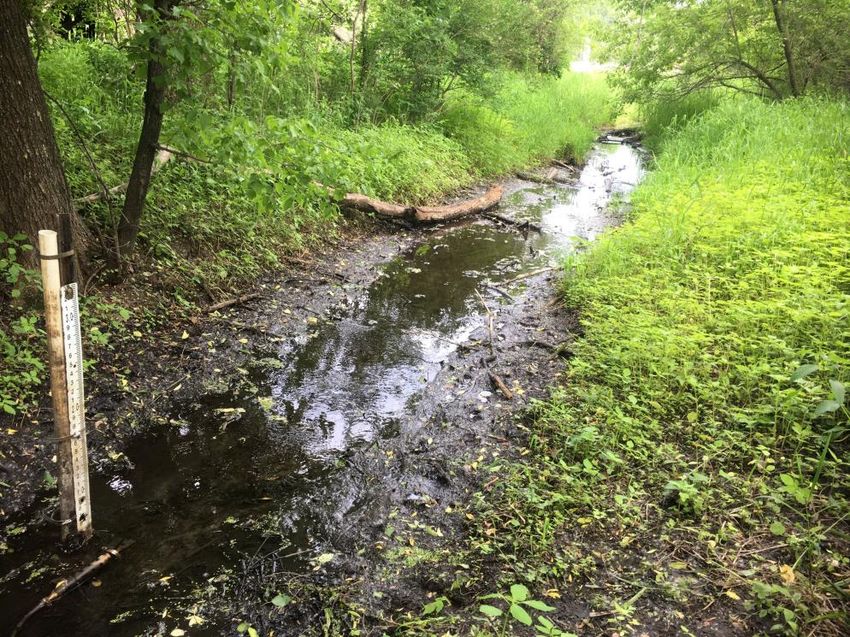
Sochacki Park
Precipitation and Flow 2020

                 •   2020 Calendar Year
                     •   Precipitation below average
                     •   2020: 26 inches
                     •   20-year average: 30 inches

                 •   Notable Rain Events
                     •   May 16-17th – 2.53 inches
                     •   August 9-10th – 3.65 inches
                     •   The rain events account for
                         11% to 15% of the
                         sampling site total flow
                         volumes.

                 •   Advantage of monitoring two
                     years allows for variations in
                     precipitation conditions.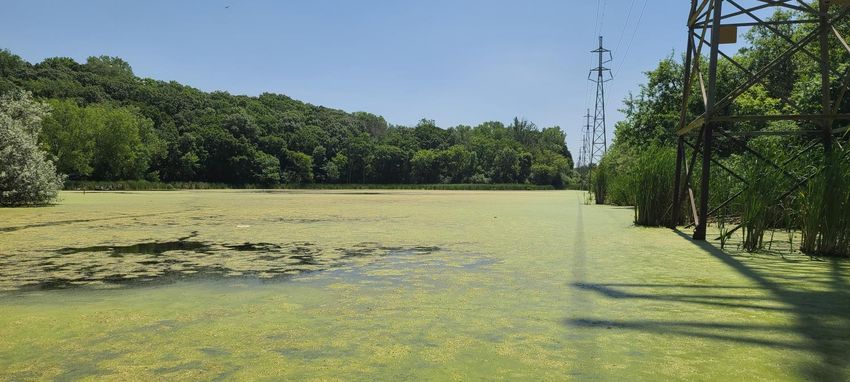
Grimes Pond

• A culvert that flows into Grimes, GR6, seems to be main
  source of stormwater
  •   Very little flow - only 2 grab samples collected
Grimes Water Quality Data by Sample Date
                       500                                                                                                              0

                       450
                                                                                                                                        1
                       400
                                                                                                                                        2
Concentration (µg/L)

                       350

                                                                                                                                            Secchi Depth (m)
                                                                                                                                        3
                       300

                       250                                                                                                              4

                       200
                                                                                                                                        5
                       150
                                                                                                                                        6
                       100
                                                                                                                                        7
                       50

                        0                                                                                                               8
                                4/21/2020          6/17/2020     7/15/2020           8/12/2020        8/26/2020         9/1/2020

                         Total Phosphorus                        Chlorophyll-a                            Secchi Disk Transparency

                         Total Phosphorus BCWMC goal (75 μg/L)   Chlorophyll a BCWMC goal (40 μg/L)       Secchi Depth BCWMC goal (1.0 m)

 •                      Not meeting TP goals most of season
 •                      Meeting Chlorophyll-a goals most of season
 •                      Meeting secchi depth goals (max depth = 2.19 m)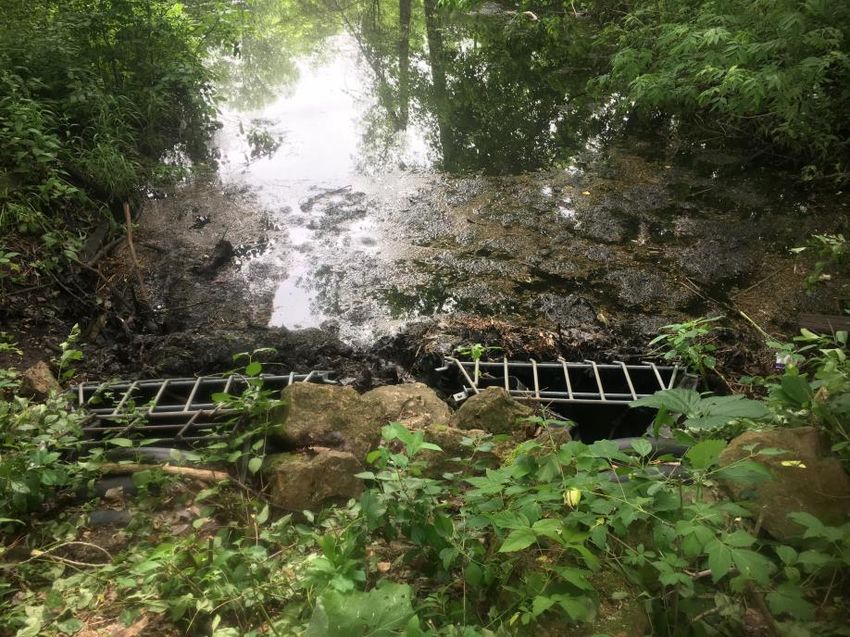
North Rice Pond
• Receives water from
  Grimes and NR1
  •   There may be other
      smaller channels –
      but NR1 is the
      primary input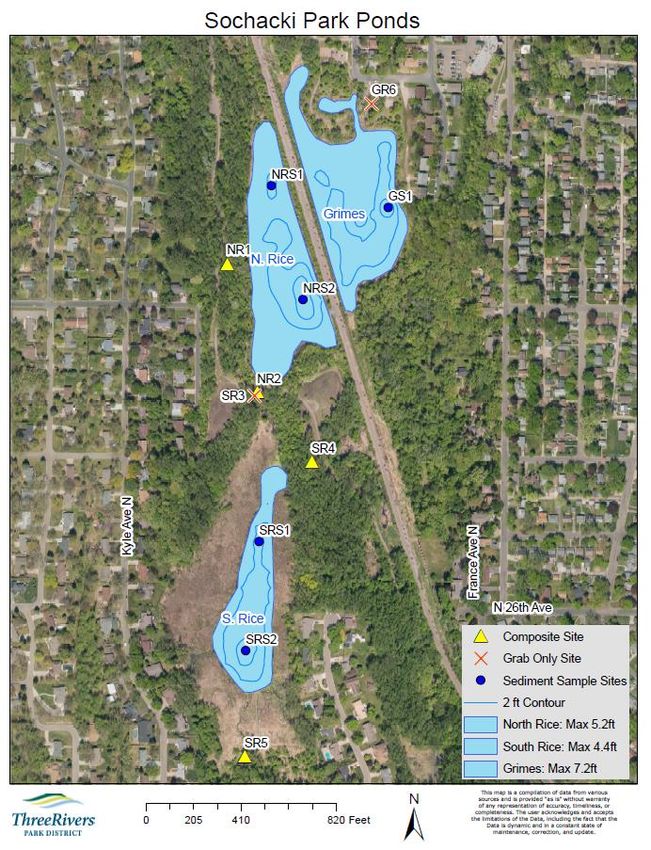
NR1 – North Rice Site 1
                          • Only has flow
                            during rain events
                            •   Sandy soils, so
                                water infiltrates

                          • Very little flow
                            into North Rice
                            pond
                            •   0.003 x 10⁶ m3

                          • Low loading due
                            to low flow even
                            though has high
                            concentrations
                            •   TP: 2 lbs/yr
                            •   TN: 12 lbs/yr
                            •   TSS: 283 lbs/yr
                            •   Chlorides: 0 lbs/yr
North Rice Water Quality Data by Sample Date
200 0
1
150 2
Concentration (µg/L)
Secchi Depth (m)
3
100 4
5
50 6
7
0 8
4/21/2020 6/17/2020 7/15/2020 8/12/2020 8/26/2020 9/1/2020
Total Phosphorus Chlorophyll-a Secchi Disk Transparency
Total Phosphorus BCWMC goal (75 μg/L) Chlorophyll a BCWMC goal (40 μg/L) Secchi Depth BCWMC goal (1.0 m)
• Meeting TP goals until August
• Meeting Chlorophyll-a goals most of season
• Not meeting secchi depth goals (max depth = 1.58 m)
• Pond is shallow and staff could see bottom of pond at every visit.South Rice Pond
Receives water from
• North Rice via NR2
• SR3 –
• a small culvert
that only runs
during storm
events
• Has very little flow
and lower
concentrations
• 4 grab samples
collected
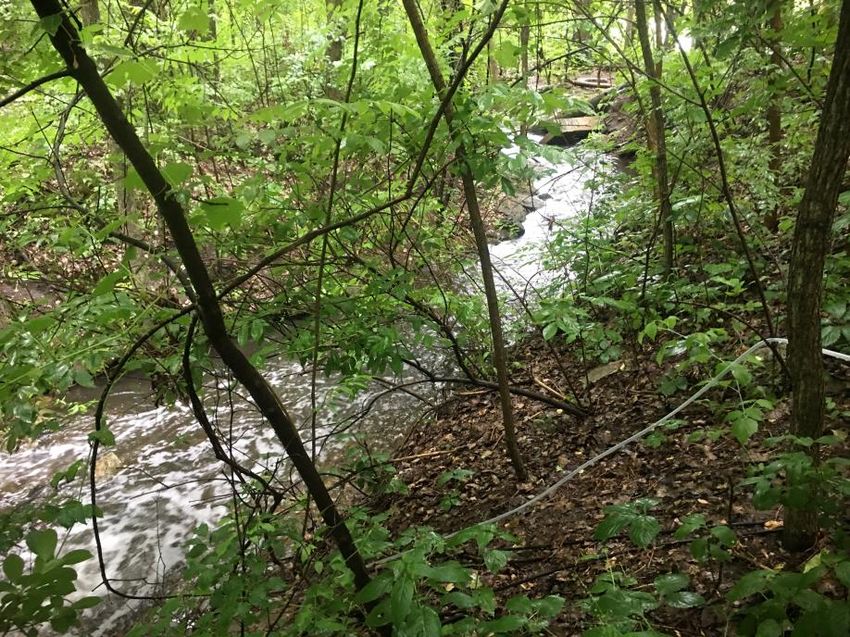
• SR4NR2 – North Rice outlet
• Flows out of North Rice and
into South Rice
• Lowest nutrient and TSS
concentrations of the sites
• Has highest chloride
concentrations
• Highest flow of sites
• 0.15 x 10⁶ m3
• Has average nutrient loading
and high chloride loading
• TP: 50 lbs/yr
• TN: 459 lbs/yr
• TSS: 1,900 lbs/yr
• Chlorides: 45,700 lbs/yrSR4 – South Rice site 4
• Flows into South Rice
• Highest average TP and
SRP concentrations of
the sites
• Low flow since only
during storm events
• 0.05 x 10⁶ m3
• Average nutrient loading
• TP: 30 lbs/yr
• TN: 213 lbs/yr
Double culvert that is dry until rain events
• TSS: 3,900 lbs/yr
• Chlorides: 577 lbs/yrSR4 – South Rice site 4 – other details Downstream of site Upstream side of culvert • Quite a bit of concrete and building • Grates collect a lot of detritus/debris materials that is high in nutrients • Channel is eroded due to heavy flow through this area
South Rice Water Quality Data by Sample Date
                           500                                                                                                                        0

                           450
                                                                                                                                                      1
                           400
                                                                                                                                                      2
    Concentration (µg/L)

                           350

                                                                                                                                                          Secchi Depth (m)
                                                                                                                                                      3
                           300

                           250                                                                                                                        4

                           200
                                                                                                                                                      5
                           150
                                                                                                                                                      6
                           100
                                                                                                                                                      7
                            50

                             0                                                                                                                        8
                                    4/21/2020              6/17/2020   7/15/2020             8/12/2020       8/26/2020           9/1/2020

                             Total Phosphorus                           Chlorophyll-a                               Secchi Disk Transparency
                             Total Phosphorus BCWMC goal (75 μg/L)      Chlorophyll a BCWMC goal (40 μg/L)          Secchi Depth BCWMC goal (1.0 m)

•             Not meeting TP goals most of season
•             Meeting Chlorophyll-a goals most of season
•             Meeting secchi depth goals for half of season (max depth = 1.34 m)
              • Pond is shallow and staff could see bottom of pond at every visit
• Flows out of South Rice
SR5 – South Rice outlet • There is a 2nd outlet channel
with similar flows
• Average concentrations
• Measured flow is
comparable to flow into
South Rice
• 0.13 x 10⁶ m3
• Has highest loading of the
sites except for chlorides
• TP: 74 lbs/yr
• TN: 526 lbs/yr
• TSS: 9,300 lbs/yr
• Chlorides: 28,700 lbs/yrOther monitoring
• Dissolved oxygen
• April and June had higher levels, but rest of season was anoxic at all
ponds
• Due to low oxygen levels, bacteria do not efficiently break down
decaying material
• Vegetation
• Thick Coontail
• Lots of duckweeds
• 2013 study noted that Curly-leaf pondweed (CLP) was only found in
South Rice
• CLP was found in all 3 ponds in the spring but not in fall due to normal die
off
• Sediment Cores
• Collected in January 2021
• Awaiting results to see influence of sediment phosphorus on water
qualitySochacki Park
Sub-watershed Assessment
Next Steps
• Stakeholder Engagement – Ongoing 2021/2022
• Continue Monitoring Efforts - Summer 2021
• Process and Summarize Monitoring Data – Fall/Winter 2021
• MnRAM Wetland Function & Value Analysis – Fall/Winter 2021
• Modeling of Watershed – January/February 2022
• Modeling of Wetlands – March/April 2022
• Modeling Simulations to evaluate potential watershed BMPs and
wetland management options – May 2022
• Sochacki Park Sub-watershed Assessment Report – June 2022
▪ Phosphorus Load reductions necessary to achieve water quality goals
▪ Cost-benefit analysis
▪ Implementation PlanYou can also read