Sea Level Rise Inundation Modeling Using Stormwater Infrastructure In Norfolk Virginia
←
→
Page content transcription
If your browser does not render page correctly, please read the page content below
Sea Level Rise Inundation Modeling Using
             Stormwater Infrastructure
                       In Norfolk Virginia

                               Julie Cacace
                          Dr. Pat Halpin, Advisor

                                 April 2022

MASTER’S PROJECT SUBMITTED IN PARTIAL FULFILLMENT OF THE REQUIREMENTS FOR THE
 MASTER OF ENVIRONMENTAL MANAGEMENT DEGREE IN THE NICHOLAS SCHOOL OF THE
                   ENVIRONMENT, DUKE UNIVERSITY, APRIL 2022.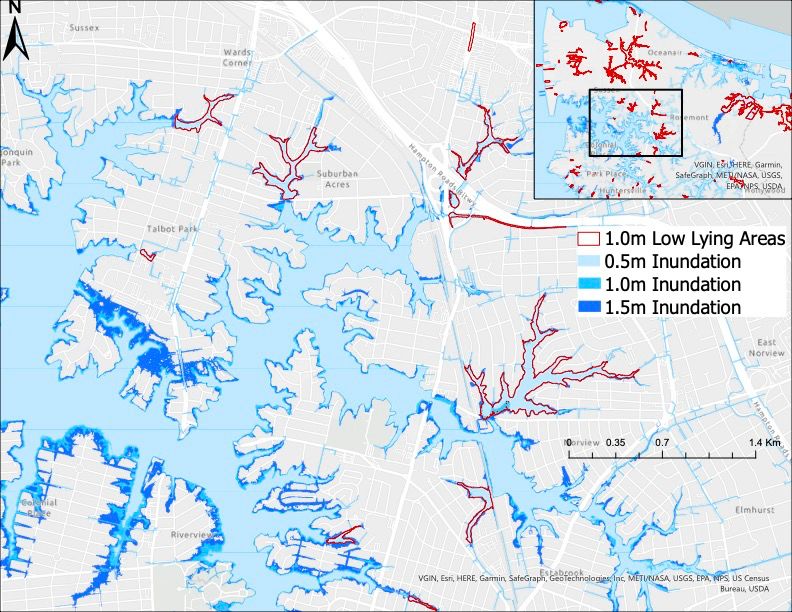
Executive Summary
       Climate change is impacting coastal communities worldwide as global sea levels rise.
Portions of the east coast of the United States, including the city of Norfolk, Virginia, experience
rising seas at almost three times the global rate. Norfolk specifically has the highest rate of sea-
level rise among east coast cities in the United States. Climate variability and land subsidence
related to Glacial Isostatic Adjustment (GIA) cause the high relative sea-level rise rates in this
region (Bekaert et al., 2017). Sea level rise exacerbates nuisance flooding, also referred to as
sunny-day high tide flooding, the cumulative effects of which can make more of an impact over
time than the less likely extreme event. Near-term sea-level rise is already impacting day-to-day
operations in coastal cities, specifically at high tide and with the increase in the frequency of
nuisance flooding events. These impacts will continue to grow as sea levels rise.
       The methods for this study in part follow the National Oceanic and Atmospheric
Administration (NOAA) Detailed Method for Mapping Sea Level Rise Inundation for the
creation of sea-level rise inundation grids. The NOAA method uses elevation data, sea-level rise
values, tidal variation of the mean higher high-water mark, and the evaluation of hydrological
connectivity to map inundation. This study uses geospatial analysis to show that adapting the
digital elevation model (DEM) with stormwater infrastructure improves the accuracy of
inundation modeling at low levels of sea-level rise. The stormwater infrastructure used in this
analysis includes stormwater ditches, culverts, and pipes. Inundation grids are created for three
sea-level rise scenarios: 0.5-meters, 1.0-meters, and 1.5-meters. The results of each scenario
were overlayed with NOAA’s designated low-lying areas to detect whether the stormwater
infrastructure impacted the inundation of those areas.
       The results suggest that including stormwater infrastructure in sea level rise inundation
modeling has the potential to change the connectivity of inundated areas, even at low levels of
sea-level rise. Many low-lying areas were impacted by inundation, at the 0.5-meter and 1.0-
meter sea-level rise scenarios. This has near-term applicability as Norfolk may see 0.5-meters of
sea-level rise by 2050. Impacts to the infrastructure itself include the inundation of structures like
inlets and outfalls, which could make the city’s stormwater system ineffective daily at high tide
under these sea-level rise scenarios. Cities like Norfolk can use the results of this study to aid in
resiliency planning, prioritizing stormwater infrastructure updates, and modeling future storms
with the new inundation grid in mind. This work can be replicated in other coastal cities and will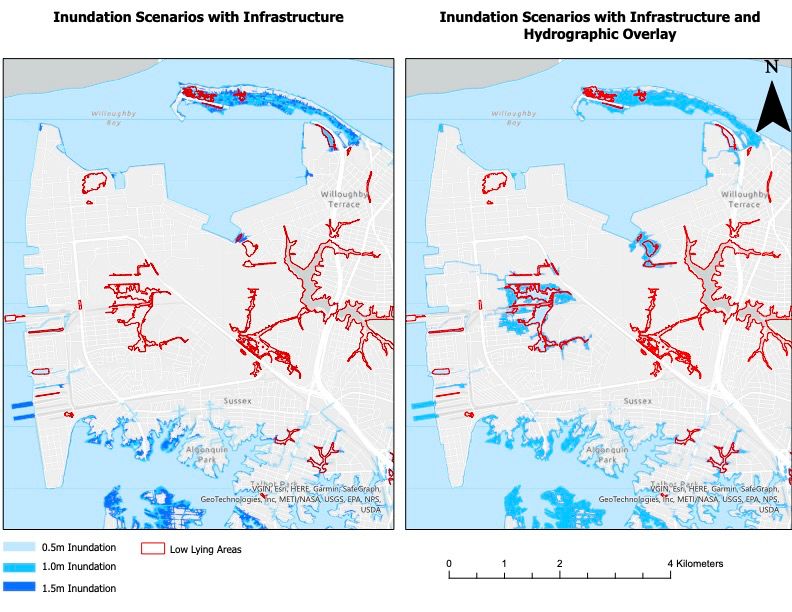
also be useful for resiliency planning on military installations such as the Naval Station Norfolk.
Building off current results by including precise elevations and slopes of the pipes will allow for
modeling more accurate inundation amounts for each sea-level rise scenario. Fine-scaled
inundation modeling is crucial for planning for sea-level rise-related impacts.
Acknowledgments
I would first like to thank my advisor, Dr. Pat Halpin, for all of his guidance throughout this
process, and for helping this idea turn into a well-rounded project. I’d also like to thank Jesse
Cleary for his advice and assistance with the geospatial portion of this project. Thank you to my
peers, my fellow CEMs, for always listening and offering advice and words of encouragement.
And thank you to my family for supporting me in everything that I set out to accomplish.
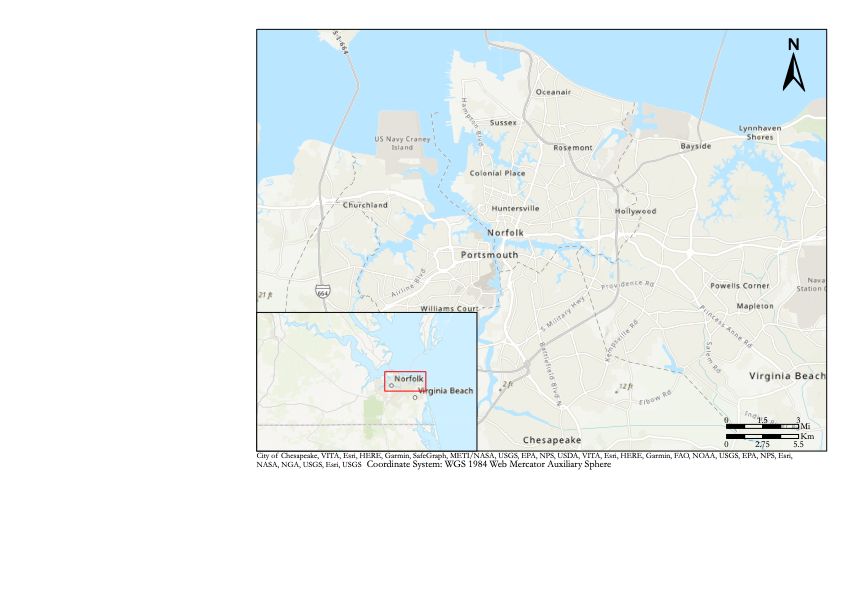
Table of Contents
Background ............................................................................................................................ 1
Introduction ........................................................................................................................... 3
Study Site ............................................................................................................................... 3
Methods ................................................................................................................................. 4
   Literature Review ............................................................................................................................ 4
   Data................................................................................................................................................. 5
   Analysis ........................................................................................................................................... 6
Results.................................................................................................................................... 9
   Inundation and Low-lying Areas ..................................................................................................... 9
   Stormwater Infrastructure Vulnerability Assessment ..................................................................... 14
Discussion............................................................................................................................. 15
   Planning for Resiliency in Norfolk ................................................................................................ 15
   Department of Defense Resiliency.................................................................................................. 17
   Data Constraints ............................................................................................................................ 18
   Future Work .................................................................................................................................. 18
Conclusion ............................................................................................................................ 20
References ............................................................................................................................ 22
Appendix .............................................................................................................................. 25
Background
       The impacts of climate change are seen worldwide and are becoming more severe. One

of the main effects of climate change is rising sea levels due to melting glaciers and ice sheets,

land subsidence, and thermal expansion. Global mean sea level (GMSL) is both rising and

accelerating, but not uniformly across the globe; some areas are more affected than others.

According to the Intergovernmental Panel on Climate Change (IPCC), GMSL will rise between

0.29 meters and 1.1 meters by the end of this century (IPCC, 2019). Recorded average global

sea-level rise rates reported by the IPCC include a 1.9 mm/year rate from 1971 to 2006,

increasing to 3.7 mm/year between 2006 and 2018 (IPCC, 2022). Records show the most notable

increases in sea level rise rates since 1990.

          Portions of the east coast of the United States see rising seas at almost three times the

global rate (Union of Concerned Scientists, 2016). A combination of physical land processes

such as land subsidence and a low elevation above sea level has led to different rates of sea-level

rise. Subsidence is a local phenomenon exacerbated by depleting groundwater sources faster than

they are replenished. Further, Glacial Isostatic Adjustment (GIA), the rebound of the Earth after

the melting of glaciers, is still impacting vertical land movement across the east coast of the U.S,

which used to be covered in ice (Sweet et al., 2022). Sea level rise exacerbates nuisance

flooding, also known as sunny-day or high-tide flooding (NOAA, 2019). Nuisance flooding is

often categorized as minor flooding, but the cumulative effects can make more of an impact over

time than the less likely extreme event (Li, 2021). According to the 2022 Sea Level Rise

Technical Report, written in partnership between NOAA, the US EPA, NASA, USACE, USGS,

FEMA, and others, within the last 20 years, minor high tide flooding has more than doubled. It

may do so again as soon as 2030 (Sweet et al., 2022). This type of coastal flooding disrupts daily

                                                                                                      1
life by making roads impassable, disrupting other transportation systems, and can impact
emergency routes. Along with many others across the globe, these areas will only continue to
suffer the consequences of sea-level rise over time. Nuisance flooding events will become more
frequent and severe as sea levels continue to rise. As city managers look to try and respond to
these events and plan for the future, they must have accurate sea level rise inundation maps to
make informed decisions.
Models looking at sea level rise above the mean higher high-water mark (MHHW), tidal
variability, and the influence of land subsidence on sea-level rise inundation helped provide
background for this study (Shirzael, 2018). Studies show that sea-level rise will adversely affect
transportation infrastructure. The National Oceanic and Atmospheric Administration Office of
Coastal Management's (NOAA-OCM) Sea Level Rise Viewer shows the inundation model's
results. The NOAA sea level rise inundation method uses a modified bathtub approach that
includes tidal variability and hydrologic connectivity. The bathtub approach looks at sea level
rise like water filling up a bathtub; the areas with lower elevation will flood first, while the
higher elevations follow behind. So, the NOAA method is mainly a function of elevation and the
amount of sea-level rise, and then an analysis of connectivity to produce an inundation surface
that is connected to the ocean. However, this model and others do not include engineered
infrastructure, such as stormwater culverts and ditches, which may impact the connectivity of the
inundated surface. These structures are often hidden beneath roads, i.e., culverts, and are not
resolved as barriers to flow paths by the digital elevation model (DEM).
A culvert is typically an open-ended pipe or channel that allows water to move past an obstacle,
typically under roads. Another essential stormwater structure is the open end of a stormwater
pipe, typically designated as an outfall. Stormwater discharges into bodies of water like creeks,
2canals, or the ocean through these structures. Stormwater infrastructure exists to move water
away from populated areas and off roads. However, it could also be a pathway for rising seas to
inundate the very areas where the infrastructure is supposed to keep dry. Including stormwater
infrastructure in the NOAA sea level rise model may result in a different inundation output,
specifically at a fine scale. Sea level rise, along with the occurrence of nuisance flooding, is no
longer an issue for the future; it is occurring now, and thus, modeling inundation needs to be at
as fine a scale as possible.
Introduction
This study aims to understand the effect of stormwater infrastructure on the connectivity
of inundated areas under low levels of sea-level rise. Comparing the results of each scenario to
the NOAA OCM Sea Level Rise Viewer’s inundation results will indicate the effects of
stormwater infrastructure on inundation. A second priority within this study is to highlight
vulnerable stormwater infrastructure that may be inundated because of sea-level rise. Assessing
inundated stormwater infrastructure will aid in prioritizing potential infrastructure updates for the
city. A third goal is to highlight other vital areas that may not directly be inundated under each
scenario but are very close to being at risk. The findings of this pilot study should be helpful for
future analyses in other regions.
Study Site
The city of Norfolk, Virginia is the site for this study, due to the high rate of sea-level rise
and nuisance flooding occurring. The Virginia Institute of Marine Science (VIMS) reports that
Norfolk saw a 5.4 mm increase in sea level in 2021, about a 0.5mm/year increase from 10 years
prior (Malmquist, 2021). This is the highest rate of sea-level rise among east coast cities in the
United States. Climate variability and above-average subsidence rates related to GIA cause the
3high relative sea-level rise rates in this region (Bekaert et al., 2017). Nuisance flooding in
Norfolk, Virginia has increased 325% since 1960 and ranks in the top 10 U.S cities that have
seen increases in coastal flooding events (Burgos, 2018). Surrounded on three sides by water,
including the Chesapeake Bay,
Elizabeth River, and the Atlantic
Ocean, Norfolk is one of the more
vulnerable cities on the east coast
when it comes to sea-level rise.
The city is home to about 250,000
residents along with the world’s
largest naval base, Naval Station
Norfolk (Burgos, 2018). Bekaert et
al., 2017 found exceptionally high Figure 1: City of Norfolk, Virginia.
rates of subsidence occurring at the
Naval Station from 2007 to 2011, with more research needed on why. Detailed flood modeling is
crucial to planning for the resilience of the nation’s military bases as well as the cities that they
inhabit.
Methods
Literature Review
A literature review revealed the breadth and depth of current inundation modeling. Loftis
et al., 2018, conducted an analysis of a sub-grid modeling approach that removed overpasses
from the DEM to more effectively model Hurricane Sandy storm surge in New York City
(Loftis, 2018). Another publication discussed creating a detailed high-resolution inundation
model for modeling storm surge and precipitation-related flooding events at Langley Research
4Center in Hampton, Virginia (Loftis, 2015). This model included the predicted tide and storm
tide, along with wind and pressure atmospheric forcings, and infiltration through the soil as a
fluid sink. They then used tide gauge data to compare to their simulation. Wang et al., 2015 used
a LiDAR-derived DEM and resolved flow issues where bridges crossed the Potomac River
(Wang et al., 2015). This source, although it is simulating storm tides, had helpful methods for
resolving features like bridges. Loftis et al., 2018 reviewed current data sources for flood
resilience planning, as well as gaps in the data (Loftis, 2018). This was a great resource for
identifying potential data sources. Overall, the results of the literature review emphasized
modeling storm surge and large flood events, without much emphasis on the modeling of day-to-
day high-tide flooding because of sea-level rise alone.
Data
Data availability was a determining factor for the selection of the study site, as
stormwater infrastructure data is openly available on the City of Norfolk’s Open GIS website
(City of Norfolk GIS, 2021). The Open GIS platform provides stormwater ditch, stormwater
pipe, and stormwater structure shapefiles. The stormwater structures file is a point shapefile that
contains locations of manholes, outfalls, ditch entrances and exits, pipe entrances and exits, and
catch basins, among other features (City of Norfolk GIS, 2021). The Virginia Department of
Transportation (VDOT) website also provides a culvert and bridge shapefile (VDOT, 2020). The
culvert data is used in this analysis, as bridges were resolved in the DEM. This study also uses
data from NOAA’s Sea Level Rise Viewer, including the low-lying area shapefiles for different
sea-level rise scenarios, and the DEM for Virginia (NOAA OCM). The DEM is a combination of
multiple lidar datasets from sources including the United States Geologic Survey (USGS) and
The Federal Emergency Management Agency (FEMA). The DEM was obtained from the NOAA
OCM website and has a resolution of approximately 3 meters. The vertical datum is the North
5American Vertical Datum of 1988 (NAVD88), and the horizontal datum is the North American
Datum of 1983 (NAD83). Another piece of data used was a combination of features from the
National Hydrography Dataset (NHD) and the National Wetland Inventory (NWI). The result of
this combination is a hydrographic overlay that essentially shows hydrological connectivity for
Virginia (USGS).
Analysis
This study follows NOAA’s Detailed Method for Mapping Sea Level Rise Inundation for
the creation of sea-level rise inundation grids (NOAA OCM, 2017). The method uses elevation
data, sea-level rise values, tidal variation of MHHW, and the evaluation of hydrological
connectivity to map inundation. This includes the creation of a tidal surface using the VDatum
approach with NOAA’s vertical datum conversion software to get the tidal surface elevation
values in the North American Vertical Datum of 1988 (NAVD88). Creating a grid of points
using a Virginia address points shapefile from VGIN clipped to Norfolk County, and then adding
and calculating fields for latitude, longitude, and elevation fields, with elevation set to 0 meters
completed the preprocessing required before using NOAA’s vertical datum conversion software.
The output was an excel sheet that had corrected elevation values for each point, elevation above
the MHHW. The data was converted back into a grid of points in ArcGIS Pro, and various
interpolation methods were used to find the smoothest surface to use as the tidal surface. Sea
level rise values were then added to the chosen tidal surface to create a sea-level rise grid for
each scenario. The stormwater infrastructure was incorporated into the existing DEM by first
adding an elevation component to each infrastructure shapefile. Elevation was calculated as 0
meters for each infrastructure component, as most of these features are at the ground surface or
beneath roads. The stormwater ditch data did not require any preprocessing, but the culverts and
stormwater pipes data required data conversions. The culvert data needed to be converted from
6point to polygon format. For this study, not all the stormwater pipes were necessary, as not all
sections of pipes would impact surface water flow. For this reason, the stormwater structures
point data was used to select only certain portions of the stormwater pipes. Specifically, outfalls
and pipe entrances and exits to ditches structure points were used to select stormwater pipes
within 30 meters of the original inundation grid.
Exploratory flow analysis using the infrastructure data exhibited disconnected features
and flow paths. The pipes data was buffered by 1 meter to ensure that all the infrastructure data
was properly connected in the adapted DEM. Once the preprocessing analysis was complete, the
stormwater pipes, ditches, and culverts data were converted into a raster format. In raster format,
the infrastructure components were assigned a pixel value of 0 meters, and the No Data values
were reassigned a value of 1 meter. This was to allow for multiplication of the infrastructure
rasters by the existing DEM, therefore only changing the elevation values where the stormwater
infrastructure exists. The cell size had to be set at 0.8-meters for the raster component, again so
that the infrastructure was fully and accurately represented.
Similar preprocessing steps were taken to include the hydrographic overlay data into a
second version of the DEM. For this study, the hydrographic overlay was included in the DEM
that also had the stormwater infrastructure data, to show a more complete connected surface with
both natural and manmade systems for water transport. The hydrographic overlay data was first
edited so that two specific locations would not be represented as hydrologically connected to the
rest, due to a flood gate and similar structure protecting those two features. Then an elevation
value was calculated for the data, and it was converted into a raster, and combined with the
infrastructure DEM. The result was two separate DEMs, one with infrastructure included, and
the other with both infrastructure and the hydrographic data included. This will allow for further
7comparison of the effects of these man-made and natural structures on the connectivity of
inundated areas under each sea-level rise scenario.
The creation of the inundation grid for each sea-level rise scenario followed NOAA’s
Detailed Method for Mapping Sea Level Rise Inundation. This approach maps sea level rise
above the MHHW mark and evaluates the hydrologic connectivity of the inundated area (NOAA
OCM, 2017). One of the results produced by the NOAA OCM method is the designated low-
lying areas dataset. These low-lying areas have elevations below sea level under a specific sea-
level rise scenario but have been deemed not hydrologically connected to the rest of the
inundated area. Overlaying the low-lying areas data with the inundation results helps to show
where infrastructure caused the inundation of these areas.
Multiple sea level rise scenarios were assessed using the NOAA method and the
infrastructure adapted DEM. Scenarios were conducted at 0.5 meters, 1.0 meters, and 1.5 meters
of sea-level rise in Norfolk, Virginia. The first scenario, 0.5 meters, is the amount of sea-level
rise projected by the VIMS report for Norfolk by 2050. The other scenarios were conducted to
investigate how the impact of stormwater infrastructure on inundation changes as sea levels
increase. The same three scenarios were run using the DEM adapted to include both the
stormwater infrastructure and the hydrographic overlay data as well.
In addition to mapping inundation under multiple sea-level rise scenarios, a vulnerability
assessment of the stormwater infrastructure itself was conducted. The stormwater structures data
was used along with the final inundation grids to see how much of the infrastructure overlapped
with each scenario’s inundation grid. These counts were divided into percentages for each type
of stormwater structure.
8Results
Inundation and Low-lying Areas
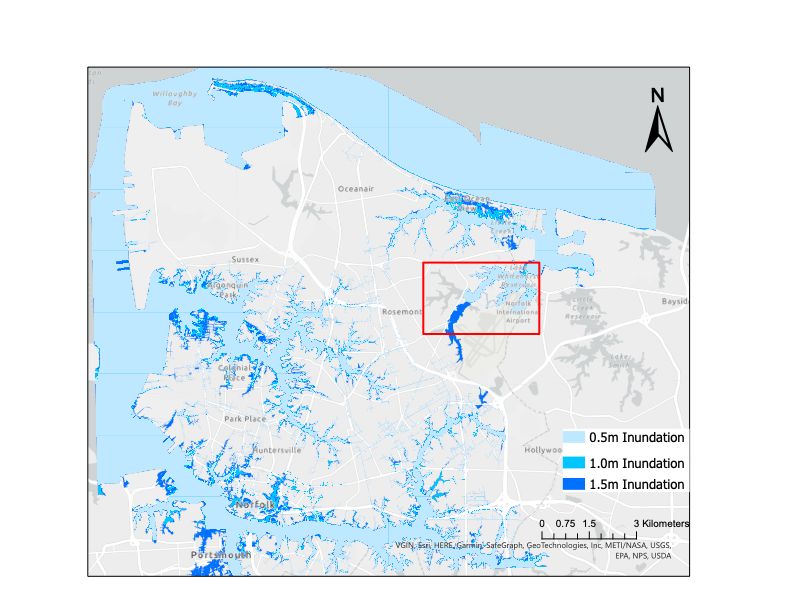
The results
of each scenario are
shown in Figure 2.
The inundation for
each scenario is
represented by a
solid color rather
than a range of
values, as the
significance of the
result is more about
the potential for
inundation and Figure 2: Inundation scenario results for Norfolk. Result of scenarios incorporating
stormwater infrastructure into the model. Red box indicates location of Lake Whitehurst
overall hydrological Reservoir, where connectivity may be stopped by manmade infrastructure.
connectivity rather than exact inundation amounts. The results of each sea-level rise scenario
were overlayed with NOAA’s designated low-lying areas to detect whether the stormwater
infrastructure impacted the inundation of those areas. Table 1 shows the percentage of low-lying
areas that are impacted by inundation under each scenario. For the 0.5m scenario, 31% of the
low-lying areas showed some level of inundation due to the inclusion of stormwater
infrastructure in the model.
9Table 1: This table shows the percent of low-lying areas impacted by inundation at each sea-level rise scenario,
with infrastructure incorporated in the model.
Low-Lying Areas Percent Low-Lying Areas Impacted
0.5-meter Low-Lying Areas 31%
1.0-meter Low-Lying Areas 54%
1.5-meter Low-Lying Areas 6%
A greater impact is found at 1.0 meters of sea-level rise, with 54% of the low-lying areas
impacted. Notable low-lying areas that did not flood include the Lake Whitehurst Reservoir and
the Oastes Creek. Lake Whitehurst Reservoir is used as a source of drinking water for Norfolk
and the surrounding areas. It is separated from the tidally inundated area by a road that has
Figure 3: Zoom in of inundation results for each scenario, incorporating stormwater infrastructure. Low
lying areas shown outlined in red.
10drainage underneath it, most likely only allowing excess freshwater to drain, but not allowing
seawater to enter the
reservoir. Oastes Creek is
hydrologically connected
to the inundated area, and
to the ocean itself, but
there is a flood gate
already in place,
essentially disconnecting
this Creek from the rest
of the inundation grid.
The 1.5-meter sea level
rise result was different
from the 0.5- and 1.0-
meter results. When
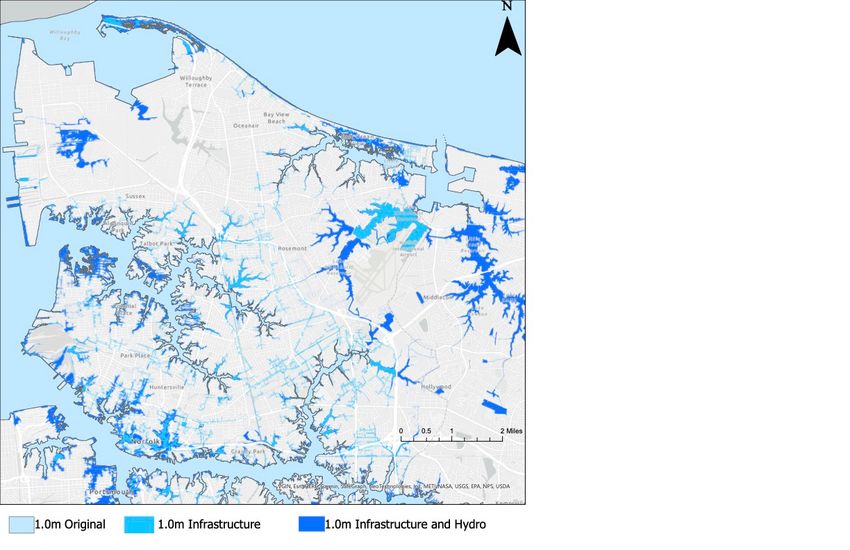
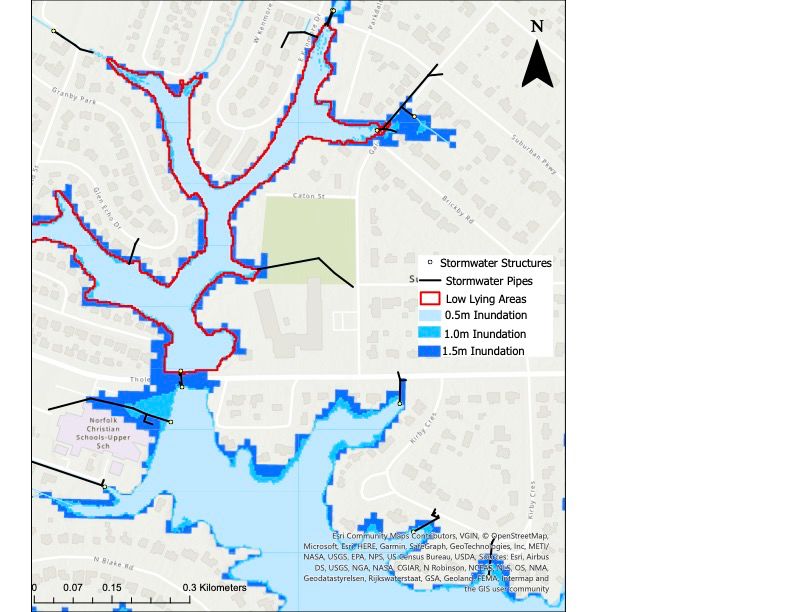
looking at the inundation Figure 4: Example of how stormwater infrastructure impacts connectivity. This map
shows inundation extent with stormwater pipes and low-lying areas included.
grid and the corresponding
low-lying areas for that sea-level rise amount, not many of the low-lying areas showed any
inundation. This may suggest that the threshold for stormwater infrastructure’s impact on the
connectivity of inundation is between 1.0 and 1.5 meters of sea-level rise. Figure 3 shows a
zoom-in of the inundation results after incorporating stormwater infrastructure into the model.
Along with the three sea-level rise scenario results, the 1.0-meter low-lying areas are also shown.
The figure shows all of the low-lying areas have the potential to be inundated, even at 0.5-meters
11Figure 5: Comparison of infrastructure only scenario results(left) and infrastructure and hydro scenario results (right). Right
map shows further inundation in additional low-lying areas.
of sea-level rise. Figure 4 shows the stormwater pipes and structures that hydrologically connect
the inundation grid to the low-lying areas, essentially flooding them. On one end of the
stormwater pipe connecting the original inundation grid to the low-lying area is an outfall, and
on the other is the pipe entrance to a regulatory ditch. These two structures essentially make this
length of pipe an open-ended culvert, which would allow water to pass through, under the road,
and hydrologically connect the low-lying area. The results for the scenarios with the
hydrographic overlay included show a few more of the low-lying areas having the potential to
flood that the infrastructure only
12Figure 6: Comparison of original inundation results at 1.0-meters of sea level rise should no changes be
made to NOAA model, stormwater infrastructure results, and infrastructure and hydro scenario results.
results did not. These differences are primarily in the Northwest portion of Norfolk, near the
Naval Base. Another difference is that more area has the potential to be inundated under 1.0
meters of sea-level rise when the hydrographic overlay is included. Figure 5 shows the two sets
of results side by side. Figure 6 shows three different results at 1.0 meters of sea-level rise. The
lightest colored blue represents the results of the original method, with no changes, while the
medium-colored blue shows the results of the method after incorporating stormwater
infrastructure, and the darkest blue shows the inundation results after incorporating both the
13infrastructure and the hydrographic data. This figure exemplifies how each added layer of detail
further expands the potentially inundated surface.
Stormwater Infrastructure Vulnerability Assessment
Stormwater structures, namely outfalls, manholes, ditch entrances and exits, and pipe
entrances and exits, are heavily impacted by inundation under low levels of sea-level rise. In
total, 49% of these structures face some level of potential inundation under 0.5 meters of sea-
level rise. Under 1.0 meters of sea-level rise, the total percentage increases to 56% and rises to
60% at 1.5 meters of sea-level rise. Not surprisingly, outfalls are the most impacted structure of
the structures studied. The number of outfalls impacted ranges from 81% to 88% under 0.5
meters and 1.5 meters of sea-level rise, respectively. Similarly, ditch entrances and exits are
between 53% and 60% impacted by sea-level rise (Table 2).
Table 2: Results of stormwater structure vulnerability analysis, showing the total number and percentages of
structures impacted by inundation under each sea-level rise scenario.
Structure Type # Impacted % of Total Impacted
0.5m SLR 1.0m SLR 1.5m SLR 0.5m SLR 1.0m SLR 1.5m SLR
Outfall 801 845 877 81% 85% 88%
Manhole 2451 3036 3347 48% 59% 65%
Pipe Entrance 1218 1483 1582 44% 49% 53%
Pipe Exit 1131 1322 1417 40% 47% 50%
Ditch 1106 1166 1240 53% 56% 60%
Entrance/Exit
Total 6807 7852 8463 49% 56% 60%
14Discussion
The results of this study suggest that including stormwater infrastructure in sea level rise
inundation modeling has the potential to change the connectivity of inundated area, even at low
levels of sea-level rise. Impacts to the infrastructure itself include the inundation of structures
like grated manholes and inlets which could then not perform the drainage activities that they are
responsible for. Outfalls will likely be inundated regularly at high tide so that if there is a
precipitation event, water will likely become backed up in the stormwater system. In other
words, the capacity of the stormwater system will be reduced, and the efficiency compromised
during storms. This may lead to streets flooding more often and remaining flooded for a longer
period while pumps work to push water out of the city. This could impact transportation
infrastructure and emergency routes. The impact of this infrastructure appears to be at low levels
of sea-level rise, specifically below 1.5 meters. These impacts will be seen in the near term,
potentially within the next 30 years in Norfolk and other cities experiencing high rates of sea-
level rise. The stormwater infrastructure vulnerability assessment suggests that the impact could
be significant if mitigation measures are not undertaken. The results do not necessarily mean that
all of the infrastructure will be incapacitated, but there is some level of risk involved. For
example, an inundated outfall has a higher risk than a manhole, as outfalls are where water
discharges, and if that can’t occur, the rest of the system cannot work properly. Further, if there
is a storm event on top of the daily inundation, the stormwater system may become overwhelmed
more easily, leading to streets becoming flooded.
Planning for Resiliency in Norfolk
Norfolk, among other cities worldwide that are experiencing increasing impacts from
climate change, is working to increase resilience. Norfolk has been a member of The 100
Resilient Cities (100RC) Network since 2013, which aims to provide resources and guidance to
15cities facing threats due to climate change (ResilientVirginia, 2015). The State of Virginia has a
resiliency strategy that in the first few years has begun publishing resiliency-related information
on a website and in a newsletter, held two Resilient Virginia Conferences, and created a
Comprehensive Resiliency Checklist which guides local governments towards achieving
resiliency (ResilientVirginia, 2022). The city of Norfolk has outlined its own coastal resiliency
strategy, using the terminology plan, prepare, mitigate, and communicate as the foundation for
its strategy. To reduce impacts from flooding, community members are encouraged to help by
planting trees and installing rain gardens, as well as restoring shorelines and wetlands (City of
Norfolk, 2015). There are plans for flood walls, flood gates, and increasing the number of pump
stations to improve stormwater capacity and therefore better protect the city during larger storm
events such as hurricanes and nor’easters (City of Norfolk, 2015). The report mentions the
construction of berms, and drainage improvements, along with structure elevations throughout
the city (City of Norfolk, 2015). This work could help to reduce the impacts of increased
nuisance flooding due to sea-level rise. The green infrastructure plan published in 2018
complements the coastal resiliency strategy, outlining more specific green infrastructure projects
to help with both the stormwater retention issues as well as overall coastal resilience (City of
Norfolk, 2018). One of the primary land goals states, “Install and maintain constructed green
infrastructure to detain and retain stormwater and beautify areas where natural green
infrastructure practices are less suitable” (City of Norfolk, 2018). This exemplifies the city’s
willingness to live with and work around rising seas by employing nature-based solutions in
combination with other infrastructure updates. The green infrastructure plan also mentions how
projects like those outlined in the plan will help to reduce the premiums on flood insurance
through the National Flood Insurance Program (NFIP), and that a 15% discount is already
16available for NFIP participants in Norfolk each year (City of Norfolk, 2018). The city can
receive points towards this discount through projects that will reduce flood damage and help with
overall floodplain management. Although part of the city’s plan for the future involves living
with the water, the option for buyouts does exist and some residents have chosen that route as a
result of recurrent flooding around their properties. In the Riverview neighborhood along the
Lafayette River, some homes were bought by the City of Norfolk in partnership with FEMA;
those homes were taken down and the land returned to marshland (Murphy, 2019). More of these
projects are expected as a part of the coastal resilience plan and the green infrastructure plan.
Department of Defense Resiliency
The Department of Defense (DOD) has outlined plans for improving the resilience of
military installations across the country. One such program, the Readiness and Environmental
Protection Integration Program (REPI) aims to increase resilience and diminish the hazards
posed to bases and installations by climate change (DOD, 2022). Like the projects and programs
created by cities, REPI projects address climate change-related concerns by protecting critical
infrastructure, personnel, and areas critical for everyday operations (DOD, 2022). For Naval
Station Norfolk, and many other naval bases worldwide, rising tides will affect repairs happening
at the dry docks, training, readiness, and access around the base itself. The Hampton Roads area,
of which Norfolk is a part, has representation from every branch of the military, employs
thousands of active-duty and reserve personnel as well as civilians, and provides a large
economic value (DOD, 2021). Although the REPI program outlines some ongoing projects
throughout the Hampton Roads area, there are not currently any proposed for Naval Station
Norfolk, which could have negative implications for daily operations.
17Data Constraints
Although the data available for the study site was robust, there were some data gaps that
likely affected the outcome of the inundation grids. Specifically, there isn’t any publicly
available stormwater infrastructure data for the Naval Station Norfolk, which likely means
inundation throughout the base was not accurately modeled. The area itself is flat, right next to
the water, with a lot of area covered in concrete and other impermeable materials. This makes
stormwater infrastructure even more important for the movement of water, as it won’t be able to
permeate the ground. If the stormwater systems are not able to operate properly due to rising seas
and roads become impassable, the base may not be able to operate properly.
The stormwater pipe data posed many questions as well, as the depth below the surface
wasn’t known for the pipes, and the elevation at which the pipes met the surface was assumed.
Components like the slope and diameter of the pipes could also impact the movement of water
from the inundated surface to other areas. Because of these unknowns, it is difficult to pinpoint
exactly how much of the pipes would be flooded, or if water would truly pass from one end of a
pipe segment to the surface at the other end and impact a ditch or street where the pipe ends. For
the pipes included in this analysis that were only crossing a road with openings on either end,
essentially acting as a culvert, these questions likely wouldn’t be an issue. The availability of all
the stormwater infrastructure data from Norfolk’s Open GIS site was critical to the success of
this study.
Future Work
There are a lot of possible avenues for building upon the results of this study. The model
could be run again, using just the known culverts and ditches, removing the pipe piece
altogether. This would remove the need for additional data on pipe elevations and slopes, and it
would be interesting to see how much the connectivity changes without the stormwater pipe data
18included. Building off current results by including precise elevations and slopes of the pipes
would allow for more accurate inundation amounts to be modeled for each sea-level rise
scenario. This additional information may also reveal that some of the pathways created in this
study would not be inundated until a certain threshold of sea-level rise is met. Further, seeing
how changing the diameter of the stormwater pipes and ditches data changes the inundated
surface and the corresponding inundation amounts would reveal further insight into how
different changes in stormwater infrastructure affects the capacity of the system overall. Building
on that, changing the locations where these infrastructure updates are made throughout the city,
and reviewing how connectivity and inundation changes, could be helpful in prioritizing
locations where infrastructure updates should be prioritized.
Green infrastructure updates, both proposed and those already installed, could be
incorporated into this model to see how inundation results change as well. Along a similar vein,
adding the catch basin structures into the model as locations where water may collect would add
another layer of detail and potentially positively affect the inundated landscape by increasing
areas below ground where water can accumulate when need be. Then, similarly to testing
changes in pipe and ditch infrastructure, the model could be adapted to include potential sites for
additional catch basins, retention ponds, and berms to see where those additional structures
would have the biggest impact on stormwater capacity. Another way that the current model and
results could be expanded is by experimenting with seeing how inundation changes because of
removing the potential for flow through outfall structures, mimicking flood valves.
The hydrographic overlay data brought an additional layer of detail to this study.
Combined with the stormwater infrastructure data, the results hypothetically show a more
detailed view of potential inundation for Norfolk as sea levels rise. It would be interesting to see
19the results of just the hydrographic data without the infrastructure piece and to compare the two.
Further, using the NWI data, it would be interesting to do a vulnerability assessment of the
wetland ecosystems that exist throughout Norfolk, by looking at the potential inundation of these
areas and their ability to migrate inland as sea levels rise.
All the potential future work, and the replicability of this study in general, depend upon
available data. The work outlined in this study as well as future work can be applied to other
coastal cities and municipalities, as well as coastal military bases to understand the potential
extent of inundation which can help prioritize planning and preparation.
Conclusion
Geospatial analysis tools including those used in this study can illustrate insufficiencies
in coastal infrastructure. This study illustrates the potential for stormwater infrastructure to
change the connectivity of the inundated landscape under low levels of sea-level rise if
mitigation goals are not achieved. Engineered structures such as flood and tide gates can assist in
keeping water out of areas. Updating outfalls to only allow the movement of water in one
direction with another flood gate-type addition can keep seawater out of the stormwater system
at high tide. As sea levels rise, the structural integrity of all stormwater infrastructure will
become even more important, and drainage improvements should be a priority for cities like
Norfolk. It is likely that a combination of engineered and green infrastructure will need to be
incorporated into city planning to mitigate high water levels daily at high tide, as well as during
heavy precipitation and storm surge events. Green infrastructure such as bioswales and rain
gardens can help to return stormwater to the groundwater, and reduce the stress put on
stormwater collection systems. In general, reducing the number of impermeable surfaces such as
20concrete is important for stormwater absorption and retention. Restoring and improving upon
coastal wetlands is crucial for restoring natural flood protection for coastal areas.
The results of this study will be useful in prioritizing areas and infrastructure for
improvements in the near term to protect the city from increasing nuisance flood events. This is a
helpful starting point for the city of Norfolk to review its current stormwater infrastructure, as
this study was conducted under the assumption that all the pipes, ditches, and structure points are
currently in use. Further, the inundation surface results could be used as a worst-case scenario
model, if flood and tide gates fail, for flooding at high tide under each sea-level rise scenario.
From there, larger-scale events could be modeled using the existing inundation surface to get a
more accurate model of flooding. Fine-scaled inundation modeling will be most useful in the
near term as cities plan for impacts that are already occurring daily. The geospatial analysis tools
such as those used in this study are valuable tools in the management of sea-level rise in coastal
communities.
21References
Burgos, A. G., Hamlington, B. D., Thompson, P. R., & Ray, R. D. (2018). Future nuisance
flooding in Norfolk, VA, from astronomical tides and annual to decadal internal climate
variability. Geophysical Research Letters, 45, 12,432– 12,439.
City of Norfolk. (2015). Coastal resilience strategy - norfolk. Retrieved March 1, 2022, from
https://www.norfolk.gov/DocumentCenter/View/16292/Coastal-Resilience-Strategy-
Report-to-Residents-?bidId=
City of Norfolk. (2018, June). A Green Infrastructure Plan for Norfolk: BUILDING RESILIENT
COMMUNITIES. A Green Infrastructure Plan for Norfolk. Retrieved March 1, 2022, from
https://www.norfolk.gov/DocumentCenter/View/38224/PH-3-Amend-plaNorfolk2030---
Adoption-of-Green-Infrastructure-Plan?bidId=
City of Norfolk GIS. (2021). Norfolk Open Gis Data. Norfolk Open GIS Data. Retrieved June 1,
2021, from https://norfolkgisdata-orf.opendata.arcgis.com/
DOD. (2021). Virginia State Facts - REPI. State Fact Sheet- Virginia . Retrieved July 8, 2021,
from
https://www.repi.mil/Portals/44/Documents/State_Fact_Sheets/Virginia_StateFacts.pdf
DOD. (2022). REPI 101. REPI. Retrieved April 10, 2022, from https://repiprimers.org/repi101/
IPCC, 2019: Summary for Policymakers. In: IPCC Special Report on the Ocean and Cryosphere
in a Changing Climate [H.-O. Pörtner, D.C. Roberts, V. Masson-Delmotte, P. Zhai, M.
Tignor, E. Poloczanska, K. Mintenbeck, A. Alegría, M. Nicolai, A. Okem, J. Petzold, B.
Rama, N.M. Weyer (eds.)]. In press.
Li, S., Wahl, T., Talke, S. A., Jay, D. A., Orton, P. M., Liang, X., Wang, G., & Liu, L. (2021).
Evolving tides aggravate nuisance flooding along the U.S. coastline. Science
advances, 7(10),
eabe2412. https://doi.org/10.1126/sciadv.abe2412
Malmquist, D. (2021, January 24). U.S. sea-level report cards: 2020 again trends toward
acceleration. Virginia Institute of Marine Science. Retrieved January 8, 2022, from
https://www.vims.edu/newsandevents/topstories/2021/slrc_2020.php
Murphy, R. (2019, August 15). Norfolk is fighting flooding by giving part of the city back to
nature. pilotonline.com. Retrieved April 6, 2022, from
https://www.pilotonline.com/government/local/article_97835ce8-d869-11e8-8a88-
3ff92071794b.html
NOAA OCM. (2017). (rep.). Detailed Method for Mapping Sea Level Rise Inundation . NOAA
Office for Coastal Management . Retrieved May 2021, from
https://coast.noaa.gov/data/digitalcoast/pdf/slr-inundation-methods.pdf.
22NOAA. (2019, February 21). What is high tide flooding? NOAA's National Ocean Service.
Retrieved March 31, 2022, from https://oceanservice.noaa.gov/facts/high-tide-
flooding.html
NOAA OCM. (n.d.). Sea level rise data download. Retrieved July 15, 2021, from
https://coast.noaa.gov/slrdata/
Shirzaei, M., Burgmann, R. (2018). Global Climate Change and Local Land Subsidence
Exacerbate Inundation Risk to the San Francisco Bay Area. Science Advances Vol. 4,
no.3.
Sweet, W.V., B.D. Hamlington, R.E. Kopp, C.P. Weaver, P.L. Barnard, D. Bekaert, W. Brooks,
M. Craghan, G. Dusek, T. Frederikse, G. Garner, A.S. Genz, J.P. Krasting, E. Larour, D.
Marcy,
J.J. Marra, J. Obeysekera, M. Osler, M. Pendleton, D. Roman, L. Schmied, W. Veatch,
K.D. White, and C. Zuzak, 2022: Global and Regional Sea Level Rise Scenarios for the
United States: Up- dated Mean Projections and Extreme Water Level Probabilities Along
U.S. Coastlines. NOAA Technical Report NOS 01. National Oceanic and Atmospheric
Administration, National Ocean Service, Silver Spring, MD, 111 pp.
https://oceanservice.noaa.gov/hazards/sealevelrise/noaa-nos- techrpt01-global-regional-
SLR-scenarios-US.pdf
Union of Concerned Scientists, 2016: Sea Level Rise and Tidal Flooding in Norfolk, Virginia.
Reports & Multimedia/ Case Study.
IPCC, 2022: Climate Change 2022: Impacts, Adaptation, and Vulnerability. Contribution of
Working Group II to the Sixth Assessment Report of the Intergovernmental Panel on
Climate Change [H.-O. Pörtner, D.C. Roberts, M. Tignor, E.S. Poloczanska, K.
Mintenbeck, A. Alegría, M. Craig, S. Langsdorf, S. Löschke, V. Möller, A. Okem, B.
Rama (eds.)]. Cambridge University Press. In Press.
VIMS. (n.d.). U.S. East Coast. Virginia Institute of Marine Science. Retrieved 2021, from
https://www.vims.edu/research/products/slrc/compare/east_coast/trends/index.php
WHOI. (2018, December 19). Why is sea level rising faster in some places along the U.S. East
Coast than others? Woods Hole Oceanographic Institution. Retrieved February 18, 2022,
from https://www.whoi.edu/press-room/news-release/why-is-sea-level-rising-higher-in-
some-places-along-u-s-east-coast-than-others/
ResilientVirginia. (2015, February 17). 100 resilient cities: Norfolk, Virginia. Resilient Virginia.
Retrieved January 15, 2022, from https://resilientvirginia.org/emergency-
preparedness/100-resilient-cities-norfolk-virginia
ResilientVirginia. (2022, February 4). Welcome to Resilient Virginia. Resilient Virginia.
Retrieved October 10, 2021, from https://resilientvirginia.org/
23Loftis, J. D., Wang, H. V., Hamilton, S. E., & Forrest, D. R. (n.d.). Combination of Lidar
Elevations, Bathymetric Data, and Urban Infrastructure in a Sub-Grid Model for
Predicting Inundation in New York City during Hurricane Sandy. 16.
Loftis, J. D., Wang, H. V., DeYoung, R. J., & Ball, W. B. (2016). Using Lidar Elevation Data to
Develop a Topobathymetric Digital Elevation Model for Sub-Grid Inundation Modeling
at Langley Research Center. Journal of Coastal Research, 76, 134–148.
https://doi.org/10.2112/SI76-012
Loftis, J. D., Mitchell, M., Atkinson, L., Hamlington, B., Allen, T. R., Forrest, D., Updyke, T.,
Tahvildari, N., Bekaert, D., & Bushnell, M. (2018). Integrated Ocean, Earth, and
atmospheric observations for Resilience Planning in Hampton Roads, Virginia. Marine
Technology Society Journal, 52(2), 68–83. https://doi.org/10.4031/mtsj.52.2.8
USGS. (n.d.). National Hydrography Dataset. National Hydrography Dataset | U.S. Geological
Survey. Retrieved November 10, 2021, from https://www.usgs.gov/national-
hydrography/national-hydrography-dataset
VDOT. (2020, January 22). Virginia Department of Transportation Bridges and Culverts.
Arcgis.com. Retrieved June 15, 2021, from
https://www.arcgis.com/home/item.html?id=e7e612bfacaf482aa1dd22c444e7074c
24Appendix
VirginiaSiteAd ...
Count
Clipping Virginia
Only Norfolk
Select Layer By Only Norfolk Address Points to
Virginia Counties Copy Features County - New Clip
Attribute County Selected Only Include those
Feature
in Norfolk
Calculate Calculate
Adding Latitude Calculating Adding Calculating Adding Elevation Calculating
Add Field Geometry Add Field (2) Geometry Add Field (3) Calculate Field
Field Latitude Longitude Field Longitude Field Elevation
Attributes Attributes (2)
Figure 5: Preprocessing needed to prepare grid of points to be input into NOAA vertical datum conversion software.
Natural Neighbor Natural Neighbor
(2) Interpolation of
VDatum Points
Vdatum Output XY Table To VDatum Output
Excel Point (4) Excel file as Point Natural Neighbor Natural Neighbor
file Interpolation v.2
IDW (2) IDW Interpolation
of VDatum Points
Adding 0.5m of sea
level rise to tidal Tidal Surface
surface Plus (3)
with 0.5m SLR
Natural Neighbor
Interpolation Tidal Surface
Copy Raster (2)
Raster Raster
Adding 1.0m of Tidal Surface with
sea level rise to Plus (2) 1.0m SLR
tidal surface
Figure 6: Top- Interpolation of VDatum software output grid. Bottom- Creating Tidal Surface with sea level rise
amounts added.
25Stormwater
Ditches Raster Ditches Raster;
Stormwater Ditches with an Feature to
Calculate Field with value = Reclassify NoData =1,
Ditches Elevation Raster
elevation field ditches = 0
Attribute
Figure 7: Example of preprocessing steps for each stormwater infrastructure piece, prior to including in the DEM.
Connected
Initial Depth
Raster Extract by Mask Inundated
Tidal SLR Raster Raster before
Calculator (4) (2) Raster with
connectivity
depths
Updated DEM Inundation Grouped Largest
Raster Raster Region Group Extract by
Existing DEM Updated DEM Reclassify (5) with water before running Inundation Inundated
Calculator Calculator (5) (2) Attributes (2)
reclassified connectivity Regions Region
Hydro Raster
Figure 8: Example of steps for creating depth grids and running connectivity to get connected inundated grid.
26You can also read