Salmonella Typhi and Salmonella Paratyphi prevalence, antimicrobial susceptibility profile and factors associated with enteric fever infection in ...
←
→
Page content transcription
If your browser does not render page correctly, please read the page content below
www.nature.com/scientificreports
OPEN Salmonella Typhi and Salmonella
Paratyphi prevalence, antimicrobial
susceptibility profile and factors
associated with enteric fever
infection in Bahir Dar, Ethiopia
Tadele Amsalu1, Chalachew Genet2* & Yesuf Adem Siraj2,3
Enteric fever (EF) is caused by Salmonella enterica serovars Typhi (S. Typhi) and Paratyphi (S.
Paratyphi) causing significant health problems in developing countries including Ethiopia. Thus
present study aimed to determine prevalence and antimicrobial resistance profile of S. Typhi and S.
Paratyphi among EF suspected patients at Felege-Hiwot comprehensive specialized hospital, Bahir
Dar, Ethiopia. Hospital based cross-sectional study was conducted from March-to-May 2020. Totally,
150 patients were included conveniently. Data were collected using questionnaires by face-to-face
interview. Concurrently, venous blood and stool specimens were collected and processed following
standard bacteriological technique. Antimicrobial susceptibility test (AST) was performed by disc
diffusion method. Logistic regression was performed to identify factors associated with EF infection.
The study indicated 5.3% EF prevalence where S. Typhi accounted 75%. S. Typhi and S. Paratyphi
isolates were 100% sensitive to cephalosporins but at least 83.3% showed resistance against
chloramphenicol and tetracycline. At least 66.7% of isolates were multidrug resistance (MDR). Using
well water for drinking (AOR = 6.22, CI 1.4–27.5) and previous EF history (AOR = 10.74, CI 2.01–55.9)
were significantly associated with EF infection. Thus high bacterial prevalence and MDR isolates was
observed. Therefore, health professionals should consider AST and use antibiotics with cautions for EF
patient management.
Abbreviations
AMR Antimicrobial resistance
AST Antimicrobial susceptibility test
CLSI Clinical Laboratory Standards Institute
EF Enteric fever
FHSCH Felege–Hiwot comprehensive specialized hospital
IRB Institutional review board
MDR Multidrug resistance
PTF Paratyphoid fever
TF Typhoid fever
WHO World Health Organization
Enteric fever is a faeco-orally transmitted bacterial disease comprising typhoid fever (TF) and paratyphoid
fever (PTF) caused by Salmonella enterica serovars typhi (S. Typhi) and Salmonella enterica serovars paratyphi
(S. Paratyphi) r espectively1,2. Globally in 2017, EF caused 14.3 million cases and 135,900 d
eaths3 where 76.3%
of the cases were caused by S.
1
Diagnostic Medical Laboratory Unit, Dangila Primary Hospital, Dangila, Ethiopia. 2Department of Medical
Laboratory Science, College of Medicine and Health Science, Bahir Dar University, P. O. Box: 79, Bahir Dar,
Ethiopia. 3CDT‑Africa, College of Health Sciences, Addis Ababa University, Addis Ababa, Ethiopia. *email:
chaliegenet@gmail.com
Scientific Reports | (2021) 11:7359 | https://doi.org/10.1038/s41598-021-86743-9 1
Vol.:(0123456789)www.nature.com/scientificreports/
Furthermore, TF causes about 11–20 million cases and 128,000 to 161,000 deaths as well as PTF cause 6
million cases and 54,000 deaths every year globally4. Though there is no licensed vaccine for PTF, the World
Health Organization recommended the use of typhoid conjugative vaccine in 2017 for T F3. Despite a decrease
in the morbidity and mortality associated with EF in industrialized countries, EF is one of major public health
problems in sub-Saharan countries having 2.6 times more TF incidence than the overall incidence in low and
middle income countries. Besides, because of low safe water access and sanitary facilities, EF is a common health
problem in Ethiopia2,3,5–7. Furthermore, the impact of EF is more complicated because of an ever increasing emer-
gency of antimicrobial resistance (AMR), including multidrug resistance (MDR), in S. Typhi and S. Paratyphi
for commonly prescribed antibiotics8–11.
Depending on different factors such as clinical specimen and laboratory method used, the prevalence of
EF is different globally ranging from 0.53 to 10.6%12–17. Previous studies in Ethiopia indicated a prevalence of
2.7–11%18,19. Furthermore different factors such as drinking unprotected or untreated water, eating unwashed
foods, having unimproved or damaged sanitation facilities were associated with EF i nfection1,13.
Knowledge of local EF burden, AMR profile of S. Typhi and S. Paratyphi together with identifying risk fac-
tors for infection acquisition are essential in developing proper strategies for typhoid and paratyphoid fever
prevention and c ontrol4,7,20 since there is considerable incidence variations in time and s pace1,21. Thus the present
study was intended to determine the prevalence, antimicrobial susceptibility profile and factors associated with
S. Typhi and S. Paratyphi infections among patients clinically suspected for EF at Felege-Hiwot comprehensive
specialized hospital (FHCSH), Bahir Dar, Northwest Ethiopia.
Methods
Study area, study design and period. A hospital based cross sectional study was conducted at FHCSH,
Bahir Dar, North West Ethiopia from March to May 2020 among patients clinically suspected as having enteric
fever by attending physician. FHCSH, which was established in 1952, serves for more than 5 million people liv-
ing in Bahir Dar city and surrounding zones. The hospital has 13 wards, 430 beds and about 531 health profes-
sionals. In the hospital patients clinically suspected as having EF are diagnosed using Widal test, the old serologi-
cal test than culture. The present study will give the extent of culture confirmed EF prevalence in the study area.
Inclusion and exclusion criteria. All patients having signs and symptoms of TF including fever (axil-
lary temperature > 37.5 °C), abdominal pain or discomfort, headache, constipation or diarrhea and give written
informed consent were included. On the other hand, patients clinically suspected as having EF but unconscious
during the study period or on antibiotic treatment were excluded.
Sample size and sampling technique. A total of 150 study participants were included using a single
population proportion formula taking 11% prevalence of EF from previous studies in northwest Ethiopia19, 5%
margin of error and 95% level of confidence. A convenient sampling method was used to select study partici-
pants until the required number was achieved.
Data collection on demographic and other variables. Data were collected on demographic variables
such as ages, sex, residence and other variables such as toilet availability, hand wash after toilet, water source,
eating habit, history of EF and HIV serostatus using a pre-tested structured questionnaire using a face-to-face
interview from patients clinically suspected for EF by attending physician.
Clinical specimen collection. After the interview, venous blood and stool specimens were collected asep-
tically from each study participant. Ten ml and 3 ml blood specimens were collected aseptically from adults and
children respectively using culture bottles with tryptone soya broth (Oxoid; Hampshire UK). Besides, fresh stool
specimens were collected using sterile screw capped containers. Both specimens were transported to medical
microbiology research laboratory of Bahir Dar University College of Medicine and Health Sciences within two
hours of collection.
Bacterial isolation and identification. Each blood culture bottle was incubated at 35 °C and observed
daily for 7 consecutive days for microbial growth evidenced by presence of hemolysis, gas formation or media
color change. But blood culture broth with no visual evidence of bacterial growth after 7 days of incubation was
sub-cultured before it was considered as negative. Culture bottles which showed growth were opened asepti-
cally and small amount of broth was taken using sterile wire loop and sub cultured into blood agar plate and
MacConkey agar (BIOMARK Laboratories, India). The liquid stool specimen was processed directly but fecal
suspension was prepared from formed stool specimen using normal saline. Four drops of fecal suspension was
added into bottles containing selenite F broth (Oxoid; Hampshire UK) and incubated at 35 °C for 18 h and then
sub-cultured into xylose-lysine-deoxycholate agar (XLD) (BIOMARK Laboratories, India), and MacConkey
agar (BIOMARK Laboratories, India) further incubated at 35 °C for 24 h. Identification of Salmonella genus
were done based on colony morphology, Gram staining and biochemical test following standard bacteriological
methods. Further serovar identification of S. Typhi and S. Paratyphi were performed by automated microbio-
logical technique using VITEK 2 system (BioMérieux diagnostics, France)22.
Antibiotic susceptibility testing. Antibiotic susceptibility testing (AST) was done by using Kirby-Bauer
disk diffusion method on Muller–Hinton agar (Oxoid, Hampshire UK) based on 2019 Clinical Laboratory
Standard Institute (CLSI) g uideline23. The turbidity of S. Typhi or S. Paratyphi isolates were adjusted using 0.5
Scientific Reports | (2021) 11:7359 | https://doi.org/10.1038/s41598-021-86743-9 2
Vol:.(1234567890)www.nature.com/scientificreports/
McFarland standard prepared from barium sulphate. All isolates were tested against amoxicillin-clavulanate
(20/10 µg), ceftriaxone (30 µg), cefotaxime (30 µg), cefoxitin (30 µg), ceftazidime (30 µg), gentamycin (10 µg),
tetracycline (30 µg), ciprofloxacin (5 µg), nalidixic Acid (30 µg), chloramphenicol (30 µg) and cotrimoxazole
(1.25/23.75 µg). Antibiotics used were selected based on CLSI guideline23, local prescription pattern, availability
and all were Oxoid (Basingstoke, Hampshire, England). Results of AST were interpreted based on CLSI 2019
guideline23.
Quality control. Before data collection, the questionnaire was pre-tested and every questionnaire was
checked for completeness after collection. All culture media was prepared following manufacturer’s instruc-
tion. A sample of culture media plates prepared from each batch was incubated at 37 °C for 24 h to cheek for
sterility. Before inoculation, the culture media was visually inspected for any microbial growth or deterioration.
Moreover, McFarland standard was used to standardize inoculums density of bacterial suspension for the AST.
Furthermore, Salmonella Typhomurium ATCC 14028 and Escherichia coli ATCC 25922 standard strains were
used as quality control23. Furthermore all methods section including sample collection, bacterial isolation and
AST were performed in accordance with CLSI and WHO guidelines22,23.
Data analysis. Collected data were entered and analyzed using Statistical Package for Social Science 25
(IBM Corp Released 2011.IBM SPSS statistics. Armonk, NY: IBM Corp). Descriptive statistics was used to
describe the demographic & other characteristics of the study participants, bacterial isolates and their AMR
profile. Multivariable analysis was done to determine factors associated with EF infection and P-value < 0.05 was
considered as statistically significant.
Ethics approval and consent to participate. Ethical clearance was obtained from the Institutional
Review Board (IRB) of Bahir Dar University, College of Medicine and Health Sciences protocol number
0013/2020. Moreover before data collection, written informed consent was obtained from each study participant
with age greater than or equal to 18 years. Furthermore, from study participants with age less than 18 years,
a written informed assent was obtained from their parents or legal guardian. In addition, all the information
obtained from the study participants was registered by code to maintain confidentiality and culture positive
results were communicated with responsible physician for proper patient management.
Results
Prevalence of enteric fever. Among 150 study participants, 81 (54%) and 95 (63.3%) were females and
urban residents respectively. The age range of study participants were 8–80 with a mean of 34.1 and median of
32.5 age in years. The overall prevalence of culture confirmed enteric fever was 5.3%. Enteric fever was more
prevalent on age group of 1–10 years (11.1%), females (6.2%) and rural residents (7.3%) than the other age
groups, males and urban residents respectively. Moreover, enteric fever was more prevalent on participants who
cannot read and write (7.4%) than participants who are educated (Table 1).
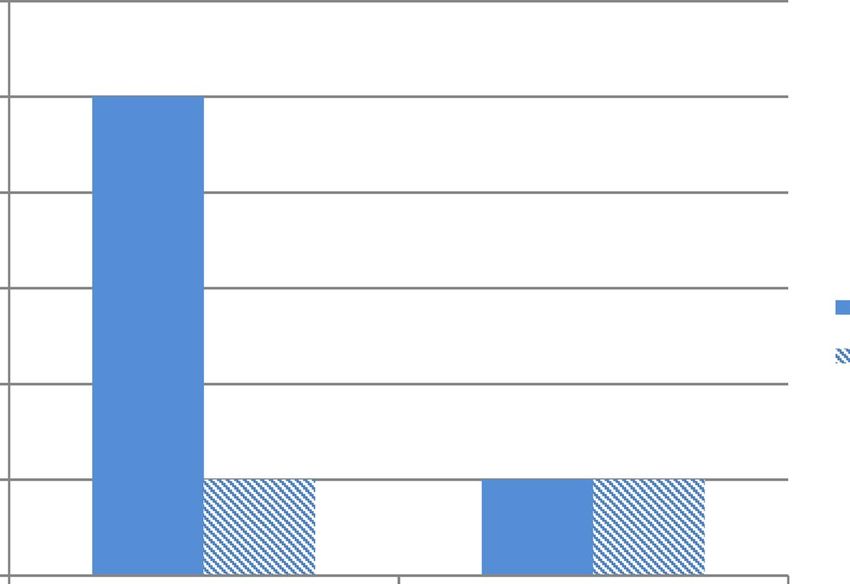
In the present study, the prevalence of TF (4%) was higher than PTF (1.3%). From the total 8 culture con-
firmed EF patients, 75% was caused by S. Typhi and 25% by S. Paratyphi A with no co-infection. Besides, 75%
and 25% of Salmonella species were isolated from blood and stool specimens respectively (Fig. 1).
Antimicrobial resistant profile of S. Typhi and S. Paratyphi isolates. S. Typhi revealed the highest
resistance rate for tetracycline and chloramphenicol with 83.3% for each. Similarly, all S. Paratyphi A isolates
were resistant for tetracycline, chloramphenicol and amoxicillin-clavulanate. On the other hand, all S. Typhi
and S. Paratyphi A isolated were susceptible for cefotaxime, ceftazidime and cefoxitin (Table 2). Furthermore, 4
(66.7%) and all isolates of S. Typhi and S. Paratyphi A were multidrug resistance (MDR) respectively.
Multivariable analysis on risk factors of EF infection. Based on multivariable analysis, using well
water for drinking and a previous history of EF were significantly associated explanatory factors for enteric fever
infection. Patients who have previous history of EF infection and used well water for drinking had 16.4 and 14.9
times more chance of developing EF than those who didn’t have a history of EF infection and used pipe water
for drinking respectively. Though it was not significant (P = 0.365), a considerable difference in EF infection was
observed among participants who didn’t have toilet (9.5%) than those having toilet (4.7%). Despite higher EF
infection compared with their counter parts, consuming raw meat (P = 0.402), raw vegetable (P = 0.510), street
food (P = 0.573) and drinking raw milk (P = 0.569) was not significantly associated with EF infection (Table 3).
Discussion
Enteric fever is a widespread public health problem in low and middle income countries including E thiopia21,24,
where 88% urban and 92% rural residents don’t treat drinking water and only 6% of households use improved
toilet facilities25. In the present study, the culture confirmed prevalence of EF was 5.3%. This was comparable with
previous studies in E thiopia26 and B
angladesh16 which reported 4.1% and 5% respectively. Similarly the preva-
lence of TF (4%) in the present study was comparable with previous studies in Shashemene, Ethiopia27 and abroad
in Egypt28. But the prevalence of EF in the present study was higher than a study done in E thiopia18, India12,29,30,
13 15
Fiji , and Nepal reporting 2.7%, 0.22–1.24%, 0.7%, and 2.5% respectively. Similarly lower TF prevalence than
the present study was reported by previous studies done in Cameroon (2.5%), Asian countries (2%), India
(0.14%), and Laos (1.5%)29,31–33. This could be due to variations in S. Typhi and S. Paratyphi prevalence in place,
Scientific Reports | (2021) 11:7359 | https://doi.org/10.1038/s41598-021-86743-9 3
Vol.:(0123456789)www.nature.com/scientificreports/
Variables CCEF: N (%) EF negative: N (%) Total EFSPP: N (%)
Age (in years)
1–10 1 (11.1) 8 (88.9) 9 (6.0)
11–20 1 (5.3) 18 (94.7) 19 (12.7)
21–30 2 (5.6) 34 (94.4) 36 (24.0)
31–40 1 (2.8) 35 (97.2) 36 (24.0)
41–50 2 (7.1) 26 (92.9) 28 (18.7)
> 50 1 (4.5) 21 (95.5) 22 (14.6)
Sex
Male 3 (4.3) 66 (95.7) 69 (46.0)
Female 5 (6.2) 76 (93.8) 81 (54.0)
Education
Can’t read & write 4 (7.4) 50 (92.6) 54 (36.0)
Primary education 1 (4.8) 20 (95.2) 21 (14.0)
Secondary education 1 (2.9) 33 (97.1) 34 (22.7)
Diploma and above 2 (4.9) 39 (95.1) 41 (27.3)
Occupation
Civil servant 1 (3.3) 29 (96.7) 30 (20.0)
Merchant 1 (4.3) 22 (95.7) 23 (15.3)
Farmer 2 (6.2) 30 (93.8) 32 (21.4)
Daily laborer 1 (8.3) 11 (91.7) 12 (8.0)
Housewife 2 (8.7) 21 (91.3) 23 (15.3)
Student 1 (3.3) 29 (96.7) 30 (20.0)
Residence
Urban 4 (4.2) 91 (95.8) 95 (63.3)
Rural 4 (7.3) 51 (92.7) 55 (36.7)
Total 8 (5.3) 142 (94.7) 150 (100)
Table 1. Prevalence of enteric fever among different socio-demographic variables of study participants
(n = 150) at FHCSH, Bahir Dar, Northwest Ethiopia, 2020. CCEF culture confirmed enteric fever, N number,
EFSPP enteric fever suspected patients processed.
6
5
Numuber of isolated bacteria
4
3
Blood specimens
Stool specimens
2
1
0
S. Typhi S. Paratyphi A
Bacteria isolated
Figure 1. Distribution of Salmonella serovars among different clinical specimens obtained from study
participants (n = 150) attending at FHCSH, Bahir Dar, Northwest Ethiopia, 2020.
Scientific Reports | (2021) 11:7359 | https://doi.org/10.1038/s41598-021-86743-9 4
Vol:.(1234567890)www.nature.com/scientificreports/
Antimicrobial resistance profile of isolates
S. Typhi (n = 6) S. Paratyphi A (n = 2)
Antibiotics tested R: N (%) I: N (%) S: N (%) R: N (%) I: N (%) S: N (%)
Amoxicillin-clavulanate 4 (66.6) 1 (16.7) 1 (16.7) 2 (100) 0 (0) 0 (0)
Gentamycin 1 (16.7) 1 (16.7) 4 (66.6) 1 (50) 0 (0) 1 (50)
Tetracycline 5 (83.3) 1 (16.7) 0 (0) 2 (100) 0 (0) 0 (0)
Ciprofloxacin 1 (16.7) 0 (0) 5 (83.3) 0 (0) 1 (50) 1 (50)
Nalidixic acid 3 (50) 2 (33.3) 1 (16.7) 0 (0) 0 (0) 2 (100)
Chloramphenicol 5 (83.3) 1 (16.7) 0 (0) 2 (100) 0 (0) 0 (0)
Cotrimoxazole 3 (50) 1 (16.7) 2 (33.3) 1 (50) 1 (50) 0 (0)
Ceftriaxone 1 (16.7) 0 (0) 5 (83.3) 1 (50) 0 (0) 1 (50)
Cefotaxime 0 (0) 0 (0) 6 (100) 0 (0) 0 (0) 2 (100)
Cefoxitin 0 (0) 0 (0) 6 (100) 0 (0) 0 (0) 2 (100)
Ceftazidime 0 (0) 0 (0) 6 (100) 0 (0) 0 (0) 2 (100)
Table 2. Antimicrobial resistance pattern of S. Typhi and S. Paratyphi A isolated from study participants
(n = 150) attending at FHSCH, Bahir Dar, Northwest Ethiopia, 2020. R resistant, I Intermediate, S Sensitive N
number of isolates.
Variable Total: N (%) Positive: N (%) COR AOR P-value
History of EF
Yes 35 (23.3) 5 (14.3) 6.22 (1.4–27.5) 16.4 (1.7–161.5) 0.02
No 115 (76.7) 3 (2.6) 1 1
Toilet usage
Yes 98 (65.3) 2 (2.0) 1 1
Sometimes 42 (28.0) 4 (9.5) 5.05 (0.88–28.7) 1.25 (0.10–14.6) 0.68
No 10 (6.7) 2 (20.0) 12.0 (1.48–96.8) 4.73 (0.24–91.8) 0.30
Hand wash after toilet
Yes 82 (54.7) 2 (2.4) 1 1
No 68 (45.3) 6 (8.8) 3.87 (0.75–19.8) 0.87 (0.08–9.93) 0.51
Soap use
Yes 85 (56.7) 1 (1.2) 1 1
No 65 (43.3) 7 (10.8) 10.0 (1.125–84) 11.0 (0.90–134) 0.07
Water source
Pipe water 112 (74.7) 1 (0.9) 1 1
Well water 38 (25.3) 7 (18.4) 10.74 (2.01–55.9) 14.9 (1.4–162.4) 0.01
HIV serostatus
Positive 12 (8.0) 3 (25.0) 8.87 (1.82–43.1) 0.29 (0.03–3.29) 0.39
Negative/unknown 138 (92.0) 5 (3.6) 1 1
Table 3. Factors associated with prevalence of enteric fever among febrile patients (n = 150) at FHCSH, Bahir
Dar, Northwest Ethiopia, 2020. EF enteric fever.
time and even in consecutive years at the same geographical l ocation21 and seasonal variability34. Furthermore
sensitivity differences in the laboratory detection methods used might also contribute for the difference observed.
thiopia19, Nepal14,35, India17, Nigeria36 and I ndonesia37
In contrast to our findings, previous studies in Jigjiga, E
reported a higher EF prevalence among febrile patients ranging from 11 to 14.1%. This might be due to the varied
incidence of TF in different study areas and periods38. Moreover, the geographical heterogeneous nature of TF
burden21,32 might also contribute for the difference observed. Furthermore, higher prevalence of S. Typhi than
S. Paratyphi was documented in the present study. Previous studies have reported comparably higher TF than
PTF prevalence in Ethiopia19,26, Indonesia37, Bangladesh16, India12, Fiji13, Nepal14, India17,30, and Indonesia37. On
the other hand, few studies in Ethiopia and abroad reported higher prevalence of S. Paratyphi than S. Typhi18,36.
In a meta-analysis done on EF24, S. Typhi accounted 76.1% which might indicate its higher share in causing EF
than S. Paratyphi.
Though higher EF prevalence in patients who consumed street foods was documented in the present study, it
was not significant. But a significant association was reported from studies in Indonesia37. The difference might
be due to differences in study design and area. Furthermore, there may be variations on street food type and
extent of cooking. On the other hand, using well water for drinking and previous history of EF were significantly
Scientific Reports | (2021) 11:7359 | https://doi.org/10.1038/s41598-021-86743-9 5
Vol.:(0123456789)www.nature.com/scientificreports/
associated explanatory factors for EF infection. Comparable findings were reported from previous studies in
Ethiopia19,27. The significant association of previous history of EF with current EF infection might be due to the
reactivation from previous infections.
Antimicrobial resistance in S. Typhi and S. Paratyphi in low and middle-income countries is worsening24.
Despite the establishment of AMR surveillance in Ethiopia39, it is a growing challenge where the overall preva-
lence of MDR is high and inappropriate antibiotic use such as self-medication is common40. In the present
study, S. Typhi and S. Paratyphi A showed variable resistance level to different categories of antibiotics tested.
Both S. Typhi and S. Paratyphi showed the highest resistance level against tetracycline and chloramphenicol
with more than 83% for each. The resistance level for chloramphenicol in both isolated bacteria in the present
study was comparable with previous s tudies19 but higher than previous reports for S. Typhi16,28,30,33,36,41,42 and
S. Paratyphi16,36,42. Furthermore the resistance level against tetracycline for both bacteria was comparable with
study in Nigeria36 but higher than study in Ethiopia19. Similarly a significantly higher resistance level of S. Typhi
and S. Paratyphi A was documented against tetracycline and chloramphenicol in the present study than study in
Nepal (13.56%)35. Furthermore, half of S. Typhi and S. Paratyphi A isolates in the present study were resistant for
cotrimoxazole which was comparable with studies in Nigeria36, and Laos33 but higher than study in India30,42. This
variation might be due to study period and setting difference. Besides this, increased resistance level from year-
to-year for different antibiotics such as chloramphenicol and c otrimoxazole42,43 might be a contributing factor.
Half of S. Typhi and both of S. Paratyphi A isolates were susceptible to nalidixic acid. The resistance level of
S. Typhi against nalidixic acid in the present study was comparable with a study in India42. Though there was a
study which reported higher resistance level35, many previous studies documented lower resistance level of S.
Typhi against nalidixic acid than the present study16,19,41. Furthermore, 83.3% of S. Typhi and 50% of S. Paratyphi
A isolates were susceptible to ciprofloxacin. In the present study, the resistance level of S. Typhi against cipro-
floxacin was comparable with previous studies16,19,41 but higher resistance level of S. Paratyphi A was documented
than previous s tudies16,19. The resistance level for both bacteria in the present study was higher than studies in
Nepal35, Nigeria36, and India42. This increased fluoroquinolone resistance was also supported by previous study
reporting an increased level of resistance by S. Typhi and S. paratyphi over y ears14,43.
On the other hand, all isolates of S. Typhi and S. Paratyphi A were susceptible to cephalosporins including
cefotaxime, cefoxitin and ceftazidime. Unlike S. Typhi which revealed 100% sensitivity, half of S. Paratyphi A
showed resistance to ceftriaxone. Comparable susceptible result was reported for S. Typhi in previous studies for
ceftriaxone16,19,35,36,42 and c eftazidime36. The resistance level in the present study was higher than previous study
reports for S. Paratyphi A against c eftriaxone16,19,35,36,42. But S. Paratyphi A showed lower resistance to ceftazidime
than previous r eports36. The increased resistance of S. Typhi and S. Paratyphi A in the present study against dif-
ferent classes of antibiotics might be due to sample size difference, antibiotic misuse, and inappropriate prescrib-
ing practice of health professionals coupled with resistance gene transfer among different Salmonella species.
The present study revealed that 66.7% of S. Typhi and all isolates of S. Paratyphi were MDR. Though the
MDR level of S. Typhi in the present study was comparable with a study in Bangladesh (64.28%)41, it was higher
than many previous studies in Ethiopia19, and elsewhere such as Egypt, Nigeria, Asian countries, India, and
Laos28,32,33,36,42 which reported 0 to 29%. Similarly the MDR level of S. Paratyphi in the present study was higher
than studies in E thiopia19 and a broad24,36,42 which documented 0 to 25%. The high MDR level was supported
by meta-analysis study which indicated the worsening AMR trend among S. Typhi and S. P aratyphi24. The cur-
rent study is limited in that it has low sample size and did not isolate resistance genes from both S. Typhi and
S. Paratyphi isolates.
Conclusions
High prevalence of EF mainly caused by S. Typhi was observed. Besides increased resistance of S. Typhi and
S. Paratyphi for commonly prescribed antibiotics in the study area such as ciprofloxacin and ceftriaxone were
revealed than previous reports. Besides, the majority of S. Typhi and all isolates of S. Paratyphi A were MDR.
On the other hand all S. Typhi and S. Paratyphi A isolates were fully susceptible to cefoxitin and ceftazidime.
Besides previous history of EF and using well water for drinking were significantly associated explanatory factors
with EF infection. Thus treatment of EF should be supported with AST mainly in patients having a history of EF
infection. Health professionals should use antibiotics with cautions during empirical therapy of EF suspected
patients. Including EF topics on their health education system will be helpful. Besides, further large scale and
molecular studies are recommended to understand the extent of S. Typhi and S. Paratyphi prevalence, their AMR
profile and reveal AMR genes.
Data availability
All relevant data are included within the manuscript.
Received: 4 November 2020; Accepted: 18 March 2021
References
1. Adesegun, O. A. et al. Current trends in the epidemiology and management of enteric fever in Africa: A literature review. Asian
Pac. J. Trop. Med. 13(5), 204–213 (2020).
2. World Health Organization. Typhoid fever. 2018. Available at: https://w
ww.w ho.i nt/n
ews-r oom/f act-s heets/d
etail/t yphoi d Accessed
on: January 2020.
3. GBD 2017 Typhoid and Paratyphoid Collaborators. The global burden of typhoid and paratyphoid fevers: A systematic analysis
for the Global Burden of Disease Study 2017. Lancet Infect. Dis. https://doi.org/10.1016/S1473-3099(18)30685-6 (2019).
Scientific Reports | (2021) 11:7359 | https://doi.org/10.1038/s41598-021-86743-9 6
Vol:.(1234567890)www.nature.com/scientificreports/
4. World Health Organization. Vaccine Preventable disease surveillance standards- Typhoid and other invasive salmonellosis. Avail-
able at: https://www.who.int/drugresistance/documents/surveillancereport/en/ Accessed on February 2020.
5. AntilloÂn, M. et al. The burden of typhoid fever in low- and middle-income countries: A meta-regression approach. PLoSNegl.
Trop. Dis. 11(2), e0005376. https://doi.org/10.1371/journal.pntd.0005376 (2017).
6. Mogasale, V. et al. Burden of typhoid fever in low-income and middle-income countries: A systematic, literature-based update
with risk-factor adjustment. Lancet Glob. Health 2(10), e570-580 (2014).
7. Buckle, G. C., Walker, C. L. & Black, R. E. Typhoid fever and paratyphoid fever: Systematic review to estimate global morbidity
and mortality for 2010. J. Glob. Health 2, 10401 (2012).
8. Britto, C. D., Wong, V. K., Dougan, G. & Pollard, A. J. A systematic review of antimicrobial resistance in Salmonellaentericase-
rovarTyphi, the etiological agent of typhoid. PLoSNegl. Trop. Dis. 12(10), e0006779. https://doi.org/10.1371/journal.pntd.00067
79 (2018).
9. Crump, J. A. & Mintz, E. D. Global trends in typhoid and paratyphoid fever. Clin. Infect. Dis. 50(2), 241–246 (2010).
10. Procaccianti, M. et al. First case of typhoid fever due to extensively drug-resistant Salmonella entericaserovartyphi in Italy. Patho-
gens. 9, 151. https://doi.org/10.3390/pathogens9020151 (2020).
11. Parry, C. M., Basnyat, B. & Crump, J. A. The management of antimicrobial-resistant enteric fever. Expert Rev. Anti Infect. Ther.
11(12), 1259–1261 (2013).
12. Sur, D. et al. A retrospective review of hospital-based data on EntericFever in India, 2014–2015. J. Infect. Dis. 218(S4), S206–S213
(2018).
13. Prasad, N. et al. Epidemiology and risk factors for typhoid fever in Central Division, Fiji, 2014–2017: A case–control study. PLoS-
Negl. Trop. Dis. 12(6), e0006571. https://doi.org/10.1371/journal.pntd.0006571 (2018).
14. Zellweger, R. M. et al. A 23-year retrospective investigation of SalmonellaTyphi and SalmonellaParatyphi isolated in a tertiary
Kathmandu hospital. PLoSNegl. Trop. Dis. 11(11), e0006051. https://doi.org/10.1371/journal.pntd.0006051 (2017).
15. Andrews, J. R. et al. High rates of enteric fever diagnosis and lower burden of culture-confirmed disease in peri-urban and rural
Nepal. J. Infect. Dis. 218(S4), S214–S221 (2018).
16. Naheed, A. et al. Burden of typhoid and paratyphoid fever in a densely populated urban community, Dhaka, Bangladesh. IJID.
14S, e93–e99 (2010).
17. John, J., Van Aart, C. J. C. & Grassly, N. C. The burden of typhoid and paratyphoid in India: Systematic review and meta-analysis.
PLoSNegl. Trop. Dis. 10(4), e0004616. https://doi.org/10.1371/journal.pntd.0004616 (2016).
18. Deksissa, T. & Gebremedhin, E. Z. cross-sectional study of enteric fever among febrile patients at Ambo hospital: Prevalence, risk
factors, comparison of Widal test and stool culture and antimicrobials susceptibility pattern of isolates. BMC Infect. Dis. 19, 288.
https://doi.org/10.1186/s12879-019-3917-3 (2019).
19. Admassu, D., Egata, G. & Teklemariam, Z. Prevalence and antimicrobial susceptibility pattern of SalmonellaentericaserovarTyphi
and SalmonellaentericaserovarParatyphi among febrile patients at Karamara Hospital, Jigjiga, eastern Ethiopia. SAGE Open Med.
7, 1–7 (2019).
20. Radhakrishnan, A. et al. Introductory article on global burden and epidemiology of typhoid fever. Am. J. Trop. Med. Hyg. 99(Suppl
3), 1–6 (2018).
21. Marchello, C. S., Hong, C. Y. & Crump, J. A. Global typhoid fever incidence: A systematic review and meta-analysis. Clin. Infect.
Dis. 68(S2), S105–S116 (2019).
22. WHO. Basic laboratory procedures in clinical bacteriology. Basic laboratory procedures in clinical bacteriology. 2003. Available
at: https://www.who.int/medical_devices/publications/basic_lab_procedures_clinical_bact/en/ Accessed on: January, 2020.
23. CLSI. Performance Standards for Antimicrobial Susceptibility Testing. 29th ed. CLSI supplements M100. Wayne, PA: Clinical and
Laboratory Standards Institute; 2019.
24. Browne, A. J. et al. Drug-resistant enteric fever worldwide 1990 to 2018: A systematic review and meta-analysis. BMC Med. 18, 1.
https://doi.org/10.1186/s12916-019-1443-1 (2020).
25. Central Statistical Agency (CSA) [Ethiopia] and ICF. 2016. Ethiopia Demographic and Health Survey 2016. Addis Ababa, Ethiopia,
and Rockville, Maryland, USA: CSA and ICF.
26. Andualem, G., Abebe, T., Kebede, N., Gebre-Selassie, S., Mihret, A., Alemayehu, H. A comparative study of Widal test with blood
culture in the diagnosis of typhoid fever in febrile patients. BMC Research Notes. 2014;7: 653. http://www.biomedcentral.com/
1756-0500/7/653.
27. Habte, L., Tadesse, E., Ferede, G. & Amsalu, A. Typhoid fever: Clinical presentation and associated factors in febrile patients visiting
Shashemene Referral Hospital, southern Ethiopia. BMC Res Notes. 11, 605. https://doi.org/10.1186/s13104-018-3713-y (2018).
28. Srikantiah, P. et al. Population-based surveillance of typhoid fever in Egypt. Am. J. Trop. Med. Hyg. 74(1), 114–119 (2006).
29. Sur D, Ali M, Seidlein LV, Manna B, Deen JL, Acosta CJ, et al. Comparisons of predictors for typhoid and paratyphoid fever in
Kolkata, India. BMC Public Health 2007, 7:289. http://www.biomedcentral.com/1471-2458/7/289.
30. Gupta, V., Singla, N., Bansal, N., Kaistha, N. & Chander, J. Trends in the antibiotic resistance patterns of enteric fever isolates-a
three year report from a tertiary care centre. Malays. J. Med. Sci. 20(4), 71–75 (2013).
31. Nsutebu, E., Martins, P. & Adiogo, D. Prevalence of typhoid fever in febrile patients with symptoms clinically compatible with
typhoid fever in Cameroon. Trop. Med. Int. Health. 8(6), 575–578 (2003).
32. Ochiai, R. L. et al. A study of typhoid fever in five Asian countries: Disease burden and implications for controls. Bull. World Health
Organ. 86, 260–0268 (2008).
33. Roberts, T. et al. Typhoid in Laos: An 18-year perspective. Am. J. Trop. Med. Hyg. 102(4), 749–757 (2020).
34. Dewan, A. M., Corner, R., Hashizume, M. & Ongee, E. T. Typhoid fever and its association with environmental factors in the
dhaka metropolitan area of Bangladesh: A spatial and time-series approach. PLoSNegl. Trop. Dis. 7(1), e1998. https://doi.org/10.
1371/journal.pntd.0001998 (2013).
35. Acharya, D., Bhatta, M. S., Dumre, S. P. & Adhikari, K. B. P. Salmonella entericaserovarParatyphi A: An emerging cause of febrile
illness in Nepal. Nepal Med. Coll. J. 13(2), 69–73 (2011).
36. Ohanu, M. E., Iroezindu, M. O., Maduakor, U., Onodugo, O. D. & Gugnani, H. C. Typhoid fever among febrile Nigerian patients:
Prevalence, diagnostic performance of the Widal test and antibiotic multi-drug resistance. Malawi. Med. J. 31(3), 190–198 (2019).
37. Vollaard, A. M. et al. Risk factors for typhoid and paratyphoid fever in Jakarta. JAMA 291(21), 2607–2615 (2004).
38. Mogasale, V. et al. Revisiting typhoid fever surveillance in low and middle income countries: lessons from systematic literature
review of population based longitudinal studies. BMC Infect. Dis. 16, 35 (2016).
39. Ibrahim, R. A. et al. Antimicrobial resistance surveillance in Ethiopia: Implementation experiences and lessons learned. Afr. J.
Lab. Med. https://doi.org/10.4102/ajlm.v7i2.770 (2018).
40. Antibiotic use and resistance pattern in Ethiopia: Systematic review and meta-analysis. Int. J. Microbiol. 2019; Article ID 2489063,
8 pages. https://doi.org/https://doi.org/10.1155/2019/2489063
41. Mannan, A. et al. A cross sectional study on antibiotic resistance pattern of Salmonella typhi clinical isolates from Bangladesh.
Asian Pac. J. Trop. Biomed. 4(4), 306–311 (2014).
42. Misraa, R. et al. Absence of multidrug resistance in Salmonella enterica serotypes Typhi and Paratyphi A isolates with intermediate
susceptibility to ciprofloxacin. Trans. R. Soc. Trop. Med. Hyg. https://doi.org/10.1093/trstmh/trv036 (2015).
43. Hasan, R. et al. Antibiotic resistance among Salmonella entericaserovarsTyphi and Paratyphi A in Pakistan (2001–2006). J. Infect.
Dev. Countr. 2(4), 289–294 (2008).
Scientific Reports | (2021) 11:7359 | https://doi.org/10.1038/s41598-021-86743-9 7
Vol.:(0123456789)www.nature.com/scientificreports/
Acknowledgements
We would like to acknowledge all study participants for their involvement in the study. Moreover, our thanks
go to health professionals working in FHCSH for their kind contribution to collect specimens. Finally, we
acknowledge Bahir Dar University Department of Medical Laboratory Science for allowing Medical Microbiol-
ogy laboratory to conduct the study.
Author contributions
T.A. contributed to study conception and design, study participant enrolment, acquisition of data, laboratory
investigations, data analysis and interpretation and wrote the first draft of the manuscript and agreed to be
accountable for its contents; C.G. contributed to study conception and design, attested the quality of laboratory
process, data analysis and study report, prepared the final manuscript and agreed to be accountable for its con-
tents; Y.A.S. contributed to study conception and design, attested the quality of the laboratory process, accuracy
of data, data analysis, interpretation and study report, refined the final manuscript preparation and agreed to be
accountable for its contents. All authors read and approved the final manuscript.
Funding
The research project was funded by College of Medicine and Health Sciences, Bahir Dar University. The fund
was utilized for purchasing reagents, data collection, analysis and interpretation.
Competing interests
The authors declare no competing interests.
Additional information
Correspondence and requests for materials should be addressed to C.G.
Reprints and permissions information is available at www.nature.com/reprints.
Publisher’s note Springer Nature remains neutral with regard to jurisdictional claims in published maps and
institutional affiliations.
Open Access This article is licensed under a Creative Commons Attribution 4.0 International
License, which permits use, sharing, adaptation, distribution and reproduction in any medium or
format, as long as you give appropriate credit to the original author(s) and the source, provide a link to the
Creative Commons licence, and indicate if changes were made. The images or other third party material in this
article are included in the article’s Creative Commons licence, unless indicated otherwise in a credit line to the
material. If material is not included in the article’s Creative Commons licence and your intended use is not
permitted by statutory regulation or exceeds the permitted use, you will need to obtain permission directly from
the copyright holder. To view a copy of this licence, visit http://creativecommons.org/licenses/by/4.0/.
© The Author(s) 2021
Scientific Reports | (2021) 11:7359 | https://doi.org/10.1038/s41598-021-86743-9 8
Vol:.(1234567890)You can also read