Salicylic acid promoted apple metabolic responses against Penicillium expansum infection
←
→
Page content transcription
If your browser does not render page correctly, please read the page content below
Salicylic acid promoted apple metabolic responses
against Penicillium expansum infection
Jianyi Zhang
Research Institute of Pomology Chinese Academy of Agricultural Sciences
Ning Ma
Agricultural University of Hebei
Guofeng Xu
Research Institute of Pomology Chinese Academy of Agricultural Sciences
Lixue Kuang
Research Institute of Pomology Chinese Academy of Agricultural Sciences
Zhiyuan Li
AB Sciex Analytical Instrument Trading Co., Ltd
Youming Shen ( shenyouming@caas.cn )
Research Institute of Pomology Chinese Academy of Agricultural Sciences
Research Article
Keywords: Malus domestica, salicylic acid, Penicillium expansum, metabolism, metabonomics
Posted Date: April 11th, 2023
DOI: https://doi.org/10.21203/rs.3.rs-2789383/v1
License: This work is licensed under a Creative Commons Attribution 4.0 International License.
Read Full License
Page 1/24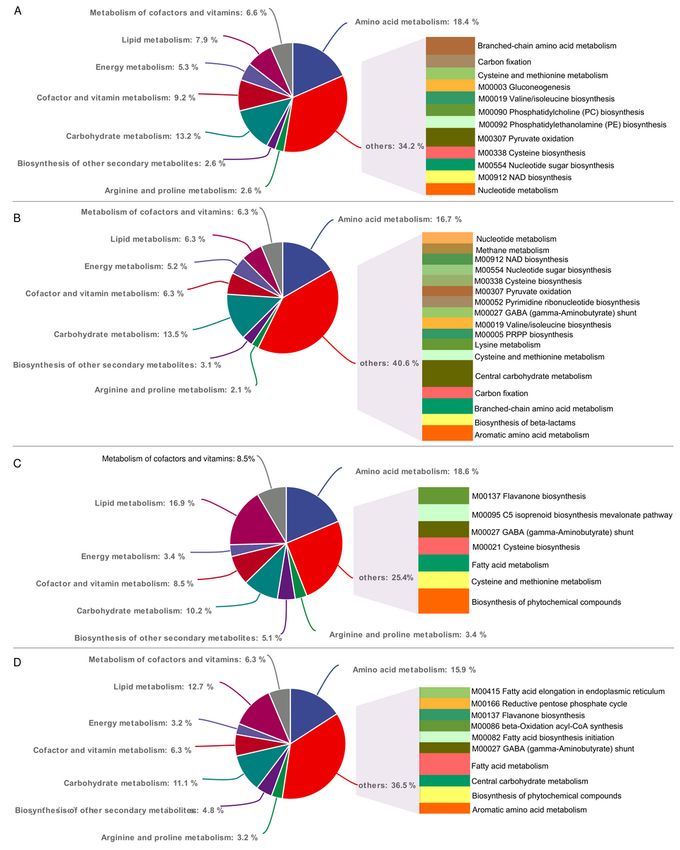
Abstract
Blue mold caused by Penicillium expansum (P. expansum) infection results in severe postharvest
deterioration of apples. Salicylic acid (SA) is an effective elicitor that promotes fruit resistance. However,
the metabolic mechanism of P. expansum infection of apples and the SA-mediated metabolic responses
are still unknown. In this study, the metabolic changes during apple P. expansum infection and SA-
mediated disease resistance were explored by performing ultra-performance liquid chromatography and
quadrupole-time of flight mass spectrometry. A total of 472 different metabolites were identified between
samples, and the correlated metabolic pathways were revealed by bioinformatics analysis. The
upregulation of the tricarboxylic acid (TCA) cycle, galactose metabolism, and starch and sucrose
metabolism reflected energy conversion for P. expansum invasion and fruit disease resistance. Changes
in glyoxylate and dicarboxylate metabolism and carbapenem biosynthesis reflected the biosynthesis of
virulence factors and secondary metabolites for fungal infection. Metabolic pathways related to apple
natural disease resistance mainly included the upregulation of secondary metabolite biosynthesis and
sphingolipid metabolism. SA promoted the TCA cycle, reactive oxygen metabolism and secondary
metabolite biosynthesis of apples for disease resistance. This study improved the understanding of the
pathogenic mechanism of P. expansum infection of apples and the metabolic processes for SA-mediated
disease resistance.

1. Introduction
Apple (Malus domestica) is an important fruit that provides beneficial nutrients of vitamins, polyphenols,
and dietary fiber for human health. China is the leading country for apple production worldwide, devoting
approximately half of the total apple production (Zhang et al., 2022). In many temperate areas of China,
apples are seasonally harvested from September to November and stored in cold conditions for long-term
trade and consumption. However, postharvest fungal infections induce apple deterioration and result in
huge economic losses. Blue mold is the main postharvest disease of apples and is mainly caused by
Penicillium expansum infection (Welke, 2019; Li et al., 2020). This disease can lead to serious rot and
losses of fruits, and the contamination of mycotoxins in apple-derived products, which is a key factor
endangering the storage and quality of apples and their products (Shen et al., 2021). The application of
fungicides is an effective way to inhibit fungal infection. However, inappropriate use of fungicides
imperils the health of consumers and causes potential risks to the environment (Cai, Xiong, Hong, & Hu,
2021). New strategies for disease prevention in apples are important for postharvest storage and quality
control.

An alternative strategy for postharvest disease prevention is to improve the disease resistance of the fruit
itself (Romanazzi et al., 2016; Wang et al., 2019). Salicylic acid (SA) is an effective reagent to promote
fruit disease resistance (Fu & Dong, 2013; Jiang et al., 2022). SA is a natural phenolic acid that exists in
many plant organs and acts as a defensive hormone performing multiple biofunctions. The biosynthesis
of SA is enhanced by environmental stresses and pathogens, which is essential for the induction of
systematic acquired resistance (Fu et al, 2013). Exogenous application of SA improved the properties of
                                                   Page 2/24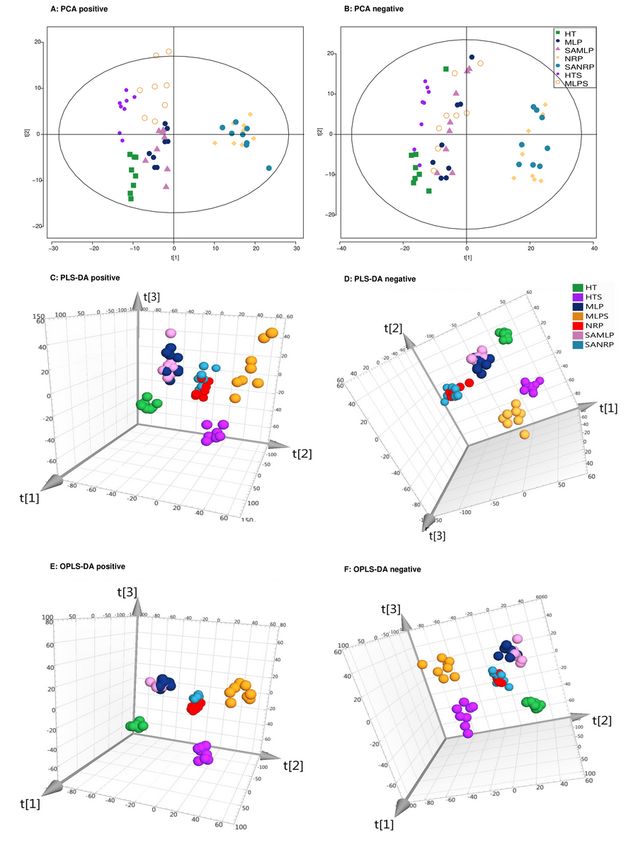
disease resistance in apples (da Rocha Neto, Luiz, Maraschin, & Di Piero, 2016; Mo et al., 2008). Moreover,
SA is eco-friendly when compared with fungicides. Thus, SA is a promising candidate for the control of
apple blue mold in postharvest storage.

The pathways of SA-mediated disease resistance have been intensively elaborated in recent decades
(Pokotylo, Kravets, & Ruelland, 2019). Nonexpressor of pathogenesis-related protein 1 (NPR1) is a classic
SA-binding protein correlated with multiple pathogenic functions (Backer, Naidoo, & van den Berg, 2019).
In addition, several SA binding proteins have been identified that perform functions independently
(Pokotylo et al., 2019). SA also mediates downstream responses in gene expression and biochemical
reactions (Chen et al., 2021). Specifically, SA-mediated metabolic responses are critical for disease
resistance and are mainly stressed by secondary metabolism (Ahmadi-Afzadi, Nybom, Ekholm, Tahir, &
Rumpunen, 2015; Golding, McGlasson, Wyllie, & Leach, 2001; Matthes & Schmitz-Eiberger, 2009).
However, the overall metabolite changes during fruit and pathogen interactions and the SA-mediated fruit
metabolic pathways for disease resistance are not well known. In addition, fungal invasion disturbs fruit
metabolism and SA-promoted fruit metabolic resistance (Shen et al., 2021). Therefore, further exploration
should be conducted to reveal the metabolic pathways of SA-mediated disease resistance.

Metabonomics employs powerful instruments and comprehensive databases to analyze metabolites in
biological samples with high throughput and efficiency (Oms-Oliu, Odriozola-Serrano, & Martin-Belloso,
2013; Shen et al., 2021). Combined with bioinformatic analysis, metabonomics can explain the
metabolism of biological processes at a deep and comprehensive level. In recent years, metabonomics
has aided the study of fruit disease (Yang et al., 2021), nutrition characteristics (Gong et al., 2021; Xu et
al., 2020), and quality control (Chen, Zhao, Wu, He, & Yang, 2020). We recently studied the changes in
metabolites in apples during Penicillium expansum infection and identified potential biomarkers (Shen et
al., 2021). However, the metabolic pathways of P. expansum infection and SA-mediated disease
resistance are still unknown.

The objective of the present study was to investigate the metabolic pathways of apple and P. expansum
interactions and SA-mediated metabolic responses for disease resistance. Apples were infected with P.
expansum under different conditions, and typical tissues were collected for metabonomic analysis by
ultra-performance liquid chromatography and quadrupole-time of flight mass spectrometry (UPLC-Q-
TOF/MS). The changes in metabolic profiles and pathways related to P. expansum infection of apples
and SA-mediated disease resistance were analysed. This study will help reveal the metabolic mechanism
of apple and P. expansum interactions and postharvest disease control.

2. Materials And Methods
2.1. Chemicals and reagents
Potato dextrose agar (PDA) was purchased from Beijing Aoboxing Biotech Co. Ltd. (Beijing, China).
Glycerine and Tween 20 were purchased from Coolaber Science and Technology Co. (Beijing, China). SA

                                                   Page 3/24
was purchased from Sigma Chemical Co. (St Louis, MO, USA). Acetonitrile, isopropanol, and methanol of
MS grade for sample preparation and chromatographic analysis were purchased from Fisher Chemicals
Co. (New Jersey, USA). Ammonium acetate and formic acid of MS grade for mobile phase modification
were purchased from Sinopharm Chemical Reagent Co. Ltd. (Shanghai, China). Ultra-pure water was
obtained from a water purification system (Milli-Q-Direct 8, Millipore, MA, USA).

2.2. Fungal spore preparation, apple infection, and sample
collection
The P. expansum strain was previously obtained (Shen et al., 2021). P. expansum was cultured on PDA
for 15 d, and the fungal spores were harvested and suspended in sterilized 0.2% Tween 20. The
concentration of spores was diluted to 105 units per mL before inoculation. Fuji apples were harvested
from the hot springs experimental base of the Research Institute of Pomology Chinese Academy of
Agricultural Sciences and then preserved in cold storage (0 ± 0.5°C). A total of 120 healthy fruits were
selected and randomly divided into five groups. The five group samples contained a group of SA
treatment samples, two control samples, and two sterilized samples. The two control and two sterilized
samples both contained a positive sample with P. expansum infection and a negative control sample
without P. expansum infection. Before P. expansum inoculation, the SA-treated samples were immersed in
SA solution (5 mM) at 22°C for 30 min, the control samples were treated with water under the same
conditions, and the sterilized samples were placed in an autoclave heated at 105°C for 5 min to kill the
fruit tissues. The P. expansum-infected samples, including SA treatment samples, positive control
samples, and positive sterilized samples, were wounded by a sterile lancet on two opposite sides of the
fruit and inoculated with 10 µL of the fungal spore suspension (Mueller et al., 2004). The control samples,
including negative control and negative sterilized samples, were treated with 10 µL sterilized water. Then,
all samples were incubated at 25°C and 95% relative humidity for 10 d, and the blue mold lesion size was
measured each day.

From the positive control samples and SA-treated samples, the margin lesions of P. expansum-infected
tissues (MLP and SAMLP, margin lesions ± 0.5 cm) and the newly generated rot tissues of P. expansum
infection (NRP and SANRP, margin lesions 1.0-1.5 cm) were collected. From the positive sterilized
samples, the margins of lesions of P. expansum-infected sterilized samples (MLPS, margin lesions ± 0.5
cm) were collected. The negative control samples and sterilized samples were observed without disease,
and healthy tissues (HT, near the inoculation site 0.5–1.5 cm) and healthy tissues of sterilized samples
(HTS) were collected. Therefore, seven group samples, including SAMLP and SANRP, MLP and NRP,
MLPS, HTS, and HT, were prepared with eight replicates. Then, samples were quenched in liquid nitrogen,
ground by a SPEX Prep system (New Jersey, USA), and stored at -80°C.

2.3. Sample preparation and instrumental analysis
Frozen samples (80 mg) were mixed with l mL of acetonitrile-methanol-water (2:2:1, v/v) and
ultrasonically extracted at 4°C for 1 h (Shen et al., 2021). The samples were incubated at -20°C for 1 h
and then centrifuged at 14,000 × g for 20 min at 4°C. The supernatants were harvested and dried under
                                                 Page 4/24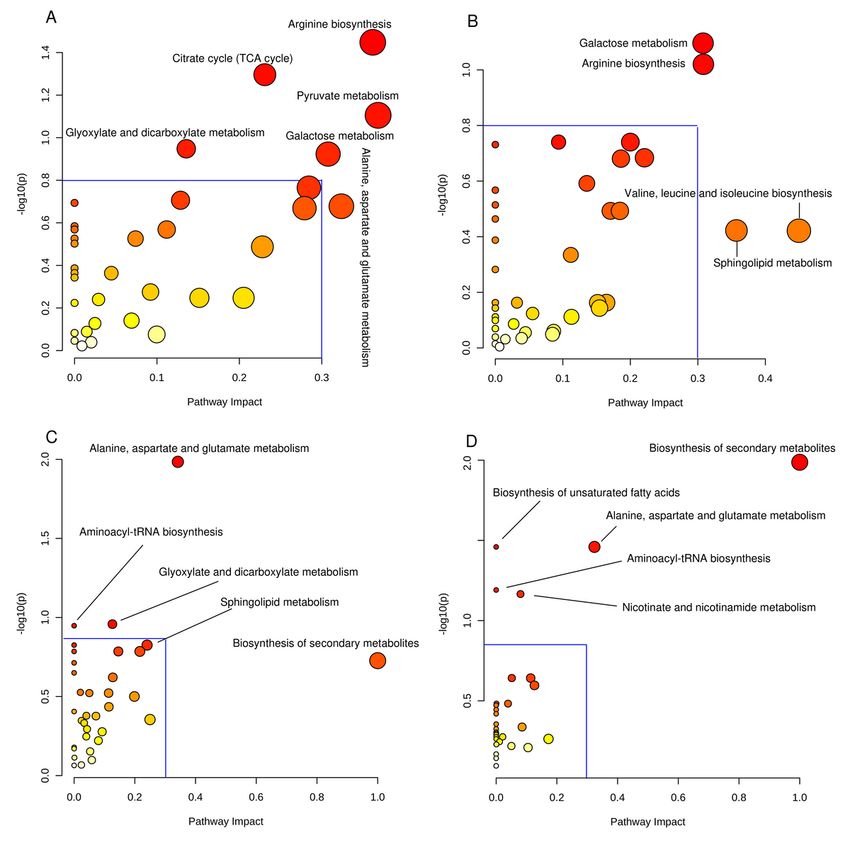
vacuum. The residues were dissolved in 200 µL of acetonitrile-methanol-water (2:2:1, v/v) and then
filtered through a 0.22 µm nylon membrane filter. A quality control (QC) sample was prepared by mixing
an equal volume (10 µL) of each sample, which was used for monitoring the stability of the instrument
system. Samples of 5 µL were subjected to instrument analysis, and the QC sample was injected once
every five sample detections.

Metabonomic studies were performed on a UPLC-Q-TOF/MS system (AB Triple TOF 6600, USA). The
chromatographic analysis was conducted on a UHPLC with a hydrophilic interaction liquid
chromatographic column (HILIC, 3.0 × 100 mm, 1.8 µm, Agilent Technologies, USA). The mobile phase
consisted of acetonitrile (A) and water-25 mM ammonium acetate-25 mM ammonia (B). The
chromatographic elution gradients were optimized at a flow rate of 0.3 mL min− 1 and with a running time
of 12 min: 0-0.5 min 95% A, 0.5-7.0 min 95 − 65% A, 7.0–8.0 min 65 − 40% A, 8.0–9.0 min 40% A, 9.0-9.1
min 40–95% A, and 9.1–12.0 min 95% A. The temperature of the autosampler system was set at 4°C, and
the column was set at 25°C. Samples were analyzed in parallel with both the positive electron spray
ionization (ESI+) and negative electron spray ionization (ESI-) modes. The TOF/MS scan m/z range was
60-1000 Da, and the product ion scan m/z range was 25-1000 Da. The TOF/MS was acquired with
information-dependent acquisition (IDA) in high sensitivity mode.

2.4. Data statistics
The original data were saved in mzXML format by ProteoWizard software. Chromatographic peak
extraction and alignment were conducted by SCIEX OS and XCMS software. The matrix data were
preprocessed by Pareto-scaling software. Principal component analysis (PCA), partial least-squares
discriminant analysis (PLS-DA), and orthogonal PLS-DA (OPLS-DA) were conducted by SIMCA-P V13.0
software. PCA was used to construct uncorrelated principal components (PCs) for observing the
intergroup differences in reduced data dimensionality. PLS-DA was used to construct a linear
discriminate model for discriminating samples with supervised classification modelling. OPLS-DA was
used to reflect the variations within groups and calculate the variable importance in the projection (VIP)
value for each metabolite. The model interpretation rates of PLS-DA and OPLS-DA were evaluated by
performing a 7-fold cross-validation analysis. The robustness and reliability of the OPLS-DA model were
determined by a replacement test with 200 permutations (Mahadevan, Shah, Marrie, & Slupsky, 2008).
Metabolites were identified by searching the spectrum of precursor ions and the corresponding product
ions against the self-built database. Metabolites obtained with the OPLS-DA VIP > 1 and Student’s t test p
< 0.05 were identified as different metabolites between samples. Kyoto Encyclopedia of Genes and
Genomes (KEGG, http://www.kegg.jp/) was performed on the different metabolites to evaluate the related
metabolic pathways (Kanehisa & Goto, 2000). Venn diagram analysis was performed by Mothur software
to identify the joint and specific metabolites between samples.

3. Results

                                                  Page 5/24
3.1. Sample metabolic profiles and analytical method
validation
By performing P. expansum inoculation, samples were successfully developed with typical blue mold
disease. After 10 d of incubation, the disease lesions from SA treatment samples were detected with
diameters ranging from 4.1 ± 1.4 cm, which were significantly less than those of the positive control
samples of 5.1 ± 1.2 cm (p = 0.034). The negative control samples were observed without disease. Then,
seven different samples, each with eight replicates, were prepared for the metabonomic study.
Representative total ion chromatograms (TICs) of samples from ESI + and ESI- modes are presented in
Figs. S1 and S2. Within the full running time of 12 min, major peaks were obtained with retention times
between 0.3 and 9.0 min. The TICs showed different shapes to reflect the significant changes in
metabolic profiles between samples. By performing peak extraction, samples were recorded with different
peak numbers (Table 1). Generally, P. expansum infection gradually increased the metabolic peak number
in the fruit tissues, which was recorded with the following range: NRP > MLP > HT, SANRP > SAMLP, and
MLPS > HTS. The SA treatment slightly increased the peak number of the related samples (SAMLP > MLP,
SANRP > NRP) but without significance. By performing peak alignment, comparable peaks between
samples from ESI + and ESI- modes were obtained to reflect the metabolite changes during P. expansum
infection.
Page 6/24Table 1
The number of peaks and metabolites identified in samples and the number
of different metabolites between samples. A: The chromatographic peaks of
the HT, MLP, NRP, and ORP samples. B: The intergroup comparison results
of the different peaks with the orthogonal partial least-squares discriminant
analysis (OPLS-DA) variable importance in projection (VIP) value > 1 and P
< 0.05, and the two tail Student’s t test p < 0.05. C: Peaks identified by
searching the database. D: Identified metabolites after removing the
repeats. HT, the healthy tissue of apple samples; HTS, HT from sterilized
samples; MLP, the margin of lesions of P. expansum-infected apples; MLPS,
MLP from sterilized samples; NRP, the newly generated rot tissues of P.
expansum-infected apples; SAMLP, MLP from SA treatment samples;
SANRP, NRP from SA treatment samples.
Peaks and metabolites Positive Negative Total
A: Peaks
HT 1396 ± 71.90 1476 ± 151.26 2872
MLP 1570 ± 100.89 1734 ± 96.12 3305
NRP 1822 ± 130.02 1870 ± 105.36 3692
HTS 1409 ± 60.65 1548 ± 63.62 2957
MLPS 1607 ± 60.09 1704 ± 85.38 3311
SAMLP 1604 ± 80.13 1776 ± 80.26 3379
SANRP 1912 ± 150.86 1920 ± 98.10 3832
Average 1617 1718 3335
B: Peaks VIP > 1 and P < 0.05
MLP/HT 620 409 1029
MLPS/HTS 433 274 707
NRP/MLP 701 616 1317
SANRP/SAMLP 822 678 1500
SAMLP/MLP 245 133 378
SANRP/NRP 361 178 539
C: Identified peaks
MLP/HT 206 100 306
MLPS/HTS 154 76 230
NRP/MLP 268 167 435
SANRP/SAMLP 291 189 480
Page 7/24Peaks and metabolites Positive Negative Total
SAMLP/MLP 50 23 73
SANRP/NRP 72 28 100
D: Identified metabolites
MLP/HT 140 87 182
MLPS/HTS 87 56 117
NRP/MLP 200 64 264
SANRP/SAMLP 195 80 275
SAMLP/MLP 36 12 48
SANRP/NRP 45 10 55
Total 330 142 472
The results of QC sample analysis were obtained to reflect the quality of sample detection. Generally, QC
parallel tests were obtained with repeatable TICs in both ESI + and ESI- modes (Fig. S1 and S2). Between
all QC samples, more than 70% peaks were obtained with repeatable signal responses (RSD value ≤
30%). The PCA plot clustered all QC samples together and separated them from other samples. Pearson
correlation analysis was conducted between the actual responses of remarked peaks and their logarithm
values, which were obtained with correlation coefficients higher than 0.96. These results showed
acceptable signal repeatability, which reflected the stability of the instrument analysis.
3.2. PCA, PLS-DA, and OPLS-DA
Principal component and discriminative analyses revealed the metabolic differences between samples.
PCA successfully reduced the data dimensionality by constructing uncorrelated PCs. The first five PCs
scored 45.4% and 45.5% of the total variances for the ESI + and ESI- modes, respectively. Based on the
score plots of the first two PCs, samples from the same group were generally clustered together and
separated from others (Fig. 1A and B). PLS-DA built a supervised model and obtained a general
discrimination between major samples (Fig. 1C and D). OPLS-DA obtained more satisfactory clustering
trends and showed significant changes in metabolic profiles between samples (Fig. 1E and F). However,
there were considerable overlaps between MLP and SAMLP samples (MLP/SAMLP) and NRP/SANRP,
which reflected the similar metabolic profiles of these samples. The OPLS-DA permutation tests
evaluated the robustness and reliability of OPLS-DA in ESI + and ESI- modes (Fig. S3). As represented by
the validation plots, both of the regression lines have negative intercepts, and the original points of the
intercept were all lower than their permuted R2 values, reflecting the robustness of the fitting models.
3.3. Intergroup metabolite comparison
Page 8/24The comparisons between samples were performed on chromatographic peaks and metabolites (Table
1). The number of aligned peaks is shown in Table 1A. The significantly different peaks that scored with
VIP > 1.0 in OPLS-DA between groups and p < 0.05 in Student's t test are shown in Table 1B. By
performing the database search, the identified peaks/metabolites are shown in Table 1C. After combining
repeated metabolites, the different metabolites between groups are shown in Table 1D. Finally, a total of
472 different metabolites were identified, and their retention time, molecular weight, chemical formula,
and fold changes between groups are presented in Table S1. These metabolites were further divided into
categories including amino acids, sugars and alcohols, organic acids, nucleotides, lipids, peptides,
phenolics, and their derivatives.
Intergroup comparisons were conducted to reveal the metabolite changes related to P. expansum
infection and SA-mediated disease resistance. The different metabolites were clustered into common
pathways in KEGG analysis, such as amino acid metabolism, carbohydrate metabolism, cofactor and
vitamin metabolism, and lipid metabolism, which were regarded as the background of metabolic
processes for P. expansum infection of apples. In addition, the different metabolites between specific
groups were clustered into distinctive pathways, which reflected the different biological processes for
fungal infection and disease resistance. Specifically, the different metabolites between MLP/HT reflected
the metabolic changes related to the natural host-pathogen interaction (Fig. 2). The different metabolites
between MLPS/HTS reflected the metabolic changes related to P. expansum invasion but without apple
resistance (Fig. S4). The different metabolites between NRP/MLP reflected the metabolic changes related
to the stage of P. expansum proliferation (Fig. S5). The different metabolites between SAMLP/MLP,
SANRP/NRP, and SANRP/SAMLP reflected the metabolic changes related to the SA-mediated metabolic
responses of apples for disease resistance (Fig. S6).
3.4. Metabolic changes related to P. expansum invasion and
proliferation
3.4.1. Metabolic changes related to P. expansum invasion
The different metabolites between MLPS/HTS were related to the metabolic changes for P. expansum
invasion. A total of 115 different metabolites were identified (Table S1). These metabolites included 9
amino acids, 9 fatty acids, 14 other nitrogen-containing metabolites, 8 nucleotides, 18 organic acids, 18
peptides, 20 phenolics or secondary metabolites, 17 sugars or alcohols, and 2 terpenoids (Fig. S4).
Seventy-seven different metabolites were increased in MLPS, mainly including major fatty acids (8 in 9,
8/9), nitrogen-containing metabolites (10/14), organic acids (15/18), peptides (13/18), phenolics and
secondary metabolites (13/20), and sugars and alcohols (15/17). Thirty-eight metabolites were
decreased in MLPS, mainly including major amino acids (8/9) and nucleotides (6/8).
KEGG analysis was performed on the different metabolites between MLPS/HTS to reflect the change in
metabolic pathways related to P. expansum invasion. Overall, 65 different metabolites were annotated
into 142 individual pathway modules within 78 metabolic pathways in the KEGG database. A total of 20
Page 9/24pathways contained more than 2 metabolites, which represented the main disturbed metabolic pathways
(Fig. 3A). Thirty-six metabolites were clustered into common pathways, including amino acid metabolism,
carbohydrate metabolism, cofactor and vitamin metabolism, and lipid metabolism. In addition, 26
metabolites were clustered into specific pathways, mainly branched-chain amino acid metabolism,
carbon fixation, and cysteine and methionine metabolism, which reflected the distinctive biological
processes related to P. expansum invasion. By performing the enrichment analysis, the main changed
metabolic pathways were arginine biosynthesis, tricarboxylic acid cycle (TCA cycle), pyruvate
metabolism, glyoxylate and dicarboxylate metabolism, and galactose metabolism (Fig. 4A). The
metabolites clustered into the TCA cycle, pyruvate metabolism, and galactose metabolism were
significantly upregulated in MLPS. However, in the arginine biosynthesis pathway, the clustered
metabolites were significantly decreased in MLPS, such as glutamic acid, N2-acetyl-L-ornithine, L-
citrulline, and L-arginine, which reflected the downregulation of arginine biosynthesis. These metabolic
pathways reflected the biological processes of P. expansum invasion.
3.4.2. Metabolic changes related to P. expansum
proliferation
The different metabolites between MLP/NRP reflected the metabolic changes related to the stage of P.
expansum proliferation. There were 264 different metabolites between NRP/MLP (Table S1). To identify
the core metabolites, the comparison between SANRP/SAMLP served as a test that paralleled NRP/MLP.
There were 275 different metabolites between SANRP/SAMLP (Table S1). The Venn diagram analysis
obtained a total of 211 joint metabolites between SANRP/SAMLP and NRP/MLP. Among them, 210
different metabolites shared identical increasing or decreasing trends in NRP/MLP and SANRP/SAMLP,
reflecting the credibility of the different metabolites. These metabolites represented the metabolic
processes related to P. expansum proliferation, and the changes in relative abundance between MLP and
NRP samples are shown in Fig. S5.
By performing the KEGG analysis, a total of 93 different metabolites were annotated into 166 detailed
pathway modules within 82 metabolic pathways. Among them, 57 metabolites were clustered into
common pathways (Fig. 3B). In addition, 39 metabolites were clustered into specific pathways, such as
central carbohydrate metabolism, aromatic amino acid metabolism, and branched-chain amino acid
metabolism, which reflected the distinctive biological processes of P. expansum proliferation. By
performing the enrichment analysis, the main changed metabolic pathways included galactose
metabolism, arginine biosynthesis, alanine, aspartate and glutamate metabolism, starch and sucrose
metabolism, and sphingolipid metabolism (Fig. 4B). Specifically, metabolites clustered in starch and
sucrose metabolism, galactose metabolism, and sphingolipid metabolism were significantly increased,
indicating the upregulation of these metabolic pathways. These altered metabolic pathways reflected the
different biological stages of apple P. expansum proliferation.
3.4.3. Metabolic pathways for P. expansum infection
Page 10/24Based on the different metabolites and KEGG analysis, the putative metabolic pathways for P. expansum
infection are summarized in Fig. 5A. The upregulation of starch and sucrose metabolism reflected fungal
invasion, which also provided precursors for the TCA cycle and further elevated the pyruvate level. The
TCA cycle and glycerophospholipid metabolism were also promoted in both stages. The changes in
amino acid metabolism were diverse, which was reflected by the downregulation of arginine biosynthesis
and the upregulation of alanine, aspartate, and glutamate metabolism. Glyoxylate and dicarboxylate
metabolism and carbapenem biosynthesis were upregulated for fungal secondary metabolism. These
pathways were prominent for P. expansum invasion and proliferation.
3.5. Metabolic changes related to SA-mediated apple
disease resistance
3.5.1. Metabolic changes related to apple natural defense
The different metabolites between MLP/HT reflected the metabolic changes related to apple disease
resistance under natural conditions, which included 179 different metabolites (Table S1). To identify the
metabolites related to disease resistance, MLPS/HTS served as an unresponsive control. Venn analysis
revealed the joint and specific metabolites between MLP/HT and MLPS/HTS. Excluding 60 joint
metabolites, 119 different metabolites were only identified in MLP/HT, which reflected the metabolic
responses for fruit disease resistance (Fig. 2). Specifically, 81 different metabolites increased in
abundance in MLP, including major fatty acids (25/29), phenolics and secondary metabolites (27/34),
and terpenoids (5/6). The amino acid and its derivatives (5/7) were mainly decreased in abundance. The
changes in nitrogen-containing metabolites, organic acids, sugars and alcohols, peptides and nucleotides
were diverse. These different metabolites in MLP samples reflected the apple metabolic responses for
disease resistance.
In KEGG analysis, a total of 59 metabolites were annotated into 123 detailed pathway modules within 71
metabolic pathways. Among them, 44 metabolites were clustered into common pathways. In addition, 15
metabolites were clustered into specific pathway modules, such as biosynthesis of phytochemical
compounds, cysteine and methionine metabolism, and fatty acid metabolism (Fig. 3C). By performing the
enrichment analysis, the significant pathways mainly included the upregulation of sphingolipid
metabolism, glyoxylate and dicarboxylate metabolism, and biosynthesis of secondary metabolites (Fig.
4C). Alanine, aspartate and glutamate metabolism, and aminoacyl-tRNA biosynthesis were mainly
downregulated. These changed metabolic pathways reflected the biological processes related to natural
apple disease resistance.
3.5.2. Metabolic changes related to SA-mediated apple
disease resistance
The SA-mediated apple metabolic responses against P. expansum infection were reflected by the different
metabolites between SAMLP/MLP and SANRP/NRP (Fig. S6). Comparisons between SAMLP/MLP and
SANRP/NRP obtained 27 and 34 different metabolites, respectively. Additionally, the different metabolites
Page 11/24between SANRP/SAMLP and NRP/MLP also reflected the function of SA. Excluding the joint metabolites
between NRP/MLP and SANRP/SAMLP, 64 different metabolites were only identified in SANRP/SAMLP.
After combining the repeated metabolites, 98 different metabolites were identified to represent the SA-
mediated metabolic responses. These metabolites included 8 amino acids, 13 fatty acids, 8 nitrogen-
containing metabolites, 4 nucleotides, 12 organic acids, 19 peptides, 23 phenolics and secondary
metabolites, 7 sugars and alcohols, and 4 terpenoids (Fig. S6). Most of these metabolites were increased
in SA-treated samples.
In KEGG analysis, a total of 47 metabolites were annotated into 124 detailed pathway modules within 71
metabolic pathways. Forty metabolites were clustered into common metabolic pathways (Fig. 3D). In
addition, 23 metabolites were clustered into specific pathway modules, mainly aromatic amino acid
metabolism, biosynthesis of phytochemical compounds, and fatty acid elongation. By performing the
enrichment analysis, the changed pathways mainly contained the biosynthesis of secondary metabolites,
the biosynthesis of unsaturated fatty acids, alanine, aspartate and glutamate metabolism, aminoacyl-
tRNA biosynthesis, and nicotinate and nicotinamide metabolism (Fig. 4D). Specifically, the metabolites
clustered into the biosynthesis of secondary metabolites and unsaturated fatty acids, alanine, aspartate
and glutamate metabolism, and nicotinate and nicotinamide metabolism were upregulated in SA-treated
samples. These changed metabolic pathways reflected the biological process of SA-mediated apple
disease resistance.
3.5.3. Metabolic pathways for SA-promoted apple disease
resistance
Based on the different metabolites and KEGG analysis, the putative metabolic pathways for apple
disease resistance and the SA functions are summarized in Fig. 5B. The main metabolic pathways for
disease resistance included the upregulation of the TCA cycle, amino acid metabolism, fatty acid
metabolism, polyphenol metabolism, and reactive oxygen metabolism. The upregulation of fatty acid
metabolism included several branches, such as cutin, suberin and wax biosynthesis, fatty acid
biosynthesis, biosynthesis of unsaturated fatty acids, and sphingolipid metabolism. The upregulation of
amino acid metabolism provided precursors for polyphenol metabolism. The upregulation of polyphenol
metabolism was mainly reflected by the increase in 4-coumarate, catechin, and epicatechin. SA promoted
multiple metabolic pathways for apple disease resistance. Additionally, the levels of jasmonic acid and
all cis-(6, 9, 12)-linolenic acid were increased in the SA treatment samples. SA further promoted reactive
oxygen metabolism, which was reflected by the increase in ascorbic acid, glutamate, and nicotinamide D-
ribonucleotide. SA downregulated galactose metabolism and alleviated fruit cell wall degradation. These
pathways were prominent for SA-promoted apple disease resistance.
4. Discussion
Blue mold caused by P. expansum infection is the main postharvest disease in apples, resulting in huge
economic losses to the Chinese apple industry (Li et al., 2020). SA is an effective defensive regulator that
Page 12/24protects fruits against fungal infection (Fu et al., 2013; Jiang et al., 2022). The metabonomic
investigation of SA-mediated apple resistance to P. expansum infection is essential for discovering the
metabolic pathology and exploring new strategies for postharvest disease prevention. In our study, SA
significantly inhibited the rate of P. expansum invasion, which coincides with previous studies (da Rocha
Neto et al., 2016; Mo et al., 2008). The metabolic profiles of the samples were successfully obtained by
performing UPLC-Q-TOF/MS analysis. Thousands of chromatographic peaks were obtained from each
sample, showing the sufficient throughput of the instrument analysis. PCA and correlation analysis of the
QC samples reflected the repeatability of the retention time and signal intensity, which indicated the
stability of the analytical methods (Dunn, Bailey, & Johnson, 2005). Therefore, this metabonomic
investigation was successfully applied to obtain metabolic profiles with high accuracy and efficiency.
The metabolite differences between samples were revealed by principal component and discriminative
analysis. As shown in Fig. 1A and B, PCA recognized the different metabolic profiles between samples in
reduced data dimensions (McMurdie & Holmes, 2013). Both PLS-DA and OPLS-DA obtained satisfactory
sample discrimination (Fig. 1C and D), which indicated the inherent metabolic differences between
samples (Gurdeniz & Ozen, 2009). These metabolic changes between samples were related to the
processes of the apple and P. expansum interaction (Žebeljan, Vico, Duduk, Žiberna, & Urbanek, 2019).
Considerable overlaps existed between MLP/SAMLP and NRP/SANRP in both the PLS-DA and OPLS-DA
models, which indicated that the metabolite differences between SA-treated samples were relatively slight
when compared with the metabolic responses related to fungal infection. In total, 472 different
metabolites were identified to represent the metabolite changes related to P. expansum infection and SA-
mediated disease resistance.
Different metabolites between MLPS/HTS were related to the metabolic pathways for P. expansum
invasion (Fig. S4). Based on KEGG analysis, these different metabolites reflected the changes in common
metabolic pathways, mainly amino acid metabolism, carbohydrate metabolism, cofactor and vitamin
metabolism, and lipid metabolism (Fig. 4A). The changes in amino acid metabolism were diverse,
predominantly the downregulation of arginine biosynthesis. In addition, major amino acids and
nucleotides were decreased in MLPS, indicating amino acid consumption for fungal proliferation (Barad
et al., 2015). The TCA cycle and pyruvate metabolism were upregulated, which reflected carbohydrate
metabolism for energy supplementation (Wang et al., 2019). Several sugars and alcohols were increased
in MLPS, indicating the decomposition of fruit tissues by degrading enzymes from P. expansum invasion
(Qin, Tian, Chan, & Li, 2007; Wang et al., 2019). Major organic acids and nitrogen-containing metabolites
were increased in MLPS, indicating the secretion of these substances from invasive P. expansum (Barad,
Espeso, Sherman, & Prusky, 2015; Zong, Li, & Tian, 2015).
Different metabolites between NRP/MLP reflected the metabolic pathways related to P. expansum
proliferation. The different metabolites between NRP/MLP were similar to those between MLPS/HTS
(Fig. S5), which indicated continuous metabolic changes related to P. expansum infection (Shen et al.,
2021). The metabolism of alanine, aspartate, and glutamate was upregulated in NRP (Fig. 4B), indicating
the supplementation of amino acids from the decomposition of fruit tissues. Galactose metabolism and
Page 13/24starch and sucrose metabolism were upregulated, which were related to the degradation of fruit cell walls
(Qin et al., 2007; Wang et al., 2019). In addition, major sugars were decreased in NRP, reflecting
carbohydrate consumption for fungal proliferation (Romanazzi et al., 2016). The upregulation of
glycerophospholipid metabolism might be related to fungal membrane biosynthesis (Qin et al., 2007).
The upregulation of glyoxylate and dicarboxylate metabolism and carbapenem biosynthesis was related
to the fungal biosynthesis of virulence factors (Barad, Horowitz, Kobiler, Sherman, & Prusky, 2014) and
secondary metabolites (Tannous et al., 2018). As summarized in Fig. 5A, these metabolic pathways were
predominant for P. expansum infection.
Different metabolites between MLP/HT reflected the changed metabolic pathways related to natural
apple disease resistance. The pathway of secondary metabolite biosynthesis was upregulated, and major
phenolics and secondary metabolites increased their abundance during infection. These metabolites
exhibit antifungal activities, which are important for the regulation of disease resistance (Jiao, Li, Wang,
Cao, & Jiang, 2018; Romanazzi et al., 2016). The upregulation of glyoxylate and dicarboxylate
metabolism and the TCA cycle was related to the promotion of carbohydrate metabolism, which is
important for energy and precursor supplementation for overall metabolic regulation (Wang et al., 2019).
The biosynthesis of lipids and fatty acids and sphingolipid metabolism were upregulated, indicating wax
biosynthesis for disease resistance (Gong et al., 2019). These specific pathways reflected the natural
metabolic responses for apple disease resistance.
Different metabolites between SA-treated and control samples reflected the metabolic responses for SA-
mediated disease resistance. Specifically, the biosynthesis of secondary metabolites was significantly
upregulated in the SA-treated groups, which was predominantly due to the biosynthesis of phenolics,
such as epicatechin, coumarate, and catechin. Additionally, SA promoted aromatic amino acid
metabolism, which provides precursors for polyphenol metabolism (Jin et al., 2019). The biosynthesis of
unsaturated fatty acids was significantly upregulated in the SA-treated groups. Specifically, long-chain
fatty acids are components of wax on fruit peel, which are important to protect the fruit against water
evaporation (Chen et al., 2020; Shen et al., 2021). The upregulation of jasmonic acid in SA treated groups
might be important for SA-mediated signaling pathways and induced resistance (Robert-Seilaniantz,
Grant, & Jones, 2011). The upregulation of reactive oxygen metabolism could be related to the
detoxification effect to reduce active oxygen in the fruit cells (Wang et al., 2019). The downregulation of
galactose decomposition in SA-treated samples was related to the reduction in fruit cell wall degradation.
As summarized in Fig. 5B, these metabolic pathways were related to the SA-promoted apple metabolic
responses against P. expansum infection.
5. Conclusion
The present study evaluated the metabolic responses of P. expansum infection of apple and SA-induced
disease resistance. A metabonomic analysis based on UPLC-Q-TOF/MS was performed to determine the
changes in metabolites and pathways related to P. expansum infection and SA-mediated disease
resistance. A total of 472 different metabolites were identified between samples. Metabolic pathways
Page 14/24related to P. expansum invasion mainly included the upregulation of the TCA cycle, galactose
metabolism, and starch and sucrose metabolism. The changes in amino acid metabolism were diverse
and dominated by the downregulation of arginine biosynthesis and the upregulation of alanine,
aspartate, and glutamate metabolism. The upregulation of glyoxylate and dicarboxylate metabolism and
carbapenem biosynthesis was associated with the fungal biosynthesis of virulence factors and
secondary metabolites. Metabolic pathways related to apple natural disease resistance mainly included
the upregulation of secondary metabolite biosynthesis and sphingolipid metabolism. The upregulation of
the TCA cycle reflected carbohydrate and energy supplements for disease resistance. SA promoted
multiple metabolic pathways for apple disease resistance, especially the biosynthesis of secondary
metabolites, unsaturated fatty acids, and aromatic amino acids. In addition, the TCA cycle, reactive
oxygen metabolism and galactose decomposition were changed by SA treatment. To confirm these
pathways, further studies of pathway validation should be explored. This study improved the
pathological understanding of P. expansum infection of apples and SA-promoted disease resistance.
Declarations
The authors declare no competing interests.
Author Contribution
Youming Shen: conceptualization, methodology, and supervision. Jianyi Zhang: methodology, data
curation, and writing. Ning Ma: methodology, writing and editing. Lixue Kuang: methodology and data
curation. Guofeng Xu: conceptualization and editing. Zhiyuan Li: methodology and data curation.
Funding
This work was supported by the Youth Innovation Program of Chinese Academy of Agricultural Sciences
(Y2023QC26) and the Agricultural Science and Technology Innovation Program (CAAS-ASTIP).
References
1. Ahmadi-Afzadi, M., Nybom, H., Ekholm, A., Tahir, I., & Rumpunen, K. (2015). Biochemical contents of
apple peel and flesh affect level of partial resistance to blue mold. Postharvest Biology and
Technology, 110, 173-182. https://doi: 10.1016/j.postharvbio.2015.08.008
2. Backer, R., Naidoo, S., & van den Berg, N. (2019). The nonexpressor of pathogenesis-related genes 1
(NPR1) and related family: mechanistic insights in plant disease resistance. Frontiers in Plant
Science, 10. https://doi: 10.3389/fpls.2019.00102
3. Barad, S., Espeso, E., Sherman, A., & Prusky, D. (2015). Ammonia activates pacC and patulin
accumulation in acidic environment during apple colonization by Penicillium expansum. Molecular
Plant Pathology, 17. https://doi: 10.1111/mpp.12327
Page 15/244. Barad, S., Horowitz, S.B., Kobiler, I., Sherman, A., & Prusky, D. (2014). Accumulation of the mycotoxin
patulin in the presence of gluconic acid contributes to pathogenicity of Penicillium expansum.
Molecular Plant-Microbe Interactions, 27(1), 66-77. https://doi: 10.1094/MPMI-05-13-0138-R
5. Cai, J.Y., Xiong, J.J., Hong, Y., & Hu, R.F. (2021). Pesticide overuse in apple production and its
socioeconomic determinants: evidence from Shaanxi and Shandong provinces, China. Journal of
Cleaner Production, 315, 128179. https://doi: 10.1016/j.jclepro.2021.128179
6. Chen, J., Zhang, J.Y., Kong, M.M., Freeman, A., Chen, H., & Liu, F.Q. (2021). More stories to tell:
nonexpressor of pathogenesis-related genes 1, a salicylic acid receptor. Plant Cell and Environment,
44(6), 1716-1727. https://doi: 10.1111/pce.14003
7. Chen, L., Zhao, X., Wu, J.E., He, Y., & Yang, H. (2020). Metabolic analysis of salicylic acid-induced
chilling tolerance of banana using NMR. Food Research International, 128, 108796. https://doi:
10.1016/j.foodres.2019.108796
8. da Rocha Neto, A.C., Luiz, C., Maraschin, M., & Di Piero, R.M. (2016). Efficacy of salicylic acid to
reduce Penicillium expansum inoculum and preserve apple fruits. International Journal of Food
Microbiology, 221, 54-60. https://doi: 10.1016/j.ijfoodmicro.2016.01.007
9. Dunn, W.B., Bailey, N.J.C., & Johnson, H.E. (2005). Measuring the metabolome: current analytical
technologies. Analyst, 130(5), 606-625. https://oi: 10.1039/b418288j
10. Fu, Z.Q., & Dong, X.N. (2013). Systemic acquired resistance: turning local infection into global
defense. In S. S. Merchant (Ed.), Annual Review of Plant Biology, 64, 839-863.
https://doi.org/10.1146/annurev-arplant-042811-105606
11. Golding, J.B., McGlasson, W.B., Wyllie, S.G., & Leach, D.N. (2001). Fate of apple peel phenolics during
cool storage. Journal of Agricultural and Food Chemistry, 49(5), 2283-2289. https://doi:
10.1021/jf0015266
12. Gong, C.S, Diao, W.N., Zhu, H. J., Umer, M.J., Zhao, S.J., He, N., et al. (2021). Metabolome and
transcriptome integration reveals insights into flavor formation of 'Crimson' watermelon flesh during
fruit development. Frontiers in Plant Science, 12, 629361. https://doi: 10.3389/fpls.2021.629361
13. Gong, D., Bi, Y., Jiang, H., Xue, S.L., Wang, Z.Y., Li, Y.C., Zong, Y.Y., Prusky, D. (2019). A comparison of
postharvest physiology, quality and volatile compounds of 'Fuji' and 'Delicious' apples inoculated
with Penicillium expansum. Postharvest Biology and Technology, 150, 95-104. https://doi:
10.1016/j.postharvbio.2018.12.018
14. Gurdeniz, G., & Ozen, B. (2009). Detection of adulteration of extra-virgin olive oil by chemometric
analysis of mid-infrared spectral data. Food Chemistry, 116(2), 519-525. https://doi:
10.1016/j.foodchem.2009.02.068
15. Jiang, B., Liu, R.L., Fang, X.J., Tong, C., Chen, H.J., & Gao, H.Y. (2022). Effects of salicylic acid
treatment on fruit quality and wax composition of blueberry (Vaccinium virgatum Ait). Food
Chemistry, 368. https://doi: 10.1016/j.foodchem.2021.130757
16. Jiao, W.X., Li, X.X., Wang, X.M., Cao, J.K., & Jiang, W.B. (2018). Chlorogenic acid induces resistance
against Penicillium expansum in peach fruit by activating the salicylic acid signaling pathway. Food
Page 16/24Chemistry, 260, 274-282. https://doi: 10.1016/j.foodchem.2018.04.010
17. Jin, L.F., Cai, Y.T., Sun, C., Huang, Y.N., Yu, T., (2019). Exogenous L-glutamate treatment could induce
resistance against Penicillium expansum in pear fruit by activating defense-related proteins and
amino acids metabolism. Postharvest Biology and Technology, 150, 148-157. https://doi:
10.1016/j.postharvbio.2018.11.009
18. Kanehisa, M., & Goto, S. (2000). KEGG: Kyoto Encyclopedia of Genes and Genomes. Nucleic Acids
Research, 28(1), 27-30. https://doi: 10.1093/nar/28.1.27
19. Li, B.Q., Chen, Y., Zhang, Z.Q., Qin, G.Z., Chen, T., & Tian, S.P. (2020). Molecular basis and regulation of
pathogenicity and patulin biosynthesis in Penicillium expansum. Comprehensive Reviews in Food
Science and Food Safety, 19(6), 3416-3438. https://doi: 10.1111/1541-4337.12612
20. Mahadevan, S., Shah, S.L., Marrie, T.J., & Slupsky, C.M. (2008). Analysis of metabolomic data using
support vector machines. Analytical Chemistry, 80(19), 7562-7570. https://doi: 10.1021/ac800954c
21. Matthes, A., & Schmitz-Eiberger, M. (2009). Polyphenol content and antioxidant capacity of apple
fruit: effect of cultivar and storage conditions. Journal of Applied Botany and Food Quality, 82(2),
152-157
22. McMurdie, P.J., & Holmes, S. (2013). Phyloseq: an R pckage for reproducible interactive analysis and
graphics of microbiome census data. Plos One, 8(4). https://doi: 10.1371/journal.pone.0061217
23. Mo, Y.W., Gong, D.Q., Liang, G.B., Han, R.H., Xie, J.H., & Li, W.C. (2008). Enhanced preservation effects
of sugar apple fruits by salicylic acid treatment during post-harvest storage. Journal of the Science
of Food and Agriculture, 88(15), 2693-2699. https://doi: https://doi.org/10.1002/jsfa.3395
24. Mueller, G., Bills, G., & Foster, M. (2004). Biodiversity of fungi: inventory and monitoring methods.
Elsevier Academic Press, Burlington, MA, 121-127. https://doi.org/10.1016/B978-0-12-509551-
8.X5000-4
25. Oms-Oliu, G., Odriozola-Serrano, I., & Martin-Belloso, O. (2013). Metabolomics for assessing safety
and quality of plant-derived food. Food Research International, 54(1), 1172-1183. https://doi:
10.1016/j.foodres.2013.04.005
26. Pokotylo, I., Kravets, V., & Ruelland, E. (2019). Salicylic acid binding proteins (sabps): the hidden
forefront of salicylic acid signalling. International Journal of Molecular Sciences, 20(18). https://doi:
10.3390/ijms20184377
27. Qin, G.Z., Tian, S.P., Chan, Z.L., & Li, B.Q. (2007). Crucial role of antioxidant proteins and hydrolytic
enzymes in pathogenicity of Penicillium expansum-analysis based on proteomics approach.
Molecular & Cellular Proteomics, 6(3), 425-438. https://doi: 10.1074/mcp.M600179-MCP200
28. Qin, Y.L., Zhang, S.B., Lv, Y.Y., Zhai, H.C., Hu, Y.S., & Cai, J.P. (2022). The antifungal mechanisms of
plant volatile compound 1-octanol against Aspergillus flavus growth. Applied Microbiology and
Biotechnology, 106, 5179-5196. https://doi.org/10.1007/s00253-022-12049-z
29. Robert-Seilaniantz, A., Grant, M., & Jones, J.D.G. (2011). Hormone crosstalk in plant disease and
defense: more than just jasmonate-salicylate antagonism, In: VanAlfen, N.K., Bruening, G., Leach, J.E.
(Eds.), Annu. Rev. Phytopathol. 49, 317-343. https://doi.org/10.1146/annurev-phyto-073009-114447
Page 17/2430. Romanazzi, G., Sanzani, S.M., Bi, Y., Tian, S., Gutierrez Martinez, P., & Alkan, N. (2016). Induced
resistance to control postharvest decay of fruit and vegetables. Postharvest Biology and Technology,
122, 82-94. https://doi: 10.1016/j.postharvbio.2016.08.003
31. Shen, Y.M., Liu, M.Y., Nie, J.Y., Ma, N., Xu, G.F., Zhang, J.Y., et al. (2021). Metabolite changes of apple
Penicillium expansum infection based on a UPLC-Q-TOF metabonomics approach. Postharvest
Biology and Technology, 181, 111646. https://doi: 10.1016/j.postharvbio.2021.111646
32. Tannous, J., Keller, N.P., Atoui, A., El Khoury, A., Lteif, R., Oswald, I.P., et al. (2018). Secondary
metabolism in Penicillium expansum: emphasis on recent advances in patulin research. Critical
Reviews in Food Science and Nutrition, 58(12), 2082-2098. https://doi:
10.1080/10408398.2017.1305945
33. Wang, K.L., Zheng, X.F., Zhang, X.Y., Zhao, L.N., Yang, Q.Y., Boateng, N.A.S., et al. (2019). Comparative
transcriptomic analysis of the interaction between Penicillium expansum and apple fruit (Malus
pumila Mill.) during early stages of infection. Microorganisms, 7(11), 495. https://doi:
10.3390/microorganisms7110495
34. Wang, Y., Ji, D.C., Chen, T., Li, B.Q., Zhang, Z.Q., Qin, G.Z., et al. (2019). Production, signaling, and
scavenging mechanisms of reactive oxygen species in fruit-pathogen interactions. International
Journal of Molecular Sciences, 20(12), 2294. https://doi: 10.3390/ijms20122994.
35. Welke, J.E. (2019). Fungal and mycotoxin problems in grape juice and wine industries. Current
Opinion in Food Science, 29, 7-13. https://doi: 10.1016/j.cofs.2019.06.009
36. Xu, J.D., Yan, J.J., Li, W.J., Wang, Q.Y., Wang, C.X., Guo, J.X., et al. (2020). Integrative analyses of
widely targeted metabolic profiling and transcriptome data reveals molecular insight into
metabolomic variations during apple (Malus domestica) fruit development and ripening.
International Journal of Molecular Sciences, 21(13), 4797. https://doi: 10.3390/ijms21134797
37. Yang, Q.Y., Qian, X., Routledge, M.N., Wu, X.Y., Shi, Y., Zhu, Q.G., et al. (2021). Metabonomics analysis
of postharvest citrus response to Penicillium digitatum infection. Lwt-Food Science and Technology,
152, 112371. https://doi: 10.1016/j.lwt.2021.112371
38. Žebeljan, A., Vico, I., Duduk, N., Žiberna, B., & Urbanek Krajnc, A. (2019). Dynamic changes in
common metabolites and antioxidants during Penicillium expansum-apple fruit interactions.
Physiological and Molecular Plant Pathology, 106, 166-174. https://doi:
https://doi.org/10.1016/j.pmpp.2019.02.001
39. Zhang, J.Y., Nie, J.Y., Zhang, L.B., Xu, G.F., Zheng, H.D., Shen, Y.M., et al. (2021). Multielement
authentication of apples from the cold highlands in southwest China. Journal of the Science of Food
and Agriculture, 102, 241-249. https://doi: 10.1002/jsfa.11351
40. Zong, Y.Y., Li, B.Q., & Tian, S.P. (2015). Effects of carbon, nitrogen and ambient pH on patulin
production and related gene expression in Penicillium expansum. International Journal of Food
Microbiology, 206, 102-108. https://doi: 10.1016/j.ijfoodmicro.2015.05.007
Figures
Page 18/24Figure 1
Dimensional plots of the metabonomicprofiles in apple samples of P. expansuminfection investigated
inPCA (A: ESI+ mode, B: ESI- mode), PLS-DA (C: ESI+ mode, D: ESI- mode), and OPLS-DA (E: ESI+ mode, F:
ESI- mode) showing the grouping of the HT, HTS, MLP, MLPS, NRP, SAMLP and SANRP samples. HT, the
healthy tissue of apple samples; HTS, HT from sterilized samples; MLP, the margin of lesions of P.
expansum-infected apples; MLPS, MLP from sterilized samples; NRP, the newly generated rot tissues of P.
Page 19/24expansum-infected apples; SAMLP, MLP from SA treatment samples; SANRP, NRP from SA treatment
samples.
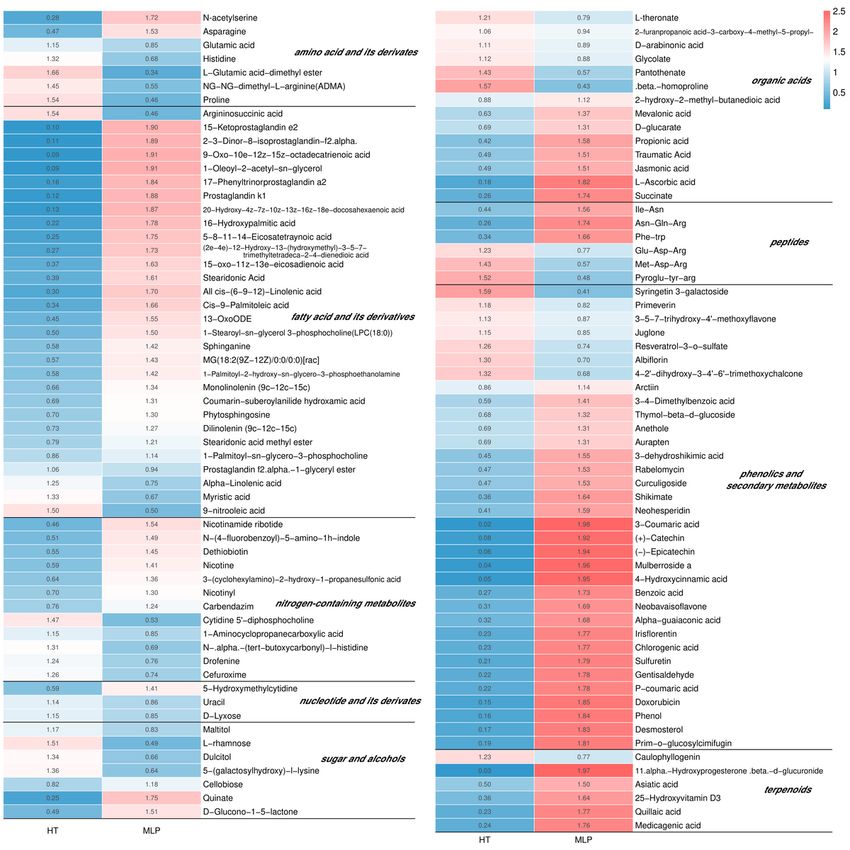
Figure 2
The different metabolites between MLP and HT reflected the metabolite changes for natural apple
disease resistance. MLP, the margin of lesions of P. expansum-infected apples; HT, the healthy tissue of
apple samples.
Page 20/24Figure 3
The results of KEGG analysis of different metabolites reflected the change in metabolic pathways related
to P. expansum invasion (A), P. expansum proliferation (B), apple natural disease resistance (C) and SA-
mediated disease resistance (D). There are eight common pathways represented by different background
colors. The node area size represents the percentage of the representative metabolic pathway. The others
contained specific pathways with more than 2 hits.
Page 21/24Figure 4
The results of KEGG analysis on different metabolites reflected the change in metabolic pathways
between samples. Changes in metabolic pathways related to P. expansum invasion (A), P. expansum
proliferation (B), apple natural disease resistance (C) and SA mediated disease resistance (D).
Page 22/24Figure 5
Summarization of metabolic pathways for P. expansuminfection and SA-promoted responses for disease
resistance. A: Summarization of biological pathways for P. expansuminvasion and proliferation.
Metabolites colored green represent P. expansum invasion, and those colored red represent the changes
in metabolites in the stage of proliferation. B: Summarization of biological pathways for apple P.
Page 23/24expansum resistance and SA-mediated metabolic responses. Metabolites colored green represent the
changes under natural conditions and those colored red represent the changes under SA treatment.
Supplementary Files
This is a list of supplementary files associated with this preprint. Click to download.
Supplementarymaterials.docx
Page 24/24You can also read