Robust Attack Graph Generation
←
→
Page content transcription
If your browser does not render page correctly, please read the page content below
Proceedings of Machine Learning Research 1–11, 2022                                          LearnAut

                                                                 Robust Attack Graph Generation

                                         Dennis Mouwen                                                   D.Mouwen@student.tudelft.nl
                                         Sicco Verwer                                                          S.E.Verwer@tudelft.nl
                                         Azqa Nadeem                                                          azqa.nadeem@tudelft.nl
                                         Delft University of Technology
arXiv:2206.07776v1 [cs.LG] 15 Jun 2022

                                                                                         Abstract
                                              We present a method to learn automaton models that are more robust to input modifica-
                                              tions. It iteratively aligns sequences to a learned model, modifies the sequences to their
                                              aligned versions, and re-learns the model. Automaton learning algorithms are typically
                                              very good at modeling the frequent behavior of a software system. Our solution can be
                                              used to also learn the behavior present in infrequent sequences, as these will be aligned to
                                              the frequent ones represented by the model. We apply our method to the SAGE tool for
                                              modeling attacker behavior from intrusion alerts. In experiments, we demonstrate that our
                                              algorithm learns models that can handle noise such as added and removed symbols from
                                              sequences. Furthermore, it learns more concise models that fit better to the training data.
                                              Keywords: automaton learning, sequence alignment, attacker modeling

                                         1. Introduction
                                         Most organizations and companies use an Intrusion Detection System (IDS) as the first
                                         line of defense against cyber attacks. The biggest limitation of these systems is the huge
                                         amount of alerts they generate. Alert Correlation techniques are used to reduce and group
                                         alerts belonging to the same attack stage (Alserhani, 2016; Salah et al., 2013; Sadoddin and
                                         Ghorbani, 2006). They can show what an attacker did, but not how they exploited the
                                         infrastructure. Attack Graphs (AG) are models that visually describe attacker strategies.
                                         While a lot of research has been done on AG generation, most methods that generate AGs
                                         rely heavily on expert knowledge (Ning et al., 2002; Alserhani, 2016; Ning et al., 2004), which
                                         is both expensive and time-consuming, or published vulnerability reports (Ou et al., 2005;
                                         Hu et al., 2020; Roschke et al., 2011; Gao et al., 2018), which are always one step behind
                                         attackers. Alert-based AG generation methods only use (IDS) alerts. To the best of our
                                         knowledge, SAGE (Nadeem et al., 2022) is the first and only method for generating Alert-
                                         based AGs without prior knowledge. SAGE uses a suffix-based probabilistic deterministic
                                         finite automaton (S-PDFA) to learn and model these attacks. This model accentuates
                                         infrequent severe alerts, without discarding low-severity alerts. After the S-PDFA is learned,
                                         it is used to recognize known attacks in new incoming alerts.
                                              A pitfall of SAGE however, is that these alerts must exactly follow a path in the state
                                         machine. In real-world scenarios, this is usually not the case, e.g., an alert is missing due
                                         to a new attacker technique or a defective IDS. Next to that, infrequent alerts can still
                                         be missed due to the nature of the statistical tests used in automaton learning algorithms.
                                         These are problems for probabilistic automaton learning algorithms and lead to missing
                                         attack paths in the model. SAGE uses the FlexFringe (Verwer and Hammerschmidt, 2017)
                                         implementation of Alergia (Carrasco and Oncina, 1994) to learn probabilistic automata.

                                         © 2022 D. Mouwen, S. Verwer & A. Nadeem.
Mouwen Verwer Nadeem
This implementation has some mechanisms to deal with infrequent traces such as the use
of sink states. These leave the infrequent parts of the prefix tree untouched because the
statistical tests performed on them are unreliable, making the learning algorithm less likely
to draw incorrect inferences. As a consequence, it learns nothing from infrequent traces.
In this paper, we propose a different strategy for dealing with them, which is to align
these sequences to the frequent parts of the learned automaton. We call our method
Sequence-Automaton Alignment Tool (SAAT). SAAT computes an alignment between a
sequence and an automaton, and computes a (normalised) score for each alignment pro-
duced. The average score (over all training data) can be used to determine how accurate the
model captures the data. An alignment can introduce new symbols or remove old ones, thus
dealing with missing or misplaced alerts. After alignment, we build a re-aligned data set and
rerun the main learning algorithm. By iteratively performing this process, we obtain smaller
and better aligned models than the original ones produced by FlexFringe. We demonstrate
SAAT ’s effectiveness on the CPTC-2018 security testing competition dataset(RIT, 2018),
which results in a 49% smaller model, while actually increasing how well the model describes
the data. Our main contributions are:
1. We propose Sequence-Automaton Alignment Tool (SAAT), which computes an align-
ment between a sequence and an automaton. Iteratively using the alignments results
in a smaller and more interpretable model.
2. We provide a definition of the normalised alignment score, a metric that quantifies
how well a model fits the data.
3. We show in experiments that SAAT reduces the model size by almost a half, while
improving the normalised score.
2. Related Work
Learning automata (state machines) from traces is a grammatical inference (De la Higuera,
2010) problem where traces are modeled as the words of a language, and the goal is to
find a model for this language, e.g., a (probabilistic) deterministic finite state automa-
ton. Learning such models from software trace data (Cook and Wolf, 1998) is not new
and has been used for analyzing different types of complex software systems such as web-
services (Bertolino et al., 2009; Ingham et al., 2007), X11 programs (Ammons et al., 2002),
communication protocols (Comparetti et al., 2009; Antunes et al., 2011; Fiterau-Brostean
et al., 2020), Java programs (Cho et al., 2011), and malicious software (Cui et al., 2007).
Popular tools for leaning form software trace data are CSight (Beschastnikh et al., 2014)
and MINT (Walkinshaw et al., 2016). SAGE (Nadeem et al., 2022) is the first tool to use
automaton learning to infer attack graphs from intrusion data.
Although alignment is not common in automaton learning, in process mining (Van
Der Aalst, 2012) it is frequently used in process conformance testing (Rozinat, 2010; Car-
mona et al., 2018), which uses sequence alignment to determine the fit of a process model
to a log of trace data. We perform a similar process but using a new sequence-to-model
algorithm based on (Tsoni et al., 2019). We will refer this algorithm as the TS algorithm. It
is a dynamic programming algorithm based on the Needleman-Wunsch sequence alignment
algorithm (Needleman and Wunsch, 1970).
2Robust Attack Graph Generation
(a) Example automaton (b) Matched sequence
A. a→b→e→d→f
Figure 1: An example automaton and a matched sequence. The number in parentheses is
the level of the node.
3. Sequence-Automaton Alignment Tool
Sequence-Automaton Alignment Tool (SAAT) is developed around the concept of an align-
ment between a sequence and an automaton. Recall that a sequence is a list of symbols,
e.g., or [apple, banana, cherry], and an automaton (or finite state machine) is a directed
graph with labels on the edges. In this work, an alignment is a list of matched, skipped, or
added edges. A matched edge describes both a symbol in the sequence, and an edge in the
model, while added and skipped edges describe the differences between the sequence and
the model. SAAT performs global alignment, meaning that the full sequence will be aligned
on the automaton.
3.1. Computing the Alignment Matrix
The alignment matrix is computed in similar manner as the TS algorithm (Tsoni et al.,
2019). It is computed for every sequence, and can afterwards be used to find to which edge
a symbol of the sequence is best matched. The matrix has size (m + 1) × (n + 1), with
m = the amount of edges of the automaton, and n = the length of the sequence. The
rows thus represent edges, while the columns represent the symbols. Table 1 shows the
3Mouwen Verwer Nadeem
Index Level Transition Symbol 0: a 1: b 2: e 3: d 4: f
0 0 -2 -4 -6 -8 -10
1 0 0→1 a -2 4 2 0 -2 -4
2 1 1→3 c -4 2 0 -2 -4 -6
3 2 3→4 e -6 0 -2 4 2 0
4 2 3→5 d -6 0 -2 -4 2 0
5 3 4→6 f -8 -2 -4 2 0 6
Table 1: The alignment matrix corresponding to the matched sequence of Figure 1(b) with
Linear Scoring (MATCH =4, MISMATCH =-4, GAP =-2). Green cells show a
MATCH, blue cells show a GAP. The highlighted cells are the maximum value
in each column.
alignment matrix for the automaton in Figure 1(a) and the sequence a → b → e → d → f .
The initial values (top row and left-most column) are the rows multiplied by the level
(depth) of an edge, and the columns by the index of the symbol. The content of the cells
are computed using scores for a MATCH and penalties for a MISMATCH and GAP. Each
cell ci,j corresponds to triggering transition i (row) with the label lj at index j (column).
Each transition is a tuple (si , ti , li ) of a source state si , a target state ti , and a transition
label li . A cell ci,j is updated with the maximum value of:
ck,j−1 + MATCH if si = tk and lj = lk
ck,j−1 − MISMATCH if si = tk and lj 6= lk
ck,j−1 − GAP if ti = tk
ck,j − GAP if si = tk
Thus, we follow a transition if one with the correct label exists and add a score. We can also
follow a transition with the wrong label but then add a large penalty. A smaller penalty
is given to staying in the current state (skipping a symbol from the sequence) or following
a transition without advancing the sequence index (skipping a transition from the model).
For more details on the alignment algorithm, we refer to (Tsoni et al., 2019). We note that
the use of ck,j in the update gives problems in the case of loops and for that reason the
algorithm operates per level, essentially unrolling loops.
3.2. Score of the Alignment
The alignment system gives a score to the computed alignment. This score gives an in-
dication of how well the sequence is aligned to the automaton. However, using the score
as-is always gives longer sequences a higher score, as more points can be scored. Thus, a
normalised score Snorm is used:
Smax = n ∗ M AT CH
Smin = n ∗ M ISM AT CH
s − Smin
Snorm =
Smax − Smin
4Robust Attack Graph Generation
where s the score of the alignment and n the length of the sequence. Since MATCH is the
maximum score possible for a single symbol, it is clear that a score of 1 can be reached by
having all symbols in the sequence aligned to a transition in the automaton. The normalised
score can be used as a metric to quantify how well a sequence fits the model. We use it to
quantify how well a model fits the data.
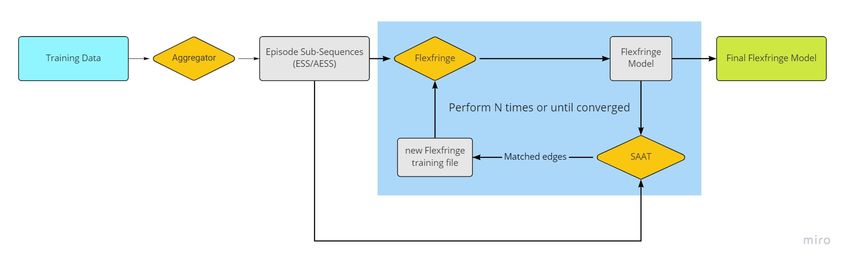
4. Iterative Models
SAAT computes the differences (or alignments) between the training data and the model.
From these differences, it can be deduced where the model falls short and how it can be
improved. The differences are used to generate a new Flexfringe training file, resulting in a
new and possibly improved model. By iteratively doing this process, the model converges
to an optimum. The new training data is generated according to a set of heuristics. The
input is a list of alert sequences. The general outline of this method is as follows:
1. Aggregate the alerts sequences into episode sub-sequences (ESS), and generate a
Flexfringe training file from these ESS.
2. Use Flexfringe to learn a model from this training file.
3. Compute the alignment between the learned model and the original ESS.
4. Generate a new Flexfringe training file from these matched sequences.
5. Repeat steps 2 to 4 with the new training file, until convergence.
Figure 2: Overview of iterative models
Initially, only matched edges will be used for the new training data. For example, if
there is only one ESS, with a → b → c → d, of which the edges a, c, and d are matched (and
b is skipped), the new training data will only contain a → c → d. The maximum number of
iterations will be set to 16. This number should be large enough to converge, while keeping
the training time low enough.
5Mouwen Verwer Nadeem
4.1. Model Evaluation
To determine the quality of the learned iterative models, the normalised score (Section 3.2)
is computed for each of the matched sequences. If there is an error, the sequence will
get the score 0. The average normalised score is computed over all matched sequences,
and indicates how well the model fits the data. We opt for this method instead of other
metrics like perplexity, since the sequences can be only partially present in the model.
The probability of such a sequence would be 0, but the normalised score will give a score
between 0 and 1. The average normalised score is saved for each iteration. When the
average normalised score is the same for at least 3 iterations, we can conclude that the
score has converged. From all iterations, the model with the best average normalised score
is picked as the final model, and is used to generate the attack graphs.
Next to the normalised score, the size of the model is taken into account. A smaller
model can be less descriptive, but also easier to interpret. As such, we favour smaller models
over bigger models. The original model (from SAGE), trained with standard parameters,
has an average normalised score of 0.656, and consists of 256 nodes.
4.2. Generating New Training Data
The new training data is generated from the alignments of the previous iteration. For each
alignment, only the matched edges are used as training data for the next iteration. Next to
that, two heuristics are used to improve the training data:
Remove Sequential Duplicates To make the model more concise, sequential duplicates
in the training data are removed. As SAAT can recover these symbols in the form of added
edges, this change does not affect the resulting attack graphs.
Add missing Sequences If the objective of a sequence (the first symbol) is not present
in the model, the sequence can never be matched. When this happens, this sequence is
added back to the training data.
5. Dataset & Experimental Setup
To verify and validate the capabilities of SAAT , perform two experiments:
1. Algorithm verification: We show that SAAT works as intended by applying simple
modifications to a set of sequences.
2. Learning comparison: We compare the quality of models learned by iterative SAAT
and SAGE, with regards to normalised score, model size, and interpretability.
5.1. CPTC-2018 Dataset
Security penetration testing competitions provide an ideal environment for multi-stage at-
tacks. We apply SAAT to the CPTC-2018 dataset(RIT, 2018). This public IDS alert dataset
contains Suricata alerts generated by six different teams whose objective is to compromise
a network infrastructure. Their methods may differ, but their goals are the same. This
makes the dataset interesting for automata learning, as their strategies are not equal but do
overlap. In (Munaiah et al., 2019) a more detailed explanation on this infrastructure and
6Robust Attack Graph Generation
the dataset is given. Before the alerts are used, they are parsed and aggregated into Episode
Sequences by SAGE. The automata are generated using Flexfringe, we refer to (Verwer and
Hammerschmidt, 2022) for an overview of its inner workings. As IDS are used as data,
which is positive data, the Alergia state merging algorithm (Carrasco and Oncina, 2002) is
used. The parameters used for Flexfringe are the same as in (Nadeem et al., 2022).
5.2. Algorithm Verification Experiments
The focus lays on whether SAAT can recover the modifications that were made to the data.
They will be evaluated on a learned model of the CPTC-2018 dataset. A test case will
be considered as successful when SAAT is able to correctly recover the original trace. For
example, if c is removed from the trace [a → b → c → d], SAAT should be able to recover
[a → b → d] back to [a → b → c → d], including the correct node ids. If any of the symbols
is wrong, the test is not correct. We test 7 test cases:
• REMOVE-1 and REMOVE-2, where 1 or 2 symbols are removed from the sequence.
• ADD-1 and ADD-2, where 1 or 2 random symbols are added to the sequence.
• MODIFY-1 and MODIFY-2, where 1 or 2 symbols are modified.
• SWAP-1, where 2 sequential symbols are swapped.
These test cases have been chosen to mimic real-world scenarios in which an attack (par-
tially) changes. For example, an IDS might miss an alert due to a new attack technique
which cannot be detected yet. Or an attacker might swap two steps if they are inter-
changeable. To generate the modified sequences, all possible attack paths in the model are
retrieved. For each attack path, all possible permutations possible for the current test case
are evaluated. For example, for REMOVE-1, if the attack path is n nodes long, then there
are n − 2 possible permutations: One for every possible removed node.
5.3. Learning Comparison
Two models are learned using iterative SAAT and SAGE. Every training data sequence will
be aligned to the models. For each aligned trace, the normalised score is computed. The final
score is the average of all normalised scores. We have chosen for this metric over perplexity
because a) perplexity is hard to compare over different datasets and implementations, and
b) the normalised score better expresses partially correct solutions.
5.4. Results
In Table 2, the results for the algorithm verification experiments are shown. SAAT is able to
recover from these simple modifications, and works as intended. MODIFY-2 has 6 incorrect
cases. Most of these are cases where two sequential symbols are modified. The next symbol
after these modified symbols is incorrectly labeled as added instead of matched. In Table 3,
the results of comparing the learned models of iterative SAAT and SAGE can be seen. The
model size has been greatly reduced from 256 nodes to 131.3 nodes, a 49% decrease. This
makes sense, as the infrequent traces are made to look like frequent ones, reducing the size
7Mouwen Verwer Nadeem
of the prefix tree. Furthermore, the average normalised score has actually improved from
0.656 to 0.706. Note that this is computed with respect to the original training data. The
SAAT model is therefore better at expressing the learned data with much fewer states.
test case number of tests correct accuracy
REMOVE-1 464 464 1.0
REMOVE-2 1855 1855 1.0
ADD-1 464 464 1.0
ADD-2 1855 1855 1.0
MODIFY-1 464 462 1.0
MODIFY-2 1855 1849 0.996
SWAP-1 380 359 0.944
Table 2: Results for the verification experiments of the CPTC-2018 dataset.
Avg. Norm. Score SD Norm. Score Avg. Size SD Size
SAAT iterative 0.706 0.014 131.3 8.825
SAGE 0.656 - 256 -
Table 3: Result of average normalised score (over 10 experiments) and size of Iterative
SAAT compared to SAGE, including standard deviation.
6. Conclusions and Future Work
We present a new alignment process called SAAT that can be used to learn smaller and
more robust automaton models. Performing this operation in an iterated process can reduce
the model size from 256 nodes to 131 nodes (a 49% decrease), while actually improving how
well the model fits the data. The normalised score can quantify the performance of a model
and is used to evaluate the iterative process.
With this work, we present a new approach to deal with a common problem in state
merging algorithms: what to do with infrequent states. FlexFringe labels these as sinks
states, essentially ignoring them. By aligning these sequences to the frequent part of the
learned model, we demonstrate how the data from these traces can be used during learning.
Future work will focus on applying SAAT to additional datasets, further utilizing the sink
states for the alignment process, and improving the alignment algorithm to better handle
cycles in the automaton.
8Robust Attack Graph Generation
References
Faeiz M Alserhani. Alert correlation and aggregation techniques for reduction of security
alerts and detection of multistage attack. International Journal of Advanced Studies in
Computers, Science and Engineering, 5(2):1, 2016.
Glenn Ammons, Rastislav Bodik, and James R Larus. Mining specifications. ACM Sigplan
Notices, 37(1):4–16, 2002.
Joao Antunes, Nuno Neves, and Paulo Verissimo. Reverse engineering of protocols from
network traces. In 2011 18th Working Conference on Reverse Engineering, pages 169–178.
IEEE, 2011.
Antonia Bertolino, Paola Inverardi, Patrizio Pelliccione, and Massimo Tivoli. Automatic
synthesis of behavior protocols for composable web-services. In Proceedings of the 7th
joint meeting of the European software engineering conference and the ACM SIGSOFT
symposium on The foundations of software engineering, pages 141–150, 2009.
Ivan Beschastnikh, Yuriy Brun, Michael D Ernst, and Arvind Krishnamurthy. Inferring
models of concurrent systems from logs of their behavior with csight. In Proceedings of
the 36th International Conference on Software Engineering, pages 468–479, 2014.
Josep Carmona, Boudewijn van Dongen, Andreas Solti, and Matthias Weidlich. Confor-
mance checking. Switzerland: Springer.[Google Scholar], 2018.
Rafael Carrasco and Jose Oncina. Learning stochastic regular grammars by means of a state
merging method. 11 2002. ISBN 978-3-540-58473-5. doi: 10.1007/3-540-58473-0 144.
Rafael C Carrasco and José Oncina. Learning stochastic regular grammars by means of a
state merging method. In ICGI. Springer, 1994.
Chia Yuan Cho, Domagoj Babić, Pongsin Poosankam, Kevin Zhijie Chen, Edward Xue-
Jun Wu, and Dawn Song. {MACE}:{Model-inference-Assisted} concolic exploration for
protocol and vulnerability discovery. In 20th USENIX Security Symposium (USENIX
Security 11), 2011.
Paolo Milani Comparetti, Gilbert Wondracek, Christopher Kruegel, and Engin Kirda.
Prospex: Protocol specification extraction. In 2009 30th IEEE Symposium on Security
and Privacy, pages 110–125. IEEE, 2009.
Jonathan E Cook and Alexander L Wolf. Discovering models of software processes
from event-based data. ACM Transactions on Software Engineering and Methodology
(TOSEM), 7(3):215–249, 1998.
Weidong Cui, Jayanthkumar Kannan, and Helen J Wang. Discoverer: Automatic protocol
reverse engineering from network traces. In USENIX Security Symposium, pages 1–14,
2007.
Colin De la Higuera. Grammatical inference: learning automata and grammars. Cambridge
University Press, 2010.
9Mouwen Verwer Nadeem
Paul Fiterau-Brostean, Bengt Jonsson, Robert Merget, Joeri De Ruiter, Konstantinos Sag-
onas, and Juraj Somorovsky. Analysis of {DTLS} implementations using protocol state
fuzzing. In 29th USENIX Security Symposium (USENIX Security 20), pages 2523–2540,
2020.
Ni Gao, Yiyue He, and Beilei Ling. Exploring attack graphs for security risk assessment:
a probabilistic approach. Wuhan University Journal of Natural Sciences, 23(2):171–177,
2018.
Hao Hu, Jing Liu, Yuchen Zhang, Yuling Liu, Xiaoyu Xu, and Jinglei Huang. Attack
scenario reconstruction approach using attack graph and alert data mining. Journal of
Information Security and Applications, 54:102522, 2020.
Kenneth L Ingham, Anil Somayaji, John Burge, and Stephanie Forrest. Learning dfa
representations of http for protecting web applications. Computer Networks, 51(5):1239–
1255, 2007.
Nuthan Munaiah, Akond Rahman, Justin Pelletier, Laurie Williams, and Andrew Meneely.
Characterizing attacker behavior in a cybersecurity penetration testing competition. In
2019 ACM/IEEE International Symposium on Empirical Software Engineering and Mea-
surement (ESEM), pages 1–6, 2019. doi: 10.1109/ESEM.2019.8870147.
Azqa Nadeem, Sicco Verwer, Stephen Moskal, and Shanchieh Jay Yang. Alert-driven attack
graph generation using s-pdfa. IEEE Transactions on Dependable and Secure Computing,
19(2):731–746, 2022. doi: 10.1109/TDSC.2021.3117348.
Saul B. Needleman and Christian D. Wunsch. A general method applicable to the search for
similarities in the amino acid sequence of two proteins. Journal of Molecular Biology, 48
(3):443–453, 1970. ISSN 0022-2836. doi: https://doi.org/10.1016/0022-2836(70)90057-4.
URL https://www.sciencedirect.com/science/article/pii/0022283670900574.
Peng Ning, Yun Cui, and Douglas S. Reeves. Constructing attack scenarios through cor-
relation of intrusion alerts. CCS ’02, page 245–254, New York, NY, USA, 2002. Associ-
ation for Computing Machinery. ISBN 1581136129. doi: 10.1145/586110.586144. URL
https://doi.org/10.1145/586110.586144.
Peng Ning, Dingbang Xu, Christopher G Healey, and Robert St Amant. Building attack
scenarios through integration of complementary alert correlation method. In NDSS, vol-
ume 4, pages 97–111, 2004.
Xinming Ou, Sudhakar Govindavajhala, and Andrew W Appel. Mulval: A logic-based
network security analyzer. In USENIX security symposium, volume 8, pages 113–128.
Baltimore, MD, 2005.
RIT. Cptc dataset, 2018. https://mirror.rit.edu/cptc/ [Accessed Nov. 2020].
Sebastian Roschke, Feng Cheng, and Christoph Meinel. A new alert correlation algorithm
based on attack graph. In Computational intelligence in security for information systems,
pages 58–67. Springer, 2011.
10Robust Attack Graph Generation
Anne Rozinat. Process mining: conformance and extension. 2010.
Reza Sadoddin and Ali Ghorbani. Alert correlation survey: Framework and techniques. In
Proceedings of the 2006 International Conference on Privacy, Security and Trust: Bridge
the Gap Between PST Technologies and Business Services, PST ’06, New York, NY, USA,
2006. Association for Computing Machinery. ISBN 1595936041. doi: 10.1145/1501434.
1501479. URL https://doi-org.tudelft.idm.oclc.org/10.1145/1501434.1501479.
Saeed Salah, Gabriel Maciá-Fernández, and Jesús E. Dı́az-Verdejo. A model-based survey of
alert correlation techniques. Computer Networks, 57(5):1289–1317, 2013. ISSN 1389-1286.
doi: https://doi.org/10.1016/j.comnet.2012.10.022. URL https://www.sciencedirect.
com/science/article/pii/S1389128612004124.
Sofia Tsoni, Sicco Verwer, Arie van Deursen, Mauricio Finavaro Aniche, and Rick Wie-
man. Log differencing using state machines for anomaly detection. Master’s thesis,
Delft University of Technology, 8 2019. URL http://resolver.tudelft.nl/uuid:
b0b39832-c921-412c-b6f8-9ac4c52b57f6.
Wil Van Der Aalst. Process mining. Communications of the ACM, 55(8):76–83, 2012.
S. Verwer and C. A. Hammerschmidt. flexfringe: A passive automaton learning pack-
age. In 2017 IEEE International Conference on Software Maintenance and Evolu-
tion (ICSME), pages 638–642, Los Alamitos, CA, USA, 9 2017. IEEE Computer So-
ciety. doi: 10.1109/ICSME.2017.58. URL https://doi-ieeecomputersociety-org.
tudelft.idm.oclc.org/10.1109/ICSME.2017.58.
Sicco Verwer and Christian Hammerschmidt. Flexfringe: Modeling software behavior by
learning probabilistic automata. arXiv preprint arXiv:2203.16331, 2022.
Neil Walkinshaw, Ramsay Taylor, and John Derrick. Inferring extended finite state machine
models from software executions. Empirical Software Engineering, 21(3):811–853, 2016.
URL https://github.com/neilwalkinshaw/mintframework.
11You can also read