Retinal thinning of inner sub-layers is associated with cortical atrophy in a mouse model of Alzheimer's disease: a longitudinal multimodal in ...
←
→
Page content transcription
If your browser does not render page correctly, please read the page content below
Chiquita et al. Alzheimer's Research & Therapy          (2019) 11:90
https://doi.org/10.1186/s13195-019-0542-8

 RESEARCH                                                                                                                                       Open Access

Retinal thinning of inner sub-layers is
associated with cortical atrophy in a mouse
model of Alzheimer’s disease: a
longitudinal multimodal in vivo study
Samuel Chiquita1,2†, Elisa J. Campos1,2†, João Castelhano2,3,4†, Mário Ribeiro2,3,4, José Sereno2,3,4, Paula I. Moreira2,5,6,
Miguel Castelo-Branco2,3,4*† and António Francisco Ambrósio1,2*†

  Abstract
  Background: It has been claimed that the retina can be used as a window to study brain disorders. However,
  concerning Alzheimer’s disease (AD), it still remains controversial whether changes occurring in the brain and retina
  are associated. We aim to understand when changes start appearing in the retina and brain, how changes progress,
  and if they are correlated.
  Methods: We carried out a unique longitudinal study, at 4, 8, 12, and 16 months of age, in a triple transgenic
  mouse model of AD (3×Tg-AD), which mimics pathological and neurobehavioral features of AD, as we have already
  shown. Retinal structure and physiology were evaluated in vivo using optical coherence tomography and
  electroretinography. Brain visual cortex structure was evaluated in vivo using magnetic resonance imaging.
  Results: The retinal thickness of 3×Tg-AD decreased, at all time points, except for the outer nuclear layer, where
  the opposite alteration was observed. Amplitudes in scotopic and photopic responses were increased throughout the
  study. Similarly, higher amplitude and lower phase values were observed in the photopic flicker response. No differences
  were found in the activity of retinal ganglion cells. Visual cortex gray matter volume was significantly reduced.
  Conclusions: Our results show that this animal model shows similar neural changes in the retina and brain visual cortex,
  i.e., retinal and brain thinning. Moreover, since similar changes occur in the retina and brain visual cortex, these
  observations support the possibility of using the eye as an additional tool (noninvasive) for early AD diagnosis and
  therapeutic monitoring.
  Keywords: Alzheimer’s disease, 3×Tg-AD mouse model, Retina, Brain

Background                                                                           to identify subclinical biomarkers that can predict the
The concept of “the retina as a window to the brain” has                             subsequent appearance of symptoms [2]. Moreover, in
emerged with possible implications in various patholo-                               order to have a definitive diagnosis of AD, there is the
gies, such as Alzheimer’s disease (AD), Parkinson’s dis-                             need to identify amyloid β (Aβ) plaques and neurofibril-
ease and multiple sclerosis [1]. In AD, it is still difficult                        lary tangles post-mortem [3–5]. To achieve better and
                                                                                     earlier treatments for AD, it is crucial to target early
                                                                                     diagnosis. Thus, there is an urgent need to identify new
* Correspondence: mcbranco@fmed.uc.pt; afambrosio@fmed.uc.pt
†
 Samuel Chiquita, Elisa J. Campos and João Castelhano contributed equally            biomarkers that can reliably help diagnose early AD
to this work                                                                         onset [6].
†
 Miguel Castelo-Branco and António Francisco Ambrósio contributed equally              Visual alterations have been detected in AD patients,
to this work, as senior authors
2
 CNC.IBILI Consortium, University of Coimbra, 3004-504 Coimbra, Portugal             and those alterations can be associated with structural
1
 Coimbra Institute for Clinical and Biomedical Research (iCBR), Faculty of           and functional changes in the retina [7–9]. Retinal im-
Medicine, University of Coimbra, 3000-548 Coimbra, Portugal                          aging and electrophysiology can be used to evaluate
Full list of author information is available at the end of the article

                                       © The Author(s). 2019 Open Access This article is distributed under the terms of the Creative Commons Attribution 4.0
                                       International License (http://creativecommons.org/licenses/by/4.0/), which permits unrestricted use, distribution, and
                                       reproduction in any medium, provided you give appropriate credit to the original author(s) and the source, provide a link to
                                       the Creative Commons license, and indicate if changes were made. The Creative Commons Public Domain Dedication waiver
                                       (http://creativecommons.org/publicdomain/zero/1.0/) applies to the data made available in this article, unless otherwise stated.
Chiquita et al. Alzheimer's Research & Therapy (2019) 11:90 Page 2 of 16 structural and functional abnormalities in the retina, a Methods more accessible structure for a potential early AD detec- Animals tion [10, 11]. The eye enables to perform noninvasive, Experiments were performed in male 3×Tg-AD mice inexpensive and in vivo tests, which is often not the case harboring three human mutant genes, presenilin-1 concerning the brain. In particular, optical coherence (PS1M146V), amyloid precursor protein (APPSWE) and tau tomography (OCT) measurements have shown that (tauP301L), which develop the pathological hallmarks of there is a thinning of the retina in AD patients [12–16]. AD in an age-dependent manner [53, 54], and in gender- Actually, manifestations in AD, Parkinson’s disease and and age-matched WT animals (C57BL6/129S back- multiple sclerosis have been reported with the aid of ground). The 3×Tg-AD line was originally generated by OCT quantifications [17–21]. Retinal nerve fiber layer co-microinjection of human APPK670M/N671L and tauP301L (RNFL) thickness reduction has been observed in AD transgenes, under the control of the Thy 1.2 promoter, patients [8, 21–25]. However, other authors have into mutant PS1M146V knock-in mice [54]. Male 3×Tg-AD claimed that there are no differences in RNFL thickness and WT mice were used to evaluate in vivo structural between mild cognitive impairment or AD patients and and/or functional changes in the retina and visual cortex control groups [26–29]. Further studies in AD patients at 4, 8, 12 and 16 months of age. The animals were main- also showed the reduction of ganglion cell layer (GCL) tained at 22 ± 1 °C, 68% relative humidity, in a 12 h light/ [18, 30, 31] and inner plexiform layer (IPL) thickness 12 h dark cycle, with access to water and food ad libitum. [32–34], as well as cortical atrophy, namely the decrease All procedures involving animals were approved by the in the volume of visual cortex [35, 36]. Recently, the ex- Animal Welfare Committee of the Coimbra Institute for istence of Aβ plaques in the retina was reported in sev- Clinical and Biomedical Research (iCBR), Faculty of Medi- eral AD animals models [14], and in both post-mortem cine, University of Coimbra. The animal experimentation retinas of advanced and early stage AD patients [37, 38] was conducted in accordance with the European Commu- and, using curcumin-based fundus imaging, in AD nity directive guidelines for the use of animals in labora- patients [39]. tory (2010/63/EU), transposed into the Portuguese law in Aiming to clarify the controversy related with the pos- 2013 (Decreto-Lei 113/2013), and with the Association for sible use of the eye as a window to the brain in AD, lon- Research in Vision and Ophthalmology (ARVO) state- gitudinal studies with large cohorts need to be carried ment for animal use. out. Mouse models of AD offer the possibility of per- forming longitudinal studies on a much shorter time- OCT imaging scale than in AD patients. There are several studies Retinal structure was evaluated using OCT, which then designed to assess retinal structural and functional allowed to perform the segmentation of retinal layers. In changes in AD murine models [5, 40–46]. Conversely, order to evaluate in vivo structural changes, a longitu- there are only a few studies that assess the pathophysi- dinal study was carried out at 4, 8, 12 and 16 months of ology of AD in animal models simultaneously in the ret- age using 3×Tg-AD and age-matched WT mice. In vivo ina and brain, trying to establish possible correlations OCT line and circular scans were acquired with Phoenix between these structures [5, 47–51]. These studies OCT2 together with Phoenix Micron IV retinal imaging assessed only few structural and functional parameters, microscope (Phoenix Research Laboratories, San Ramon, without expressing the inner sub-layers detail, Therefore, CA, USA). Retinal thickness was measured using InSight we aimed to get further insight into the pathophysiology image segmentation software (v.1, Voxeleron LLC - Image of AD and, particularly, to understand if changes in the analysis solutions, Chabot Drive, CA, USA) between the retina correlate with changes in the visual cortex. To inner limiting membrane and the retinal pigment epithe- achieve this goal, we performed a unique and novel lon- lium. For each eye, one OCT scan was performed around gitudinal study using the 3×Tg-AD mouse model. We the optic nerve head and six scans were performed above previously showed that 3×Tg-AD mice have recognition and below the optic nerve head (Additional file 1: Figure memory impairment, early hippocampal structural loss, S1A). Subsequently, measurements of ganglion cell layer increased Aβ and hyperphosphorylated tau, and de- (GCL) plus the inner plexiform layer (IPL), inner nuclear creased levels of taurine [52]. In the present study, we layer (INL) plus outer plexiform layer (OPL), outer nuclear assessed simultaneously the retinal and visual cortex al- layer (ONL), inner segments (IS) plus outer segments (OS) terations, in vivo, at four different time points: 4, 8, 12 and total retina thickness were obtained both for 3×Tg-AD and 16 months of age. This is, thus, an approach much and WT animals (Additional file 1: Figure S1B). Circular more relevant for clinical setting. Furthermore, the com- and line scan thickness values for each animal are presented bination of structural and functional changes, either in as the average value of both eyes. To perform OCT, ani- the retina and brain regions, such as the visual cortex, mals were anesthetized using a combination of ketami- might be used as biomarker for early AD diagnosis. ne+xylazine 80 mg/kg + 5 mg/kg (Imalgene 1000, Merial,
Chiquita et al. Alzheimer's Research & Therapy   (2019) 11:90                                                    Page 3 of 16

Lyon, France, and Rompum®, Bayer, Leverkusen, Germany,          made using RETIport software (Roland Consult). Scotopic
respectively) administered with one intraperitoneal injec-      a-wave and b-wave amplitudes were obtained for seven
tion. Pupils were dilated using topical tropicamide (1%,        light intensities from 0.0095 to 9.49 cd.s/m2. Four OPs were
Tropicil®, Laboratório Edol, Carnaxide, Portugal). The cor-     extracted for six light intensities between 0.030 and 9.49
nea was anesthetized with topical anesthetic eye drops (4       cd.s/m2. During photopic adaptation, the b-wave amplitude
mg/ml oxybuprocaine hydrochloride, Anestocil®, Labor-           was measured. b-wave amplitude photopic luminance re-
atório Edol, Carnaxide, Portugal). The cornea was kept          sponses were measured for 3.00 and 9.49 cd.s/m2. OFF-line
hydrated and optically cleared using hydroxypropyl              digital filter was applied on the b-wave (high-frequency cut-
methylcellulose (Methocel™ 2%, Dávi II Farmacêutica             off of 50 Hz) and oscillatory potentials (low-frequency cut-
S.A., Barcarena, Portugal), during the whole procedure.         off of 60 Hz for scotopic ERGs and 55 Hz for photopic
                                                                ERGs). Flicker responses were evaluated by determining
Electroretinography                                             the amplitude and phase of the base wave (6.33 Hz), first
Retinal physiology was evaluated using flash and pattern        (12.7 Hz), and second (19 Hz) harmonics with the fast Fou-
electroretinography (fERG and PERG, respectively), in           rier transform.
which electrical response of retinal cells is measured.
PERG allowed for the assessment of the function of              Pattern electroretinography
retinal ganglion cells (RGCs). Assays were performed at         Animals were prepared as described in the previous sec-
4, 8, 12, and 16 months of age in 3×Tg-AD and age-              tion. Light-adapted PERG recordings were acquired
matched WT mice.                                                using the RETIport System (Roland Consult). Electrodes
                                                                were placed in the animal, as described above. Stimuli
Flash electroretinography                                       were dark and light gratings displayed on a monitor
After 12 h overnight dark adaptation, mice were anesthe-        whose center was aligned with the projection of the
tized with an intraperitoneal injection of ketamine (80         pupil and presented from a short distance (typically, 20
mg/kg) and xylazine (5 mg/kg) in 0.1 ml saline solution,        cm) to stimulate a large retinal area. Stimuli were dis-
under dim red light illumination. Pupil was dilated using       played for 200 sweeps of contrast reversals with 1 Hz
topical phenylephrine (100 mg/ml phenylephrine hydro-           temporal frequency, contrast between 95 and 100%.
chloride, Davinefrina, Dávi II Farmacêutica S.A.), and          After PERG recording of the right eye, a new electrode
the cornea was locally anesthetized and kept hydrated,          was placed on the left eye and the same procedure was
as described in the previous section. The body temperature      followed. RGC activity was evaluated by measuring an
was maintained with a heating pad set to 37 °C. ERG re-         initial corneal positive response, referred to as P50,
cordings were acquired using a RETIport System (Roland          followed by a corneal negative response, referred to as
Consult Electrophysiological Diagnostic Systems, Branden-       N95. An evaluation of the amplitude of P50/P1 and
burg, Germany), based on a protocol described previously        N95/N2, the time to peak of the major positive and nega-
(Rosolen et al., 2005). The gold ring electrode (gold wire      tive deflection was performed. Signals were band pass fil-
0.25 mm, 2.5 mm diameter, Roland Consult) was placed at         tered (1–40 Hz) and artifact rejection was set at 100 μV
the corneal surface, the reference electrode was placed sub-    peak to peak with a sample frequency of 1.136 kHz.
cutaneously at the head, and the ground electrode was
placed also subcutaneously in the base of the tail. Light       Magnetic resonance imaging (MRI)
stimulation was performed using a Ganzfeld stimulator           Brain structure was evaluated using magnetic resonance
(Roland Consult). Series of white flashes of seven different    imaging (MRI). Data acquisition was performed at 4, 8,
light intensities (0.0095 to 9.49 cd.s/m2) were delivered       12, and 16 months of age in 3×Tg-AD and age-matched
three times at 0.1 and 1.3 Hz for the acquisition of the        WT mice.
scotopic and photopic luminance responses, respectively.
Photopic adaptation to a white background (25 cd/m2) was        Data acquisition
carried out during 16 min, and light flashes with intensity     MRI experiments were performed in a BioSpec 9.4 T
of 9.49 cd.s/m2 were applied three times at 1.3 Hz, at the      scanner with a standard cross coil setup using a volume
onset of light adaptation and at 2, 4, 8, and 16 min of light   coil for excitation (with 86/112 mm of inner/outer diam-
adaptation. For the photopic flicker response, under a white    eter, respectively) and quadrature mouse surface coil for
background light (25 cd.s/m2), white bright flashes (3.00       signal detection (Bruker Biospin, Ettlingen, Germany).
and 9.49 cd.s/m2) were delivered ten times at 6.3 Hz. ERGs      Animals were kept anesthetized with isoflurane (1.5%)
were recorded with a bandwidth of 1–300 Hz at a sampling        with 100% O2 and body temperature and respiration
rate of 3.4 kHz (0.8 kHz for flicker test). Measurement of      monitoring (SA Instruments SA, Stony Brook, NY, USA).
negative a-wave, positive b-wave and individual oscillatory     T2-weighted images were acquired in coronal planes using
potentials (OPs) amplitude and time to peak values, were        a Rapid Acquisition with Relaxation Enhancement (RARE)
Chiquita et al. Alzheimer's Research & Therapy (2019) 11:90 Page 4 of 16
sequence with the following parameters: TR = 3800 Results
ms; TE = 33 ms; 10 averages; pixel size of 0.078 mm × Reduction of retinal thickness of 3×Tg-AD mice
0.078 mm and slice thickness of 0.5 mm without spa- We evaluated, in vivo, whether the retinal structure of
cing between slices (total head volume: 256 pixels × 3×Tg-AD mice was affected, using OCT (line and circle
256 pixels × 34 slices). scans; Additional file 1: Figure S1), followed by the seg-
mentation of retinal layers. ANOVA revealed that the
total retina thickness was significantly decreased in
Data analysis 3×Tg-AD mice compared to that in WT mice (line
Voxel-based morphometry (VBM) was performed using scans, F (1, 33) = 100.2, p < 0.001; circle scans, F (1,
the statistical parametric mapping software (SPM, 31) = 106.0, p < 0.001) (Fig. 1a, Additional file 1: Figure
Welcome Department of Cognitive Neurology, London, S3A). However, no time effect was observed (line scans,
UK), the SPMMouse toolbox [55], and a homemade F (3, 99) = 1.3, p = 0.270) (Fig. 1a). Furthermore,
script involving the following steps: (a) T2-weighted im- throughout the study, we observed a significant thinning
ages were corrected for the magnetic field inhomogen- of GCL+IPL (F (2.6, 85.7) = 3.4, p < 0.05) and INL+OPL
eity generated by the surface coil and this was done (F (2.2, 72.5) = 19.0, p < 0.001), whereas no time effect
using intensity curves from T2-weighted images ob- was observed on the IS+OS layer thickness (F (2.5,
tained for an homogeneous phantom and acquired with 82.8) = 0.73, p = 0.510). The thickness of each retinal
the same coil and system configuration; (b) the rigid layer was consistently significantly lower in 3×Tg-AD
body was aligned by registering (affine transformation) mice compared to WT mice (GCL+IPL, F (1, 33) =
the images to the template space; (c) tissue segmentation 121.8, p < 0.001; INL+OPL, F (1, 33) = 22.7, p < 0.001;
was carried out by means of the gray matter (GM), white IS+OS layer, F (1, 33) = 105.1, p < 0.001) (Fig. 1). Particu-
matter (WM), and cerebrospinal fluid (CSF) tissue prob- larly, at 16 months, the total retinal thickness of WT
ability maps as provided in the toolbox; (d) GM images mice, 192.3 μm, decreased to 177.9 μm in 3×Tg-AD mice
were non-linearly normalized to the template space and (p < 0.001, Fig. 1a), and the thickness of GGL+IPL de-
were modulated to correct for volume changes that creased from 60.7 μm in WT mice to 51.0 μm in 3×Tg-
might have occurred during normalization; (e) a binary AD mice (p < 0.001, Fig. 1b), whereas the IS+OS layer
mask, corresponding to the right visual cortex, was thickness was 39.5 μm and 33.1 μm in WT and 3×Tg-
drawn in the template space and placed in each aligned AD mice, respectively (p < 0.001, Fig. 1e). However, con-
GM image; (f) finally, the GM volume was quantified by versely to the results obtained for the layers described
multiplying the GM volume in each voxel by the num- above, a significant increase of ONL thickness (F (2.6,
ber of voxels. All steps were done using the default set- 85.1) = 8.6, p < 0.001) was observed, during the study.
tings of the toolbox. Also the thickness of ONL of 3×Tg-AD mice was signifi-
cantly higher (F (1, 33) = 8.7, p < 0.01) in comparison
with WT mice (Fig. 1d). At 16 months, the ONL thick-
Statistical analysis ness was 58.8 μm and 55.5 μm in 3×Tg-AD and WT
Statistical analysis was performed using GraphPad mice, respectively (p < 0.001). Overall, we observed a
Prism Version 6 (GraphPad Software, San Diego, CA, thinning of total retina, GCL+IPL, INL+OPL, and IS+OS
USA) and SPSS 22.0 (SPSS Inc., Chicago, IL, USA). of 3×Tg-AD mice. Conversely, ONL was found to be
The normality of the data was assessed with D’Agos- thicker in this AD animal model.
tino and Pearson omnibus normality tests. Differences
in thickness of retinal layers and in retinal function Alterations in the retinal physiological scotopic responses
between groups, at each time point (4, 8, 12, and 16 of 3×Tg-AD animals
months) were assessed using an analysis of variance We used fERG to explore the functional integrity of spe-
(ANOVA) repeated-measures (mixed-effects), where cific retinal cell types in both WT and 3×Tg-AD mice.
time was assumed as “within-subject” factor, and the Regarding the scotopic response, the retina is stimulated
experimental group (i.e., 3×Tg-AD and WT mice) was with low-intensity light flashes to induce rod activation.
assumed as “between-subject” factor, followed by a The function of photoreceptors and downstream retinal
post hoc t-test. Differences in GM volumes of the vis- cells can then be examined. Photoreceptors (mainly
ual cortex along time and between groups were rods) are the cells contributing to a-wave, whereas the
assessed using an ANOVA repeated measures (mixed- b-wave is widely believed to reflect mainly the activation
effects) followed by a Bonferroni post hoc t-test. of bipolar cells. OPs are thought to reflect cell activity in
Results were presented as mean ± SEM. Statistical sig- the inner retina, mainly amacrine cells [56].
nificance was considered at *p < 0.05, **p < 0.01, and The results obtained from the analysis of these electro-
***p < 0.001. retinograms showed that, overall, 3×Tg-AD mice hadChiquita et al. Alzheimer's Research & Therapy (2019) 11:90 Page 5 of 16 Fig. 1 Thickness of different retinal layers in WT (white bars) and 3×Tg-AD (black bars) mice at 4, 8, 12, and 16 months of age, based on in vivo OCT line scans. The thickness of retinal layers was measured using the InSight software. a Total retina, b GCL+IPL, c INL+OPL, d ONL, e IS+OS. The results are presented as mean ± SEM. *p < 0.05, ***p < 0.001, according to Student’s t test. nWT: at 4 months = 21, at 8 months = 19, at 12 months = 17, at 16 months = 17; n 3×Tg-AD: at 4 months = 22, at 8 months = 22, at 12 months = 22, at 16 months = 22 significantly higher scotopic a-wave amplitude than age- (1, 30) = 52.6, p < 0.001) of 3×Tg-AD mice was signifi- matched WT mice (F (1, 30) = 10.6, p < 0.01), particu- cantly higher than age-matched WT mice, regardless larly, at 4 and 12 months (p < 0.05, Fig. 2a). ANOVA of the time point (Fig. 2b, c, respectively). Actually, further determined significant differences in scotopic a- clear differences between 3×Tg-AD and age-matched wave amplitude during the study (F (2.0, 62.8) = 4.0, p < WT mice were observed at 4, 8, 12, and 16 months of 0.05). Our results also showed that 3×Tg-AD mice age, regardless of the luminance (F (1, 28) = 35.5, p < present lower time to peak values in comparison with 0.001, Fig. 3). Moreover, we observed a reduction of age-matched WT animals, mainly at higher luminance the b-wave amplitude difference between 3×Tg-AD (F (1, 28) = 130.2, p < 0.001, Additional file 1: Figure S4). and WT mice, from 4 to 16 months of age (F (3, Therefore, we observed a faster response in the a-wave 84) = 8.6, p < 0.001, Additional file 1: Figure S5). We of 3×Tg-AD mice. The amplitude of scotopic b-wave further found a significant reduction of brod (F (1.9, resulting from rod activation (brod, F (1, 30) = 33.2, 55.5) = 4.5, p < 0.05) and bmix (F (1.9, 56.3) = 9.8, p < p < 0.001) and from rod and cone activation (bmix, F 0.001) amplitude, along time.
Chiquita et al. Alzheimer's Research & Therapy      (2019) 11:90                                                                         Page 6 of 16

 Fig. 2 Retinal function in WT and 3×Tg-AD mice at 4, 8, 12, and 16 months of age assessed by fERG, under scotopic conditions. Main component
 values obtained in response to 0.0095 cd.s/m2 light stimulus (brod) or 9.49 cd.s/m2 light stimulus (amix, bmix, and OP1) in WT (white bars) and
 3×Tg-AD (black bars): a amix amplitude, b brod amplitude, c bmix amplitude, d OP1 amplitude. The results are presented as mean ± SEM. *p < 0.05,
 **p < 0.01, and ***p < 0.001 according to Student’s t test. nWT: at 4 months = 19, at 8 months = 19, at 12 months = 17, at 16 months = 17; n3×Tg-AD:
 at 4 months = 23, at 8 months = 23, at 12 months = 22, at 16 months = 22

  The OP1 amplitude values of 3×Tg-AD mice were                              Increased amplitude of photopic responses of 3×Tg-AD
higher than those of age-matched WT mice, at all                             mice
time points (F (1, 30) = 7.3, p < 0.05). However, statis-                    Once fully light-adapted, the retina was stimulated with
tically significant differences (p < 0.01) were observed                     high-intensity light flashes. Thus, during the photopic
only at 12 months (Fig. 2d). A significant decrease                          response, the function of cone photoreceptors is mea-
throughout the study was further observed (F (3,                             sured, since the rod response is suppressed [56]. The b-
90) = 3.1, p < 0.05). OP1 time to peak values were                           wave amplitude of 3×Tg-AD mice was significantly
also affected. We observed that 3×Tg-AD mice pre-                            higher (F (1, 30) = 49.5, p < 0.001) than WT mice. How-
sented faster OP responses (F (1, 29) = 28.4, p <                            ever, no statistically significant differences were observed
0.001, Additional file 1: Figure S6). During the study,                      at 16 months (Fig. 4a). Throughout the study, we ob-
no significant differences were found (F (2.6, 74.8) =                       served a statistically significant decrease in the b-wave
2.5, p = 0.074). No statistically significant interaction                    amplitude (F (3, 90) = 4.0, p < 0.01), particularly between
time and experimental group was observed in sco-                             4 (p < 0.05) and 8 (p < 0.01) months vs 16 months. The
topic response. In summary, under scotopic condi-                            interaction time and experimental group was also found
tions, we found several alterations in a-wave, b-wave,                       to be statistically significant (F (3, 90) = 2.8, p < 0.05).
and OPs of 3×Tg-AD, regarding amplitude and time                             Accordingly, similarly to scotopic conditions, retinal
to peak, denoting clear physiological alterations in                         photopic responses were altered in the retina of 3×Tg-
the retina of this AD animal model.                                          AD mice.
Chiquita et al. Alzheimer's Research & Therapy    (2019) 11:90                                                                      Page 7 of 16

 Fig. 3 Scotopic b-wave amplitude in WT (white circles) and 3×Tg-AD (black circles) mice, at a 4, b 8, c 12, and d 16 months of age. Graphs
 present the amplitude of the b-wave at the indicated luminance conditions. The results are presented as mean ± SEM. *p < 0.05, **p < 0.01,
 ***p < 0.001, according to Student’s t test. nWT: at 4 months = 19, at 8 months = 19, at 12 months = 17, at 16 months = 17; n3×Tg-AD: at 4
 months = 23, at 8 months = 23, at 12 months = 22, at 16 months = 22

Increased photopic flicker harmonic amplitude of 3×Tg-                    experimental group was statistically significant as well (F
AD mice                                                                   (1.5, 45.5) = 4.0, p < 0.05). The second harmonic ampli-
As in the photopic response, in the photopic flicker re-                  tude values significantly decrease overtime (F (1.5,
sponse the electrical activity is mainly cone-driven. The                 46.1) = 11.8, p < 0.001, Additional file 1: Figure S7E). Re-
base wave (F (1, 30) = 160.0, p < 0.001), first (F (1, 30) =              garding the interaction time and experimental group,
57.0, p < 0.001), and second (F (1, 30) = 83.6, p < 0.001)                statistically significant differences were found (F (1.5,
harmonic amplitudes of 3×Tg-AD mice was significantly                     46.1) = 6.3, p < 0.01).
higher compared to age-matched WT mice, at all time                         Moreover, 3×Tg-AD animals tend to follow the input
points (Fig. 4b and Fig. 5a, c, e, g). We also found an                   base wave frequency (6.33 Hz) more effectively than WT
overall significant decrease of base wave amplitude                       mice leading to a difference in phase responses (F (1,
values, throughout the different time points (F (1.6,                     30) = 100.8, p < 0.001) (Fig. 5b, d, f, h and Additional file 1:
49.1) = 14.8, p < 0.001, Additional file 1: Figure S7A).                  Figure S7B). In the first harmonic phase, a similar result
The interaction time and experimental group was also                      was obtained, meaning that 3×Tg-AD mice still had a
found to be statistically significant (F (1.6, 49.1) = 6.0,               faster response at first harmonic frequency (12.7 Hz)
p < 0.01). The first harmonic amplitude values also de-                   than WT mice (F (1, 30) = 21.9, p < 0.001) (Fig. 5 b, d, f,
creased over time (F (1.5, 45.5) = 14.6, p < 0.001, Add-                  h and Additional file 1: Figure S7D). Conversely, WT
itional file 1: Figure S7C). The interaction time and                     mice were found to have a faster response at second
Chiquita et al. Alzheimer's Research & Therapy (2019) 11:90 Page 8 of 16
Fig. 4 Retinal function in WT and 3×Tg-AD mice at 4, 8, 12, and 16 months of age, assessed by fERG, under photopic conditions. Main
component values obtained in response to 9.49 cd.s/m2 light stimulus in WT (white bars) and 3×Tg-AD (black bars): a bcone amplitude, b base
wave amplitude. The results are presented as mean ± SEM. **p < 0.01, ***p < 0.001 according to Student’s t test. nWT: at 4 months = 19, at 8
months = 19, at 12 months = 17, at 16 months = 17; n3×Tg-AD: at 4 months = 23, at 8 months = 23, at 12 months = 22, at 16 months = 22
harmonic frequency (F (1, 30) = 80.8, p < 0.001) (19 Hz, 3×Tg-AD animals in comparison to age-matched WT
Fig. 5b, d, f, h and Additional file 1, Figure S7F). No sta- mice, at all time points (Fig. 7b).
tistically significant time effect was observed in the
flicker responses, nor any interaction time and experi- Retinal thickness changes and physiological responses
mental group. Overall, we observed higher amplitude are correlated with visual cortex gray matter volume
and lower phase values in the photopic flicker response In order to further elucidate the correlation between the
of 3×Tg-AD. alterations in the retina and visual cortex, we performed
a correlation analysis between the retinal thickness and
photopic flicker response with the GM volume in the
Similar PERG responses of 3×Tg-AD and WT mice
visual cortex. The Spearman correlation test showed a
Electrophysiological assessment of RGC function was
positive correlation between total retinal thickness and
made using PERG. Regarding amplitude, no statistically
GM volume (retina line scan: rS = 0.657, p < 0.001; retina
significant differences were observed between 3×Tg-AD
circle scan: rS = 0.728, p < 0.001; Additional file 1: Figure
and age-matched WT mice (Fig. 6). In particular, no sta-
S8A). Additionally, we performed the same analysis to
tistically significant differences were found between both
evaluate the correlation between photopic flicker re-
groups in P1 and N2 implicit time and amplitude, at all
sponse amplitude and GM volume in the visual cortex.
time points (data not shown).
We found a significant negative correlation between
photopic flicker base amplitude and GM volume in the
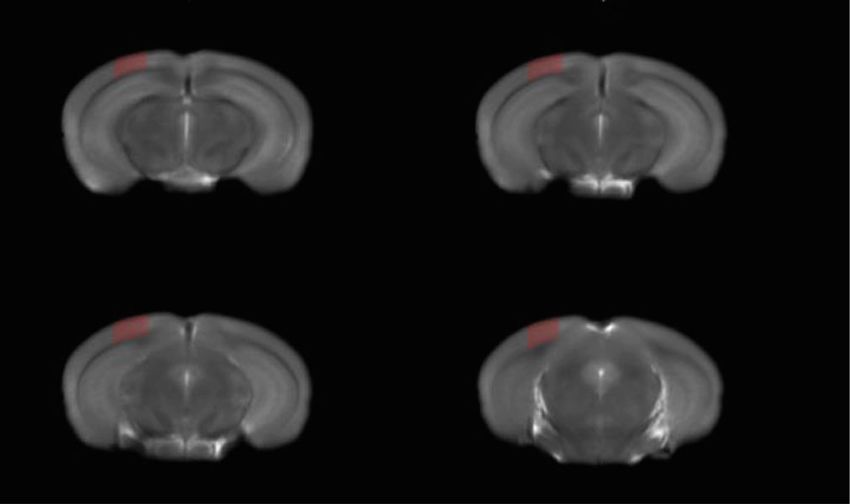
Volume reduction of visual cortex gray matter of 3×Tg- visual cortex (rS = − 0.790, p < 0.001; Additional file 1:
AD mice Figure S8B). Moreover, the correlation of retinal thick-
We acquired whole-brain anatomical MRI data to study ness, namely for both line and circle scans in the
potential alterations in the GM volume of 3×Tg-AD GCL+IPL and the photopic flicker response amplitude
mice relatively to age-matched WT mice, at different was found to be negative, at all time points (Table 1).
time points (4, 8, 12, and 16 months of age). A whole- Results are summarized in Table 2.
brain analysis revealed a significant age-dependent re-
duction of the GM volume between both groups (F (1, Discussion
8) = 71.0, p < 0.001). Furthermore, an analysis focused on Recently, in a longitudinal study (4, 8, 12, and 16 months
the visual cortex, as a region-of-interest (ROI) (Fig. 7a), of age) using a mouse model of AD, 3×Tg-AD, we re-
also showed that the GM volume of the 3×Tg-AD mice ported that this model presents, since the early time
was significantly reduced compared to the age-matched points, (i) recognition memory impairment, (ii) increased
WT mice (F (1, 8) = 105.0, p < 0.001), at all time points levels of Aβ and hyperphosphorylated tau in the hippo-
(Fig. 7b). VBM analysis showed a significant decrease in campus, (iii) decreased hippocampal volume, and (iv)Chiquita et al. Alzheimer's Research & Therapy (2019) 11:90 Page 9 of 16 Fig. 5 Photopic flicker retinal response in WT (white bars) and 3×Tg-AD (black bars) mice at a, b 4, c, d 8, e, f 12, and g, h 16 months of age. The responses were recorded in response to 9.49 cd.s/m2 light stimulus. The amplitude and phase of the signal were evaluated after fast Fourier transform. The results are presented as mean ± SEM. **p < 0.01, ***p < 0.001, according to Student’s t test. nWT: at 4 months = 19, at 8 months = 19, at 12 months = 17, at 16 months = 17; n3×Tg-AD: at 4 months = 23, at 8 months = 23, at 12 months = 22, at 16 months = 22 loss of taurine, which is an important endogenous neu- which parallel neurobehavioral deficits, thus providing roprotector. We showed that hippocampal volumetry an in vivo multimodal validation of the 3×Tg-AD mouse and neurospectroscopy can be early valuable biomarkers, as an early disease model [52].
Chiquita et al. Alzheimer's Research & Therapy      (2019) 11:90                                                                       Page 10 of 16

 Fig. 6 RGC function in WT and 3×Tg-AD mice at 4, 8, 12, and 16 months of age, assessed by PERG. PERG amplitude obtained in WT (white bars)
 and 3×Tg-AD (black bars). The results are presented as mean ± SEM. No statistically significant differences were obtained, according to Student’s t
 test. nWT: at 4 months = 19, at 8 months = 19, at 12 months = 17, at 16 months = 17; n3×Tg-AD: at 4 months = 23, at 8 months = 23, at 12 months =
 22, at 16 months = 22

  In the present study, we also used 3×Tg-AD mice to                         study also represents not only a completely new ap-
assess if the retina can be a window or a mirror of the                      proach in animal models to tackle the potential links be-
brain. Again, we performed a longitudinal multimodal                         tween retinal and brain changes in the context of AD
in vivo assessment at four different time points (4, 8, 12,                  pathology, but also gives new clues about the pathology
and 16 months of age), both in the retina and brain.                         and confirms some findings that have been already ob-
Here, correlations between changes in the retina and                         served in humans. In the present study, only male mice
brain were performed, based on different physiological                       were used. Recent evidences support the importance of
and structural approaches in association with MRI. This                      using a balanced population of male and female subjects

 Fig. 7 Gray matter volume analysis in the visual cortex. a Region of interest used in the assessment of the visual cortex volume overlaid on a
 mean T2-weighted image. b GM volume in the visual cortex of WT (white circles) and 3×Tg-AD (black circles) mice measured by VBM analysis.
 Results are presented as mean ± SEM. The significance of the alterations in GM volumes of the visual cortex along time and between groups was
 assessed by an ANOVA repeated measures (mixed-effects) followed by a Bonferroni post hoc test. **p < 0.01 and ***p < 0.001. nWT = 6, n3×Tg-AD = 7
Chiquita et al. Alzheimer's Research & Therapy                 (2019) 11:90                                                                               Page 11 of 16

Table 1 Correlations of photopic flicker (base) amplitude with retina and retinal cell layers thickness
                                               4 months                              8 months                              12 months                      16 months
Total retina (line scan)                       rS = − 0.2401 ns                      rS = − 0.6554***                      rS = − 0.6920***               rS = − 0.6822***
Total retina (circle scan)                     rS = − 0.5258**                       rS = − 0.6276***                      rS = − 0.7620***               rS = − 0.7157***
GCL+IPL (line scan)                            rS = − 0.3833*                        rS = − 0.6554***                      rS = − 0.6317***               rS = − 0.6763***
GCL+IPL (circle scan)                          rS = − 0.4070*                        rS = − 0.6970***                      rS = − 0.6937***               rS = − 0.7108***
INL+OPL (line scan)                            rS = − 0.2372 ns                      rS = − 0.5290**                       rS = − 0.5396**                rS = − 0.3801*
INL+OPL (circle scan)                          rS = − 0.0345 ns                      rS = − 0.3232 ns                      rS = − 0.5885***               rS = − 0.4265*
ONL (line scan)                                rS = − 0.0108 ns                      rS = − 0.0792 ns                      rS = 0.5521**                  rS = 0.4663**
ONL (circle scan)                              rS = 0.0296 ns                        rS = − 0.0016 ns                      rS = 0.3765*                   rS = 0.5493**
IS+OS (line scan)                              rS = − 0.1039 ns                      rS = − 0.7188***                      rS = − 0.7614***               rS = − 0.6525***
IS+OS (circle scan)                            rS = − 0.3707*                        rS = − 0.6885***                      rS = − 0.8194***               rS = − 0.7771***
(ncircle scan = 30, nline scan = 32). rS quantifies Spearman correlation. ns not significant, *p < 0.05, **p < 0.01, and ***p < 0.00

due to their distinct biochemical, physiological, and                                       evaluation of the response to treatment in such preclin-
structural features in several organs including the brain                                   ical models. Therefore, our work does corroborate the
[57–59]. It was reported that 3×Tg-AD male mice                                             notion that AD animal models can be used to assess ret-
present a delayed and milder phenotype compared to                                          inal changes and the impact of neurodegeneration [5].
female counterparts [60]. However, we recently showed                                       From the best of our knowledge, the present study de-
that 3×Tg-AD male mice present pathological and neu-                                        scribed, for the first time, the retinal structural and func-
robehavioral features of AD, with early-onset recognition                                   tional changes in 3×Tg-AD animal model. At 4 months
memory loss and reduction of hippocampal volume [52].                                       of age, we observed the thinning of GCL+IPL and of
Other studies also demonstrated that male mice present                                      total retina both for circle and line scans, in 3×Tg-AD
AD features [61–63]. Therefore, 3×Tg-AD male mice re-                                       mice. We also detected the thinning of INL+OPL in
main a valuable experimental model. Concerning the                                          OCT line scan acquisitions. These observations suggest
animal model, we further add that mice here used were                                       that the first signs of retinal impairment in AD start at
dark eyes. Eventual differences in mice with dark eyes vs                                   the innermost layers. With this observation, we cannot
albino mice may be interesting to address in future                                         discard the possibility that transsynaptic degeneration,
studies.                                                                                    from the brain to the retina, may occur. Another possi-
  Several studies in AD patients, in which retinal thick-                                   bility is that some changes start occurring in the retina,
ness was evaluated by OCT, have reported a thinning in                                      even before or at least at the same time they start occur-
the retina [21, 22, 64, 65]. Here, we replicated this find-                                 ring in the brain, although this could not be ascertained.
ing in an animal model, suggesting that OCT may be                                          From 8 months onwards, we observed the thinning of
useful for an early diagnosis of AD and also for the                                        total retina, GCL+IPL, INL+OPL, and IS+OS of 3×Tg-

Table 2 Summary of the main retinal (structural and functional) and brain (visual cortex) changes in 3×Tg-AD mice
Retinal structure (layer thickness)
Total retina            GCL+IPL                                    INL+OPL                                       ONL                   IS+OS
↓                       ↓                                          ↓                                             ↑                     ↓
Retinal function
ERG
Scotopic                                                                                    Photopic             Flicker
amix                    brod                  bmix                 OP1                      bcone                Base wave             First harmonic   Second harmonic
↑ Amplitude             ↑ Amplitude           ↑ Amplitude          ↑ Amplitude              ↑ Amplitude          ↑ Amplitude           ↑ Amplitude      ↑ Amplitude
↓ Time to peak                                                     ↓ Time to peak                                ↓ Phase               ↓ Phase          ↑ Phase
PERG
No changes
Brain (visual cortex)
↓ Gray matter volume
Chiquita et al. Alzheimer's Research & Therapy (2019) 11:90 Page 12 of 16 AD mice. The thinning observed in the inner retina, were previously observed in a mouse model of Down earlier, at 4 months, seemed to spread to almost every syndrome, in which specific changes in layer thickness analyzed retinal layer. This might be due to secondary were also found [66]. In fact, Aβ deposition has been de- degeneration, a phenomenon in which synapses and tected both in AD and Down syndrome patients [67]. In neurons in the neighborhood of originally affected neu- Down syndrome patients, the neurodegenerative pro- rons are also affected. The retinal thinning here ob- cesses associated with AD are also expressed. Moreover, served, even at early time points, is an important finding APP gene is located at chromosome 21, and Down syn- that corroborates previous results obtained in humans, drome patients have an extra copy of this chromosome, in which OCT results clearly show that there is retinal thus leading to the development of early onset dementia thinning in AD patients [10, 23, 65]. Despite the general- with AD characteristics [68, 69]. This may entail that ized thinning of several layers of the retina, there was there is a common phenotype in the retina between AD also an increase in the thickness of the ONL of 3×Tg- and Down syndrome patients. AD mice compared to age-matched WT mice. The Early differences in the ERG response between 3×Tg-AD thickening of ONL is not easy to explain, but we cannot and WT were observed at the photoreceptor level. In this exclude that it might have a developmental cause. study, WT animals were chosen according to the genetic The aim of this research work was to perform a longi- background from which 3×Tg-AD mice were generated. It tudinal in vivo study, using the same animals for the dif- seems that the introduction of human genes that have been ferent experimental techniques utilized in each time associated with AD had an opposite effect to what was point. We did not aim to go deeper in the structural expected, if one assumes that the effects of this genetic changes of the retina and the cortex. We believe that a manipulation impact only on neurodegeneration. However, longitudinal in vivo study has much more relevance for if developmental effects are also present, as suggested by the clinical setting. Moreover, OCT is the technique the increased thickness of ONL, then this might explain widely used in clinical evaluation to assess the retina increased fERG responses in 3×Tg-AD mice. In general, we and, in particular, retinal layer thickness. In the context observed that fERG signal amplitude, which mainly of our study, having very small changes in retinal thick- originates from the outer retina, was higher in 3×Tg- ness, histological examination would not definitely be a AD mice than in WT mice. However, regarding the good approach. Actually, it would be unlikely to detect inner retinal responses from RGC evaluated by PERG, significant changes using histology. Histological analysis we did not observe any statistically significant differ- also requires the use of different animals in each time ence between both groups. In previous studies in point, which would not be feasible in a longitudinal humans, results obtained with PERG recordings are study. Moreover, it would be impossible to obtain slices contradictory. Actually, some studies show abnormal exactly in the same region of the retina whereas, by pattern electroretinograms and visual evoked potentials OCT, we were able to analyze the same region of the in AD patients [70–73], whereas others report normal retina. Also, tissue collection and preparation for histo- retinal function [27, 74, 75]. In PERG recordings, P1 is logical analysis affects retinal structure, and therefore, driven by ON pathway while N2 is driven by OFF path- the thickness measured would not be as reliable. The way [76]. We did not observe statistically significant same applies to the brain. For instance, we evaluated the differences in P1 and N2 parameters between 3×Tg-AD volume of the visual cortex in vivo, by MRI, and this is and WT mice meaning that RGC function is not sig- much more reliable than calculating the volume based nificantly impaired in this AD animal model. on histological analysis of the brain. Since both structural and functional changes were Regarding retinal electrophysiology, scotopic and pho- observed in the retina, at all time points, the possible topic b-wave amplitudes of 3×Tg-AD and WT mice causal links (early neurodegenerative or neurodevelop- were significantly different at various time points. We mental) on structure and function remain somehow observed alterations in b-wave amplitude of 3×Tg-AD elusive. In order to better understand the retinal mice at 4, 8, 12, and 16 months of age, which suggests physiological changes in this AD animal model, it the existence of physiological modifications in bipolar would be essential to perform either multielectrode cells. The increased amplitude values observed in fERG array or patch clamp recordings, which would enable responses, originated from the outer retina, are consist- to determine more precisely the changes in retinal re- ent with the increased ONL thickness that we found. sponse properties to a given light stimulus. Visual Moreover, the scotopic time to peak in the a-wave and evoked potential recordings would enable to deter- OP1 was shorter in 3×Tg-AD mice. Abnormal scotopic mine if visual information transmitted from the retina b-wave implicit time and decreased a-wave amplitude to the brain is impaired. have been also reported in 3×Tg-AD mice [41]. Further- Previous studies have been published reporting retinal more, higher scotopic and photopic b-wave amplitudes molecular and cellular changes in 3×Tg-AD mice.
Chiquita et al. Alzheimer's Research & Therapy   (2019) 11:90                                                                    Page 13 of 16

Profound alterations in retinal tau, including abnormal          noninvasive, low-cost method and an additional tool for
accumulation, phosphorylation, and missorting were               preclinical research in AD. In addition, the 3×Tg-AD
already described in 3×Tg-AD mice, at 3 months of age            mouse model may be used as a potential tool for pre-
[77]. These pathological changes are likely to cause sub-        clinical studies in which retinal structural and functional
stantial retinal neuron dysfunction and subsequent               changes could be correlated with brain impairments
death. The presence of Aβ plaques, tau tangles, neurode-         detected by neuroimaging, which may be quite useful for
generation, and astrogliosis in the retinal ganglion cell        preclinical drug trials. The results emerging from the
layer was described in 3×Tg-AD mice, at 1–5 months of            present research assume particular importance because
age. An anti-inflammatory phenotype of retinal micro-            they enable the establishment of a model in which ret-
glial cells, at 1–5 months, which then evolves to a pro-         inal manifestations of AD are observed at an early time
inflammatory phenotype, at 12–18 months, was also de-            point. Moreover, our results emphasize the possibility of
scribed [78]. Several proteins related to oxidative stress,      retinal biomarker assessment in AD.
light-dependent processes (e.g., Sag), synaptic functions,        Supplementary information
metabolism, and energy production in retina were found           Supplementary information accompanies this paper at https://doi.org/10.
                                                                 1186/s13195-019-0542-8.
to be dysregulated in 3×Tg-AD mice, at 2, 4, and 6
months of age [79]. It is therefore clear that there are          Additional file 1: Figure S1. OCT scan acquisition. Figure S2. Retinal
several molecular and cellular alterations in the retina of       layers visualized by OCT. Figure S3. Thickness of different retinal layers in
3×Tg-AD, even at early time points, which can contrib-            WT and 3×Tg-AD mice at 4, 8, 12 and 16 months of age, based on
                                                                  in vivo OCT circle scans. Figure S4. Scotopic a-wave time to peak in WT
ute to functional alterations that we observed. However,          and 3×Tg-AD mice, at 4, 8, 12 and 16 months of age, as response to
it is difficult to identify a particular molecular or cellular    several light stimuli. Figure S5. Linear regression fit to scotopic b-wave
alteration that is responsible for a particular electro-          amplitude at 0.0095 cd.s/m2 and 9.49 cd.s/m2 in WT and 3×Tg-AD mice.
                                                                  Figure S6. OP1 time to peak values at 4, 8, 12 and 16 months of age,
physiological alteration.                                         based on fERG analysis. Figure S7. Linear regression fit to base wave, first
   Our results also suggest that there is a positive correl-      harmonic and second harmonic amplitudes and phases in WT and 3×Tg-
ation between retinal thickness and GM volume of the              AD mice. Figure S8. Spearman correlation between total retinal thickness
                                                                  and grey matter volume of the visual cortex, and photopic flicker
visual cortex, while ERG flicker amplitude is negatively          response amplitude and grey matter volume of the visual cortex.
correlated with retinal and cortical structural measure-
ments. However, it is quite difficult to identify the bio-
                                                                 Abbreviations
logical basis for these nonlinear (Spearman) correlations        3×Tg-AD: Triple transgenic mouse model of Alzheimer’s disease;
and, for example, why changes occurring in the visual            AD: Alzheimer’s disease; Aβ: Amyloid beta; CSF: Cerebrospinal fluid;
cortex could contribute for the thinning or thickening of        ERG: Electroretinography; fERG: Flash electroretinography; GCL: Ganglion cell
                                                                 layer; GM: Gray matter; INL: Inner nuclear layer; IPL: Inner plexiform layer;
the retina. In fact, there may be several causes, such as        IS: Inner segment; MRI: Magnetic resonance imaging; OCT: Optical coherence
developmental impacts or other indirect effects, that            tomography; ONL: Outer nuclear layer; OP: Oscillatory potentials; OPL: Outer
could lead to these correlations. In our opinion, similar        plexiform layer; OS: Outer segment; PERG: Pattern electroretinography;
                                                                 RGC: Retinal ganglion cell; RNFL: Retinal nerve fiber layer; WM: White matter;
pathophysiological mechanisms may occur in the brain             WT: Wild type
and retina, since both structures are part of the CNS.              Acknowledgements
However, what is happening in the visual cortex does             We do thank Otília C. d’Almeida, (Laboratory for Biostatistics and Medical
not necessarily affect, at least directly, the retina. These     Informatics, Faculty of Medicine of the University of Coimbra) for statistical
                                                                 analysis counseling.
associations further suggest that enhanced ERG re-
sponses may actually reflect a retinal impairment, as also
                                                                 Authors’ contributions
suggested by Laguna and colleagues [59]. Accordingly,            SC did the data acquisition, data analysis, and writing of the original draft.
we show that retinal structural and functional changes           EJC did the data analysis, writing, review, and editing. JC did the data
                                                                 analysis and writing of the original draft. MR did the data analysis and
are associated with visual cortex alterations, thus having
                                                                 writing of the original draft. JS did the data acquisition. PIM did the
potential impact on early AD diagnosis.                          conceptualization, writing, review, and editing. MCB did the
                                                                 conceptualization, data analysis, funding acquisition, project administration,
                                                                 resources, supervision, writing, review, and editing. AFA did the
Conclusions
                                                                 conceptualization, data analysis, funding acquisition, project administration,
In this longitudinal in vivo study, the 3×Tg-AD mouse            resources, supervision, writing, review, and editing. All authors read and
model allowed the identification of structural and neuro-        approved the submitted version.
physiological alterations in the retina, as well as changes
in gray matter volume in the visual cortex. These retino-        Funding
                                                                 This work was supported by the Santa Casa Mantero Belard Award 2015
cortical alterations showed an early onset and remained          (MB-1049-2015), FCT (SFRH/BD/52045/2012, SFRH/BPD/93672/2013, PEst UID/
persistent over time. Some of these changes appear to be         NEU/04539/2013 and UID/NEU/04539/2019, and MEDPERSYST SAICTPAC/
of neurodegenerative nature, as expressed by retinal and         0010/2015), COMPETE-FEDER (POCI-01-0145-FEDER-007440 and POCI-01-
                                                                 0145-FEDER-016428), and Centro 2020 Regional Operational Programme
brain thinning. Since the retina is an optically accessible      (CENTRO-01-0145-FEDER-000008: BrainHealth 2020 and CENTRO-01-0145-
part of the brain, OCT may become a feasible,                    FEDER-000016:BIGDATIMAGE).
Chiquita et al. Alzheimer's Research & Therapy (2019) 11:90 Page 14 of 16
Availability of data and materials 12. Chang LY, Lowe J, Ardiles A, Lim J, Grey AC, Robertson K, et al.
All data generated or analyzed during this study are included in this Alzheimer’s disease in the human eye. Clinical tests that identify
published article and its additional files. ocular and visual information processing deficit as biomarkers.
Alzheimers Dement. 2014;10(2):251–61.
Ethics approval and consent to participate 13. Tzekov R, Mullan M. Vision function abnormalities in Alzheimer disease. Surv
All procedures involving animals were approved by the Animal Welfare Ophthalmol. 2014;59(4):414–33.
Committee of the Coimbra Institute for Clinical and Biomedical Research 14. Hart NJ, Koronyo Y, Black KL, Koronyo-Hamaoui M. Ocular indicators
(iCBR), Faculty of Medicine, University of Coimbra. The animal of Alzheimer’s: exploring disease in the retina. Acta Neuropathol.
experimentation was conducted in accordance with the European 2016;132(6):767–87.
Community directive guidelines for the use of animals in laboratory (2010/ 15. Javaid FZ, Brenton J, Guo L, Cordeiro MF. Visual and ocular
63/EU), transposed into the Portuguese law in 2013 (Decreto-Lei 113/2013), manifestations of Alzheimer’s disease and their use as biomarkers for
and with the Association for Research in Vision and Ophthalmology (ARVO) diagnosis and progression. Front Neurol. 2016;7:55.
statement for animal use. 16. Doustar J, Torbati T, Black KL, Koronyo Y, Koronyo-Hamaoui M. Optical
coherence tomography in Alzheimer’s disease and other
neurodegenerative diseases. Front Neurol. 2017;8:701.
Consent for publication 17. Frohman EM, Fujimoto JG, Frohman TC, Calabresi PA, Cutter G, Balcer
Not applicable. LJ. Optical coherence tomography: a window into the mechanisms of
multiple sclerosis. Nat Rev Neurol. 2008;4(12):664.
Competing interests 18. Marziani E, Pomati S, Ramolfo P, Cigada M, Giani A, Mariani C, et al.
The authors declare that they have no competing interests. Evaluation of retinal nerve fiber layer and ganglion cell layer
thickness in Alzheimer's disease using spectral-domain optical
Author details coherence tomography. Invest Ophthalmol Vis Sci. 2013;54(9):5953–8.
1
Coimbra Institute for Clinical and Biomedical Research (iCBR), Faculty of 19. Bayhan HA, Aslan Bayhan S, Tanık N, Gürdal C. The association of
Medicine, University of Coimbra, 3000-548 Coimbra, Portugal. 2CNC.IBILI spectral-domain optical coherence tomography determined ganglion
Consortium, University of Coimbra, 3004-504 Coimbra, Portugal. 3Coimbra cell complex parameters and disease severity in Parkinson’s disease.
Institute for Biomedical Imaging and Translational Research (CIBIT), University Curr Eye Res. 2014;39(11):1117–22.
of Coimbra, 3000-548 Coimbra, Portugal. 4Institute for Nuclear Sciences 20. Garcia-Martin E, Larrosa JM, Polo V, Satue M, Marques ML, Alarcia R,
Applied to Health (ICNAS), University of Coimbra, 3000-548 Coimbra, et al. Distribution of retinal layer atrophy in patients with Parkinson
Portugal. 5Center for Neuroscience and Cell Biology (CNC), University of disease and association with disease severity and duration. Am J
Coimbra, 3004-517 Coimbra, Portugal. 6Institute of Physiology, Faculty of Ophthalmol. 2014;157(2):470–8. e2.
Medicine, University of Coimbra, 3004-517 Coimbra, Portugal. 21. Cunha JP, Proença R, Dias-Santos A, Almeida R, Águas H, Alves M,
et al. OCT in Alzheimer’s disease: thinning of the RNFL and superior
Received: 20 May 2019 Accepted: 22 September 2019 hemiretina. Graefes Arch Clin Exp Ophthalmol. 2017;255(9):1827–35.
22. Paquet C, Boissonnot M, Roger F, Dighiero P, Gil R, Hugon J.
Abnormal retinal thickness in patients with mild cognitive impairment
References and Alzheimer’s disease. Neurosci Lett. 2007;420(2):97–9.
1. London A, Benhar I, Schwartz M. The retina as a window to the 23. Liu D, Zhang L, Li Z, Zhang X, Wu Y, Yang H, et al. Thinner changes
brain—from eye research to CNS disorders. Nat Rev Neurol. 2013;9(1):44–53. of the retinal never fiber layer in patients with mild cognitive
2. Sperling RA, Aisen PS, Beckett LA, Bennett DA, Craft S, Fagan AM, et al. impairment and Alzheimer’s disease. BMC Neurol. 2015;1:14.
Toward defining the preclinical stages of Alzheimer’s disease: 24. Shi Z, Zhu Y, Wang M, Wu Y, Cao J, Li C, et al. The utilization of
recommendations from the National Institute on Aging-Alzheimer’s retinal nerve fiber layer thickness to predict cognitive deterioration. J
Association workgroups on diagnostic guidelines for Alzheimer's disease. Alzheimers Dis. 2016;49(2):399–405.
Alzheimers Dement. 2011;7(3):280–92. 25. Trebbastoni A, D’Antonio F, Bruscolini A, Marcelli M, Cecere M,
3. Jack CR, Knopman DS, Jagust WJ, Petersen RC, Weiner MW, Aisen PS, Campanelli A, et al. Retinal nerve fibre layer thickness changes in
et al. Tracking pathophysiological processes in Alzheimer’s disease: an Alzheimer’s disease: results from a 12-month prospective case series.
updated hypothetical model of dynamic biomarkers. Lancet Neurol. Neurosci Lett. 2016;629:165–70.
2013;12(2):207–16. 26. Cronin-Golomb A, Rizzo JF, Corkin S, Growdon JH. Visual function in
4. Sutphen CL, Fagan AM, Holtzman DM. Progress update: fluid and imaging Alzheimer's disease and normal aging. Ann NY Acad. 1991;640(1):28–35.
biomarkers in Alzheimer’s disease. Biol Psychiatry. 2014;75(7):520–6. 27. Justino L, Kergoat M-J, Bergman H, Chertkow H, Robillard A, Kergoat H.
5. Lim JK, He Z, Vingrys AJ, Chinnery HR, Li Q-X, Bui BV, et al. Age-related Neuroretinal function is normal in early dementia of the Alzheimer type.
changes in retinal structure and function in a mouse model of Alzheimer’s Neurobiol Aging. 2001;22(4):691–5.
disease. Invest Ophthalmol Vis Sci. 2016;57(12):613. 28. Kergoat H, Kergoat MJ, Justino L, Chertkow H, Robillard A, Bergman H. An
6. Frost S, Martins RN, Kanagasingam Y. Ocular biomarkers for early detection evaluation of the retinal nerve fiber layer thickness by scanning laser
of Alzheimer's disease. J Alzheimers Dis. 2010;22(1):1–16. polarimetry in individuals with dementia of the Alzheimer type. Acta
7. Iseri PK, Altinas Ö, Tokay T, Yüksel N. Relationship between cognitive Ophthalmol. 2001;79(2):187–91.
impairment and retinal morphological and visual functional abnormalities in 29. Lad EM, Mukherjee D, Stinnett SS, Cousins SW, Potter GG, Burke JR, et al.
Alzheimer disease. J Neuroophthalmol. 2006;26(1):18–24. Evaluation of inner retinal layers as biomarkers in mild cognitive impairment to
8. Lu Y, Li Z, Zhang X, Ming B, Jia J, Wang R, et al. Retinal nerve fiber layer moderate Alzheimer’s disease. PLoS One. 2018;13(2):e0192646.
structure abnormalities in early Alzheimer’s disease: evidence in optical 30. Cheung CY, Ong YT, Hilal S, Ikram MK, Low S, Ong YL, et al. Retinal
coherence tomography. Neurosci Lett. 2010;480(1):69–72. ganglion cell analysis using high-definition optical coherence
9. Satue M, Obis J, Rodrigo MJ, Otin S, Fuertes MI, Vilades E, et al. tomography in patients with mild cognitive impairment and
Optical coherence tomography as a biomarker for diagnosis, Alzheimer’s disease. J Alzheimers Dis. 2015;45(1):45–56.
progression, and prognosis of neurodegenerative diseases. J 31. Garcia-Martin E, Bambo MP, Marques ML, Satue M, Otin S, Larrosa JM,
Ophthalmol. 2016;2016:8503859. et al. Ganglion cell layer measurements correlate with disease severity
10. Parisi V, Restuccia R, Fattapposta F, Mina C, Bucci MG, Pierelli F. in patients with Alzheimer's disease. Acta Ophthalmol. 2016;94(6):
Morphological and functional retinal impairment in Alzheimer's disease e454–e9.
patients. Clin Neurophysiol. 2001;112(10):1860–7. 32. Choi SH, Park SJ, Kim NR. Macular ganglion cell -inner plexiform layer
11. Parisi V. Correlation between morphological and functional retinal thickness is associated with clinical progression in mild cognitive
impairment in patients affected by ocular hypertension, glaucoma, impairment and Alzheimers disease. PloS One. 2016;11(9):e0162202-e.
demyelinating optic neuritis and Alzheimer’s disease. Semin Ophthalmol. 33. den Haan J, Janssen SF, van de Kreeke JA, Scheltens P, Verbraak FD,
2003;18(2):50–7. Bouwman FH. Retinal thickness correlates with parietal cortical atrophy inYou can also read