Results of our 2019/20 audits of port companies - Office of the ...
←
→
Page content transcription
If your browser does not render page correctly, please read the page content below
B.29[21e]

Results of our
2019/20 audits
of port
companies
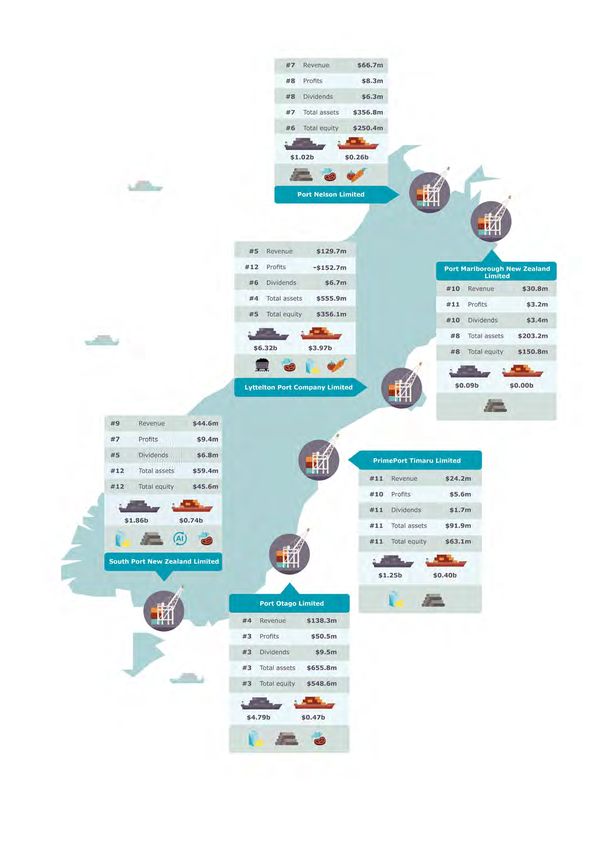
Photo acknowledgement:
mychillybin © Hugh Davies
B.29[21e]

Results of our
2019/20 audits of
port companies

Presented to the House of
Representatives under section 20 of
the Public Audit Act 2001.

July 2021
Contents

Auditor-General’s overview                                                                               4
Port company information for 2019/20                                                                     6
Part 1 – Introduction                                                                                    8
 Why we prepared this report                                                                             8
 The port companies covered in this report                                                               8
 Structure of this report                                                                               10

Part 2 – Profitability trends                                                                           11
 Consolidated profitability results of the port companies                                               11
 Port companies as a whole are profitable                                                               12
 There were significant movements in dividends                                                          14
 Why there is variability in port companies’ return on equity                                           15

Part 3 – Capital expenditure trends                                                                     17
 Port companies continue to invest in their assets                                                      17
 The importance of good business cases to support capital expenditure decisions                         19
 Lyttelton Port Company Limited                                                                         19
 The risk of over-investment by port companies                                                          21

Part 4 – The effects of Covid-19 on port companies during 2019/20                                       23
 Covid-19 affected port companies’ revenue                                                              23
 Port companies had to change how they operated, which led to additional costs                          24
 A change in tax rules had a minor benefit for port companies                                           25
 Assessing the carrying value of property, plant, and equipment and investment property                 25
 Port companies met their reporting deadlines                                                           26
 Emphasising the impact of Covid-19 in our audit reports                                                26
 The medium-term impact of Covid-19 on port companies                                                   27

Part 5 – Other matters arising from our audits                                                          28
 Environmental impact disclosures made by port companies                                                28
 Accounting for inland ports and freight hubs                                                           29
 Disclosures of major customers by port companies                                                       30

Appendix – Port companies’ 2019/20 information                                                          31
Figures
 1 – Main port company profitability results, 2015/16 to 2019/20                                        11
 2 – CentrePort’s recognised insurance revenue and earthquake-related expenditure, 2016/17 to 2019/20   13
 3 – Port companies’ reported return on equity, 2015/16 to 2019/20                                      15
 4 – Capital expenditure incurred by port companies, 2015/16 to 2019/20                                 18
 5 – Lyttelton Port Company Limited’s capital expenditure, 2010/11 to 2019/20                           20
 6 – Port companies’ financial information for 2019/20                                                  31
 7 – Port companies’ import and export information for 2019/20                                          31

                                                                                                             3
Auditor-General’s overview
E ngā mana, e ngā reo, e ngā karangarangatanga maha o te motu, tēnā koutou.
Ports are significant because of the part they play in New Zealand’s economy and
the capital invested in them. Ports are also significant because, for the most part,
they are owned by councils on behalf of the public.
Port companies face some major challenges, including their need to:
• make major capital investments when the financial returns from those
investments are uncertain;
• continue to respond to international trends in freight and logistics; and
• balance the potentially conflicting objectives of shareholders and other
stakeholders.
Added to this are the challenges and uncertainty from Covid-19.
It is difficult to compare port companies’ performance because of differences in
their ownership, the size and scale of their operations, and the way they measure
their assets.
I encourage port companies to consistently apply fair value in the valuation of
property, plant, and equipment. This will help provide up-to-date relevant financial
information to shareholders and enable better comparison and transparency of
port company financial performance.
Some port companies’ previous investment strategies have not delivered as
expected. This is most notable for Lyttelton Port Company Limited, where
$290 million of assets were written down over the last five years, in part because
the expected revenue associated with the new investment did not eventuate.
As port companies look to the future, many are considering significant new
investments. These might be to remain sustainable given international shipping
trends or to cater for anticipated growth. There is considerable risk in these
investments. Port companies need robust and realistic business cases to ensure
that these investments deliver the benefits expected of them.
There is also a risk that, without a comprehensive supply chain strategy for the
freight logistics sector, port companies will anticipate growth that competing port
companies might have also factored into their business cases. Stranded assets,
underperforming capital, and low returns or further asset write-downs are a likely
consequence of this.
I encourage port company boards – and, where appropriate, their shareholders –
to robustly assess the merits of significant capital investments before approving
4Auditor-General’s overview
those investments. This is to ensure that the assumptions these investments are
based on are realistic and are the best use of shareholder capital.
I thank staff and governors of port companies who worked hard to meet their
customers’ and shareholders’ expectations and uphold their accountability
responsibilities in an extremely challenging environment.
Nāku noa, nā
John Ryan
Controller and Auditor-General
15 June 2021
5Port company information
for 2019/20
6Port company information for 2019/20
71 Introduction
1.1 In this Part, we outline:
• why we prepared this report;
• the port companies covered in this report; and
• the structure of the report.
Why we prepared this report
1.2 This is the first formal report we have prepared about port companies. In previous
years, we reported our findings in other reports, such as our local government
reports, or in letters to chief executives and chairpersons of port companies.
However, we consider that the port sector had enough significant matters in
2019/20 for its own report.
1.3 We discuss several common trends that our audits of port companies identified.
We hope this report will prompt Parliament, the port companies, and the port
companies’ shareholders and other stakeholders to further discuss these trends.
The port companies covered in this report
Port Companies Act 1988
1.4 This report covers port companies incorporated under the Port Companies Act
1988 (the Act). The purpose of the Act is to promote and improve efficiency,
economy, and performance in the management and operation of the commercial
aspects of ports.
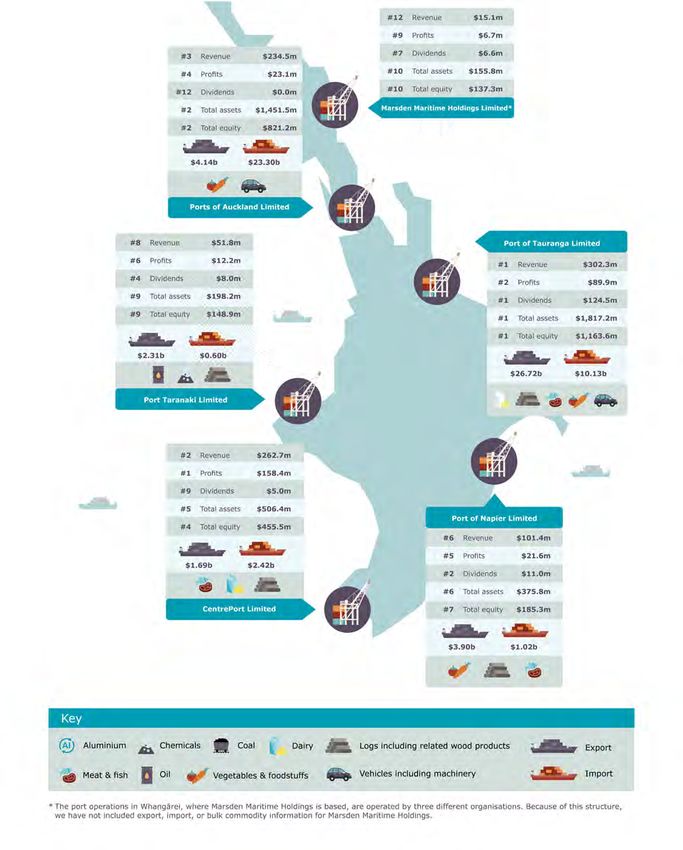
1.5 Currently, 12 port companies are incorporated under the Act. We show their
location and give an overview of each of them in “Port company information for
2019/20” (pages 6-7), and the Appendix provides a summary of their financial and
other information for 2019/20.
1.6 Section 19 of the Act defines all port companies as “public entities”. As public
entities, they are audited by the Auditor-General.
1.7 Most coastal centres in New Zealand will have some port infrastructure (such as
wharfs). This infrastructure will generally be regarded as community assets and
is owned by a council or a community organisation.1 This report does not cover
these assets.
Every port company needs to operate as a successful business
1.8 Section 5 of the Act states that the principal objective of every port company is
to operate as a successful business. The Act does not define what a successful
business is.
1 For example, Grey District Council owns the port assets based in Greymouth, and Trust Tairāwhiti owns Eastland
8 Group Limited, which operates the Eastland port based in Gisborne.Part 1
Introduction
1.9 In practice, port companies have worked with their owners to set out what it means
to be a successful business. For some port companies, success depends on their
ability to maximise returns for their shareholders. For others, their shareholders
expect them to have a range of objectives instead of just maximising returns.
1.10 For example, Port Taranaki’s mission is to “provide a safe harbour, services and
facilities that [its] customers can rely on to make trade easy and enable [the]
region to prosper” (emphasis in original quote).2 Lyttelton Port Company’s purpose
is to “sustainably facilitate trade for Canterbury”.3
There are significant differences between the port companies
1.11 Although the 12 port companies all operate ports, they have some significant
differences. This is partly because of their shareholders’ views of what being a
successful business means. There are also three important structural differences
between port companies: ownership, size and scale, and operations.
1.12 All the port companies are either majority or wholly owned by councils. However,
there are important ownership differences:
• Three port companies have publicly listed shares traded on New Zealand’s
Exchange (the NZX),4 although they are majority-owned by a council.5
• One port company is owned by a listed company, which is majority-owned by a
council.6
• One port company is partly owned by other port companies.7
• The other seven port companies are partly or wholly owned by one or two councils.
1.13 The port companies are also of different size and scale. The two largest port
companies are Port of Tauranga and Ports of Auckland. Based on their results for
2019/20, these two companies own 51% of all of the assets (by value) that are
owned by port companies in New Zealand and generate 38% of the revenue.
2 See Port Taranaki’s website at porttaranaki.co.nz.
3 Lyttelton Port Company (2020), Statement of intent: A sustainable port, page 5.
4 Commonly, these types of organisations are referred to as “listed companies”.
5 The listed port companies are Marsden Maritime Holdings Limited (majority-owned by Northland Regional
Council), Port of Tauranga (majority-owned by Bay of Plenty Regional Council through its company Quayside
Securities Limited), and South Port (majority-owned by Environment Southland). Ports of Auckland also owns
19.99% of Marsden Maritime Holdings.
6 Port of Napier is owned by Napier Port Holdings Limited, which was listed on the NZX in August 2019. Napier
Port Holdings is majority-owned by Hawke’s Bay Regional Council through its holding company Hawke’s Bay
Regional Investment Company Limited. Before listing, Port of Napier was 100% owned by Hawke’s Bay Regional
Investment Company Limited.
7 PrimePort is 50% owned by Port of Tauranga and 50% by Timaru District Council through its holding company
Timaru District Holdings Limited. 9Part 1
Introduction
1.14 Tauranga is New Zealand’s largest export port (48% of total exports by value in
2020 went through that port). Auckland is the largest import port (receiving 51%
of total imports by value). By comparison, the five smallest port companies own
11% of assets, generate 13% of revenue, and process less than 15% of the exports
and imports that go through New Zealand ports.8
1.15 Some of the port companies have operations that are not part of their core port
operations. Generally, these operations complement their core port operations.
For example:
• Port of Tauranga and Ports of Auckland have investments in freight logistics
businesses.
• Six ports9 have invested in inland ports or freight hubs10 that help transfer
freight to or from the port.
• Many port companies own properties that are leased to third parties. Port
Otago, in particular, has an investment property portfolio in Dunedin,
Auckland, and Hamilton, with some commercial property development.
1.16 By comparison, Marsden Maritime Holdings Limited port operations are
incorporated into a joint venture company, Northport Limited. Marsden Maritime
Holdings also owns property in the area adjacent to the port operations and
operates the Marsden Cove Marina complex. Port of Tauranga owns the remainder
of Northport.
1.17 These differences in ownership, size and scale, and operations make it more
difficult to directly compare the performance of port companies.
Structure of this report
1.18 Part 2 examines the recent financial results of port companies and the
profitability trends apparent from their results.
1.19 Part 3 discusses the capital expenditure trends of port companies.
1.20 Part 4 summarises the impact of Covid-19 on port companies during 2019/20.
1.21 Part 5 sets out other matters that we have considered in our 2019/20 audits of
port companies.
8 We note that a key driver of port company revenue is the volume of imports and exports going through a port.
Port of Tauranga Limited processed 15.8 million tonnes of exports and 9.0 million tonnes of imports.
9 These ports are CentrePort, Lyttelton Port Company, Ports of Auckland, Port of Napier, Port of Tauranga, and
South Port.
10 10 We discuss the differences between freight hubs and inland ports in paragraphs 5.12-5.15.Profitability trends 2
2.1 In this Part, we discuss:
• the consolidated profitability results of port companies;
• that port companies as a whole are profitable;
• that there were significant movements in dividends; and
• variability in port companies’ return on equity.
2.2 As noted in paragraphs 1.11 to 1.17, the port companies vary significantly in their
ownership, size and scale, and operations. This limits how much comparative
analysis we can do.
Consolidated profitability results of the port companies
2.3 We analysed the consolidated financial information of the port companies for
2015/16 to 2019/20. The consolidated financial information includes the port
companies’ wider business, not just the results for the core port operations.
2.4 Figure 1 shows the main profitability information the port companies reported.
Figure 1
Main port company profitability results, 2015/16 to 2019/20
2019/20 2018/19 2017/18 2016/17 2015/16
Revenue ($million) 1,426.8 1,425.1 1,275.7 1,261.7 1,045.9
Net profit after tax 247.1 395.6 347.2 320.7 209.9
($million)
Net profit as a 17.3% 27.8% 27.2% 25.4% 20.1%
percentage of
revenue*
Net profit as a 5.8% 9.5% 8.8% 9.0% 6.2%
percentage of
equity*
Dividends 200.4 287.9 236.5 225.0 173.9
($million)
Dividends as a 4.7% 6.9% 6.0% 6.3% 5.1%
percentage of
equity*
*The net profit and dividend percentages are calculated on total net profit and total dividends for all port companies
compared with total revenue and total equity.
Note: Port companies use either a 30 June or a 30 September year-end for financial reporting purposes. We have
made no adjustment for the different financial year-ends in Figure 1.
Source: We sourced the dollar amounts from the annual reports of the 12 port companies.
11Part 2
Profitability trends
Port companies as a whole are profitable
2.5 Figure 1 shows that port companies as a whole reported increasing revenue and
profits from 2015/16 to 2018/19. The port companies also provided an increasing
level of dividends (in dollar terms) to their shareholders.
2.6 However, this trend changed in 2019/20. Although revenue increased by less
than $2 million compared to 2018/19 (0.1%), net profit after tax decreased by
$148.5 million (37.5%) and dividends paid to shareholders decreased by
$87.5 million (30.4%).
2.7 From our analysis of port companies’ audited financial statements, the change
in 2019/20 was not primarily caused by Covid-19 (we discuss the effects of
Covid-19 on port companies in Part 4). Instead, significant one-off events affected
individual port companies and, in turn, the port sector. We discuss them below.
Lyttelton Port Company Limited
2.8 In 2015/16, Lyttelton Port Company recognised an impairment expense of
$99.5 million, which led to it recording an after-tax loss of $59.8 million. The
impairment expense arose because the return generated by replacing assets
damaged by the Canterbury earthquakes, and some new capital expenditure to
meet expected growth, did not meet the investment return established by the
then directors of Lyttelton Port Company.11
2.9 In 2019/20, Lyttelton Port Company changed how it measured the value of
its property, plant, and equipment. Accounting standards12 allow companies
to measure their assets at cost (reduced for accumulated depreciation and
impairment) or fair value (in effect, the amount someone else would pay for
the asset).
2.10 In previous years, Lyttelton Port Company had measured its property, plant, and
equipment at cost. However, in 2019/20, it changed its approach to measuring
property, plant, and equipment from cost to fair value.
2.11 As a consequence, Lyttelton Port Company recognised a fair value asset reduction
of $190.5 million, which led to an after-tax loss of $152.7 million. We highlighted
this reduction in our audit report and referred readers to the disclosures Lyttelton
Port Company made in its audited financial statements, which provided more
information about how the reduction was determined.
2.12 We discuss the reasons for these asset write-downs in paragraphs 3.18 to 3.27.
11 Our 2015/16 audit report referred readers to the disclosures Lyttelton Port Company made in its audited financial
statements that provided more information about how the impairment was determined.
12 The relevant accounting standard is New Zealand Equivalent to International Accounting Standard 16: Property,
12 Plant and Equipment (NZ IAS 16).Part 2
Profitability trends
CentrePort Limited
2.13 The Kaikōura earthquake of 14 November 2016 caused significant damage
to CentrePort Limited’s property and infrastructure assets and commercial
properties. This had two main effects on CentrePort’s financial results from
2016/17 to 2019/20.
2.14 First, CentrePort recognised revenue related to its insurance claims. At the time
of the earthquake, CentrePort had cover for material damage and business
interruption of up to $600 million for its port property and infrastructure assets.
It also had cover of up to $276 million for its commercial property portfolio.
2.15 Between 2016/17 and 2019/20, CentrePort recognised insurance revenue of
$484.5 million (see Figure 2).13 CentrePort’s insurance claim was finalised in
2019/20.
2.16 Secondly, CentrePort recognised earthquake-related expenditure. This expenditure
related to the impairment of assets damaged in the earthquake, as well as
temporary costs incurred to repair assets or demolish assets that it no longer
needed. CentrePort recognised $154 million of these types of costs between
2016/17 and 2019/20 (see Figure 2).
Figure 2
CentrePort’s recognised insurance revenue and earthquake-related expenditure,
2016/17 to 2019/20
2019/20
2018/19
2017/18
2016/17
-100 -50 0 50 100 150 200
$million
Earthquake-related expenditure Insurance revenue
Source: CentrePort’s 2016/17 to 2019/20 annual reports.
13 CentrePort’s associate property entities recognised $163 million in insurance revenue from their insurance claims.
The claims were for damage to commercial property buildings that were owned by the associate property entities. 13Part 2
Profitability trends
2.17 In our 2019/20 audit report, we referred readers to the disclosures CentrePort
made in its audited financial statements that discussed the impact of the
2016 Kaikōura earthquake on the company, summarised the insurance claim
settlement, and summarised the impacts on other parts of the financial
statements, including income tax.14
There were significant movements in dividends
2.18 Dividends that port companies pay have been subject to some significant changes:
• in 2016/17, dividends increased by 29% to $225.0 million;
• in 2018/19, dividends increased by 22% to $287.9 million; and
• in 2019/20, dividends decreased by 30% to $200.4 million.
2.19 The increase in 2016/17 was mainly from a special dividend that Port of Tauranga
paid to its shareholders. This was done as part of a capital restructure that aimed
to return funds to shareholders over four years.
2.20 The increase in 2018/19 was primarily because Port of Napier declared a special
dividend to its then shareholder Hawke’s Bay Regional Investment Company
Limited. This occurred before Napier Port Holdings Limited listed and became the
owner of Port of Napier.
2.21 The decrease in 2019/20 was primarily because:
• the previous year included the special dividend paid by Port of Napier; and
• Ports of Auckland did not pay a dividend in 2019/20, a decrease of
$45.9 million compared with the previous year. Ports of Auckland had agreed
with its shareholder to reduce its dividend while it invested significantly in
changing its business operations. For 2019/20, the dividends were set at
20% of after-tax profits.
2.22 Ports of Auckland declared a $4.9 million dividend for 2019/20, which was paid in
2020/21.
14 In our 2016/17, 2017/18, and 2018/19 audit reports, we referred readers to the disclosures the company made in
14 its audited financial statements describing the impact of the 2016 Kaikōura earthquake on the company.Part 2
Profitability trends
Why there is variability in port companies’ return on equity
2.23 We wrote a letter to all chief executives and chairpersons of port companies
in 2018 about the results of our 2016/17 audits.15 In that letter, we noted our
concerns about the variability in how individual port companies report their
returns. These concerns remain.
2.24 Figure 3 summarises the return on equity for all the port companies for 2015/16
to 2019/20. We have also included the average return on equity16. The average
return on equity has ranged between 6.6% (in 2019/20) and 10.8% (for 2016/17),
with the lower returns coinciding with the large financial losses recognised by
Lyttelton Port Company. However, Figure 3 also shows considerable variability
between port companies in any given year.
Figure 3
Port companies’ reported return on equity, 2015/16 to 2019/20
Greater than
30%
20%
10%
Return
0%
on equity
-10%
-20%
Less than
-30%
2015/16 2016/17 2017/18 2018/19 2019/20
Port companies that measure some or all of their Average return on equity
property, plant, and equipment at fair value
Port companies that do not measure their
property, plant, and equipment at fair value
Source: Analysis by the Office of the Auditor-General.
15 See Port companies: Matters arising from our 2016/17 audits, dated 19 June 2018, on our website,
oag.parliament.nz.
16 In this paragraph and in Figure 3, “return on equity” has been calculated as the average of all the port companies’
individual returns on equity. 15Part 2
Profitability trends
2.25 There are three main reasons why there is variability in the returns made by port
companies:
• Some port companies are more profitable.
• Some of the variability is because of one-off events, such as asset write-downs.
These one-off events have affected only two port companies (see paragraphs
2.8-2.17).
• Some of the variability in the reported returns is because the port companies
have different approaches to measuring the value of their property, plant,
and equipment. These variations arise because accounting standards allow
different approaches to be adopted in different circumstances. Paragraph
2.9 provides an example of this.
2.26 The first two reasons are because of how the port company operates. The third
reason is because of the accounting policies the port company chooses.
2.27 Of the 12 port companies, 10 measure at least some asset classes at fair value.
However, these 10 port companies do not consistently measure the same asset
classes at fair value. In nine cases, the fair value is not based on the expected cash
flows the assets can generate.
2.28 We remain concerned that these different approaches to measuring the value
of property, plant, and equipment make the performance of port companies less
transparent to stakeholders, Parliament, and the public. This means that it is
difficult to assess the performance of the individual port companies and the port
sector as a whole.
2.29 We consider that it is more appropriate to use fair value in operational asset
valuations and to assess the fair value based on the expected cash flows to be
generated. This will provide up-to-date financial information to stakeholders and
make the port sector’s performance more transparent.
2.30 In our 2018 letter to chief executives and chairpersons of port companies, we
urged port companies to review how they measure the value of their property,
plant, and equipment.17 Lyttelton Port Company followed our suggestion and now
measures its property, plant, and equipment at fair value, based on the expected
cash flows the assets can generate. We are aware that another port company has
been considering a similar change.
2.31 We continue to encourage port companies to review how they measure the value
of their property, plant, and equipment.
17 See Port companies: Matters arising from our 2016/17 audits, dated 19 June 2018, on our website,
16 oag.parliament.nz.Capital expenditure trends 3
3.1 In this Part, we discuss the capital expenditure trends in the 12 port companies.
We cover:
• the amount of investment the port companies made in their assets;
• the importance of having a good business case to support decisions about
capital expenditure;
• Lyttelton Port Company’s investment story; and
• the risk of over-investment in port companies.
3.2 Capital expenditure is generally defined as the money that an organisation spends
to buy, update, or improve long-term or fixed assets, such as property, plant,
buildings, technology, or equipment. This type of spending is intended to increase
the capability or capacity of the organisation’s operations or add some economic
benefit to its operations beyond the current year.
3.3 For this Part, we have characterised purchases of property, plant, and equipment,
investment property, and intangible assets as capital expenditure.
Port companies continue to invest in their assets
3.4 In the last five years, port companies have invested about $2 billion in their assets.
One of the main reasons that all port companies have invested in their assets is
because the ships visiting New Zealand’s ports are getting larger.
3.5 This is a trend that has gone on for many years. Since 2014, the percentage of
ships visiting New Zealand that can carry between 4000 and 6000 containers18
has increased from 34% to 62%. At the same time, the percentage of smaller ships
(that is, ships carrying fewer than 4000 containers) visiting New Zealand ports has
declined significantly.
3.6 Most of the capital expenditure of the port companies has been by a few
companies (see Figure 4). Ports of Auckland and Lyttelton Port Company have
spent more than half of the capital expenditure incurred by port companies in the
last five years.
3.7 These port companies’ capital expenditure has been for business transformation
purposes and, for Lyttelton Port Company, to repair assets damaged by the 2010
and 2011 Canterbury earthquakes.
3.8 Lyttelton Port Company had to rebuild its port after the 2010 and 2011
Canterbury earthquakes. This rebuild led to a wider expansion project. We discuss
Lyttelton Port Company in paragraphs 3.18-3.27.
18 The industry refers to a standard size for shipping containers as the “twenty-foot equivalent unit”. This is based
on the dimensions of a standard container – height 2.59 metres, width 2.44 metres, and length 6.10 metres. 17Part 3
Capital expenditure trends
3.9 Ports of Auckland has been working on improving its productivity by automating
certain operations (for example, purchasing a fleet of new autonomous straddle
carriers) and investing in its freight hubs.19 Automating port operations is a
trend we have seen in other port companies. However, they have also invested in
complementary areas, such as inland ports and commercial property.
Figure 4
Capital expenditure incurred by port companies, 2015/16 to 2019/20
500
400
300
$million
200
100
0
2015/16 2016/17 2017/18 2018/19 2019/20
Other port companies Port of Tauranga Limited
CentrePort Limited Lyttelton Port Company Limited
Port Otago Limited Ports of Auckland Limited
Source: The port companies’ annual reports.
We expect port companies’ investment in their assets to remain
significant
3.10 Port companies’ investment in their assets is likely to remain significant during
the next few years. Although Ports of Auckland and Lyttelton Port Company are
coming to the end of their current investment programme, other port companies
are starting theirs.
3.11 For example, CentrePort’s port assets were significantly damaged by the 2016
Kaikōura earthquake. As described in paragraph 2.15, CentrePort finalised its
insurance settlement in 2019/20. CentrePort has recently announced a port
redevelopment and regeneration plan, which it plans to use the insurance money
for. Completing this port redevelopment could take more than 10 years.
18 19 We describe “freight hubs” in paragraphs 5.13 and 5.15.Part 3
Capital expenditure trends
3.12 Port of Napier has begun constructing a new multi-purpose wharf. This is
intended to increase capacity to meet additional shipping demand and improve
supply chain efficiency. This investment is expected to cost Port of Napier between
$173 million and $190 million and is expected to be completed in late 2022.20
3.13 As well as investing in new assets, all port companies will need to continue to
reinvest in assets that are reaching the end of their useful lives.
The importance of good business cases to support capital
expenditure decisions
3.14 In the 2018 letter we wrote to chief executives and chairpersons of port
companies, we noted that it was difficult to form a view about whether the
capital expenditure of port companies was a good use of shareholders’ funds.21
This was because of the different approaches port companies used to measure
the value of their property, plant, and equipment (we discussed this in paragraphs
2.26-2.31).
3.15 Our view has not changed. We expect port companies making significant
investment decisions to prepare a robust business case that outlines the risks and
opportunities of the investment decision. We also expect senior management, the
board, and, as applicable, the shareholders to approve the business case before
the investment goes ahead.
3.16 Given how the increased uncertainty from Covid-19 is affecting the wider freight
logistics sector, business cases should actively consider and reflect that uncertainty.
3.17 Although reporting progress against their business cases might be considered
commercially sensitive, port companies should look at ways to describe their progress
so their shareholders can understand how their investments are being managed.
Lyttelton Port Company Limited
3.18 As outlined in paragraph 2.11, Lyttelton Port Company wrote down the value of
its assets by $190.5 million in 2019/20. This followed a write-down of its assets
by about $100 million in 2015/16. Together, these asset write-downs represent a
significant loss in shareholder value.
3.19 The 22 February 2011 earthquake was centred not far from the Lyttelton port. The
earthquake caused extensive damage to the port’s wharves and infrastructure.
However, it remained open and processed record volumes of containers, coal, and
log exports while carrying out repairs. Lyttelton Port Company was insured and
received insurance revenue of $438.3 million from its insurance claim.
20 These values exclude interest costs and applicable overheads.
21 See Port companies: Matters arising from our 2016/17 audits, dated 19 June 2018, on our website,
oag.parliament.nz . 19Part 3
Capital expenditure trends
3.20 Lyttelton Port Company’s board and management identified that the completed
repairs could not be permanent and that it would be necessary to rebuild a large
amount of the port. This led to the board reviewing the future of the Lyttelton port.
3.21 The outcome of that review was the Lyttelton Port Recovery Plan, which was
published in November 2015. The recovery plan was intended to provide a “road
map” for the port’s redevelopment.
3.22 It was estimated that the plan would cost about $1 billion to implement. At its
core, the plan was based on three objectives:
• replace damaged port assets with modern, fit-for-purpose infrastructure
needed for the safe, effective, and efficient operation of the port;
• reconfigure the port to improve efficiency and enable it to meet current and
predicted future shipping and logistical demand; and
• increase the resilience of the port and the greater Christchurch community
more generally.
3.23 Figure 5 shows Lyttelton Port Company’s capital expenditure since 2010/11. In
total, it has spent $680 million to date, with the largest capital expenditure in
2018/19 and 2019/20. For context, in 2010/11, Lyttelton Port Company recorded
a value for its property, plant, and equipment of $201 million. During the 10-year
period to 2019/20, Lyttelton Port Company’s revenue from its port operations
increased by 41% (excluding insurance revenue received).
Figure 5
Lyttelton Port Company Limited’s capital expenditure, 2010/11 to 2019/20
160
140
120
100
$million 80
60
40
20
0
2010/11 2011/12 2012/13 2013/14 2014/15 2015/16 2016/17 2017/18 2018/19 2019/20
Source: Lyttelton Port Company’s annual reports.
20Part 3
Capital expenditure trends
3.24 Financial reporting standards require Lyttelton Port Company to ensure that the
carrying value of its assets does not exceed the value of the future cash flows the
assets are expected to generate.22
3.25 If an organisation cannot generate the future cash flows to cover the cost of the
assets constructed or purchased, NZ IAS 36: Impairment of Assets requires the
organisation to reduce the value of the asset to what the asset’s future cash flows
can support.
3.26 The board wrote down the value of its assets by $290 million because:
• the expected growth in volumes did not occur;
• the company was unable to increase its prices enough to cover the cost of the
new investment; and
• although some of the assets built by the port company are expected to provide
wider community benefits, they will not provide the financial return it desired.
3.27 In discussing the asset write-down in its 2019/20 annual report, Lyttelton Port
Company stated:
This readjustment recognises that our asset value and our ability to generate
earnings in the current environment are out of line. It brings LPC’s value back in
line to reflect how much we can actually earn from our assets.23
The risk of over-investment by port companies
3.28 One risk that we see when looking at port companies and their plans to reinvest
in their businesses is excess investment or “stranded or underperforming assets”.
3.29 New Zealand is a small country with a proportionately large number of ports. It is
not feasible for every port to cater for the larger ships that transport the country’s
imports and exports. Although not every port company is planning to do this,
several are.
3.30 New Zealand’s economy can generate only so many ship and freight movements,
and expectations about the future rates of growth in freight are variable. Given
this uncertainty, port companies planning to invest to meet that growth should
be realistic about how much growth they assume. The example of Lyttelton Port
Company illustrates the loss of shareholder value that can come from investing
for growth that does not occur.
3.31 Because of the relative proximity of ports, there is considerable competition
between them. The push to increase revenue streams and profits has led some
port companies to invest outside of their traditional locations to obtain increased
22 The relevant accounting standard is New Zealand Equivalent to International Accounting Standard 36:
Impairment of Assets.
23 Lyttelton Port Company Limited (2020), Leading the way: Annual report 2020, page 4. 21Part 3
Capital expenditure trends
cargo volumes. For example, Port of Tauranga set up inland ports24 in Auckland
and Canterbury, and Ports of Auckland set up freight hubs in the Bay of Plenty and
Waikato regions.
3.32 Ports are public assets and are majority- owned by councils or community
interests. Therefore, there is a significant risk that, without a level of national
co-ordination, the collective investment of the port sector will not generate the
returns anticipated.
3.33 In our view, the lack of a comprehensive supply chain strategy for the wider freight
logistics sector heightens the risk of excess investment by port companies.
3.34 Our reference to a comprehensive supply chain strategy deliberately refers to the
freight logistics sector instead of the port sector. Port companies are one part of
the freight logistics sector and cannot be considered in isolation.
3.35 A comprehensive supply chain strategy could consider what level of investment
port companies will need in the future to respond to the effects of climate change
and new technologies for supply chains.
3.36 The Ministry of Transport indicated in its briefing to the incoming minister that
it is considering preparing a supply chain strategy for New Zealand. The Ministry
recently received approval from the Minister of Transport to initiate a freight and
supply chain strategy in the second half of 2021, with the intention of delivering
the strategy in the next 12-18 months. We support this initiative and encourage
the Ministry to include the above elements in its strategy.
22 24 We describe “inland ports” in paragraphs 5.12 and 5.15.The effects of Covid-19 on port
companies during 2019/20 4
4.1 In this Part, we summarise the main effects Covid-19 had on port companies
during 2019/20. We set out how:
• Covid-19 affected port companies’ revenue;
• port companies had to change how they operated;
• port companies received a minor benefit from a change in tax rules;
• port companies assessed the carrying value of property, plant, and equipment
and investment property;
• port companies met their reporting deadlines;
• we emphasised the effect of Covid-19 in our audit reports; and
• Covid-19 is likely to affect port companies in the medium term.
Covid-19 affected port companies’ revenue
4.2 When the country entered a nationwide lockdown in response to Covid-19, the
Government identified most port operations as “essential services”. This meant
they could continue operating during the lockdown. Port company staff were also
considered essential workers, allowing them to participate in daily port operations.
4.3 In Part 2, we set out port companies’ main financial results for 2019/20 (Figure
1). Excluding one-off effects relating to earthquakes, the total revenue of the port
sector decreased by about $80 million (6%). When analysing port companies’
annual reports, we were unable to determine how much of this decrease was
directly related to Covid-19.
4.4 A port company generates revenue by facilitating the transfer of goods to or from
ships. Therefore, a change in the quantity of imports or exports going through a
port will generally affect revenue. Many port companies’ annual reports described
a decrease in the exports and imports they facilitated, and some of these
decreases were because of Covid-19.
4.5 For example, exports of logs and related forestry commodities reduced by 10.3%,
which affected almost all port companies. These exports were significantly
affected by reduced international demand in the early days of Covid-19, as well as
an increase in the number of logs exported from Europe. Forestry operations were
not considered an essential service during the Alert Level 4 lockdown.
4.6 Some imports also decreased, especially vehicles (decreased by 23.2%) and
minerals, such as fuel (by 25%). These decreases occurred because of a drop in
demand as a result of lockdown.
4.7 Not all port companies were affected by the reductions in these imports to the
same extent. For example, Ports of Auckland was most affected by the decrease
23Part 4
The effects of Covid-19 on port companies during 2019/20
in vehicles, because most vehicles imported into the country come through that
port. Port of Tauranga was most affected by the reduction in imports of minerals.
4.8 A decrease in trade through New Zealand ports is broadly consistent with what
is happening in other countries. The United Nations Conference on Trade and
Development estimated that international trade decreased by 5% in the first quarter
of 2020, with decreases also expected to occur in the subsequent quarters.25
4.9 Several port companies reported that the cruise ship season finishing early also
caused them to lose revenue. Cruise ships could not enter New Zealand after the
maritime border was closed.
4.10 Port Marlborough and Northport (the joint venture operation of Marsden
Maritime Holdings and Port of Tauranga) were more affected by Covid-19 than
other port companies, so claimed the Government wage subsidy.26 Marsden
Maritime Holdings (in its own right) and Port of Napier also claimed, but
subsequently repaid, the wage subsidy.
Port companies had to change how they operated, which
led to additional costs
4.11 In 2019/20, port company expenditure increased by about $45 million (5.1%),
excluding the one-off effects of earthquakes described in paragraph 2.16. When
analysing port companies’ annual reports, we could not determine how much of
this increase was directly related to Covid-19.
4.12 Keeping ports operational during lockdown came at a cost for port companies.
Given the increased health and safety risk, port companies had to adjust their
operations and working practices. They also had to implement aspects of their
business continuity plans (including new sanitary protocols and processes). These
changes reduced productivity levels during the first weeks of lockdown and at
least until the revised procedures and protocols became normalised.
4.13 Many port companies have kept these new protocols in place under all Covid-19
alert levels.27
4.14 Some of the biggest ports benefited from having well-established business
continuity plans for emergencies. However, others had to prepare new plans to
meet the lockdown’s requirements.
25 United Nations Conference on Trade and Development (2021), Covid-19 and maritime transport: Impact and
responses, page 12.
26 In response to Covid-19, the Government’s economic priorities shifted to preserving jobs and protecting people’s
livelihoods. One of its responses was to introduce a wage subsidy scheme to support workers. The wage subsidy
was paid to employers, who were required to pass it on to employees.
27 In response to Covid-19, the Government put in place a four-level alert system. Each alert level introduces
24 more-stringent measures to protect people from contracting or spreading Covid-19.Part 4
The effects of Covid-19 on port companies during 2019/20
4.15 Some port companies also put in place other measures to control their
expenditure, although some of these will have a flow-on effect on 2020/21. These
measures included:
• reducing director remuneration for a specific period of time;
• instituting wage or salary freezes or deferring salary increases; and
• deferring non-urgent maintenance.
A change in tax rules had a minor benefit for port
companies
4.16 In response to Covid-19, the Government changed the tax rules to allow certain
taxpayers to deduct the depreciation on certain buildings from their taxable
income. Taxpayers have been unable to do this since the 2011/12 tax year.
4.17 This change in tax rules benefited all port companies. In 2019/20, the estimated
benefit of this change led to the port sector reducing its income tax expense
(and the related deferred tax liability recognised by port companies) by
$15 million.
Assessing the carrying value of property, plant, and
equipment and investment property
4.18 Port companies owned property, plant, and equipment valued at $4.8 billion as at
30 June 2020. Seven port companies also owned investment property (land and
buildings) valued at $0.8 billion as at 30 June 2020. These two classes of assets
make up most of port companies’ assets, which are recorded at $6.4 billion in total.
4.19 Every year, port companies are required to assess whether the carrying value of their
property, plant, and equipment needs to change. This usually involves considering
whether an asset value needs to be reduced because the asset is impaired.
4.20 For assets measured at fair value, port companies also need to consider whether
the asset value has changed.28 Additionally, port companies are required to value
investment property at the estimated fair value at each balance date.
4.21 These requirements meant that the port companies needed to consider whether
their largest asset values had changed. By necessity, this consideration took into
account the effects of Covid-19.
28 The applicable accounting standard, NZ IAS 16, requires that “revaluations shall be made with sufficient
regularity to ensure that the carrying amount does not differ materially from that which would be determined
using fair value at the end of the reporting period”. When revaluing, an asset value can go up or down. 25Part 4
The effects of Covid-19 on port companies during 2019/20
4.22 No port company directly decreased the value of its property, plant, and
equipment or investment property because of Covid-19. However, Lyttelton
Port Company noted that its consideration of Covid-19 in future years affected
the growth forecasts it used to estimate the fair value reduction referred to in
paragraph 2.11.
4.23 Covid-19’s economic impact significantly affected the level of uncertainty in the
assumptions port companies made when assessing the value of land and buildings
included in their property, plant, and equipment, and investment property.
4.24 Valuers engaged by port companies identified that, although land and property
prices had not changed significantly, there had been limited market information
available since the lockdown. This made it difficult to predict what the short-term
and long-term effects on values would be. Affected port companies appropriately
disclosed the risks identified by their valuers in their 2019/20 financial statements.
Port companies met their reporting deadlines
4.25 As a result of Covid-19, the Minister of Transport extended the statutory reporting
deadline for when port companies needed to adopt their audited financial
statements by two months. Listed companies have a different statutory reporting
deadline, although the Financial Markets Authority also extended this by two
months for companies with a balance date up to and including 31 July 2020.
4.26 All port companies met their revised statutory reporting deadlines, which is five
months after their financial year-end.
Emphasising the impact of Covid-19 in our audit reports
4.27 We issued unmodified audit opinions for the financial statements of all port
companies. However, almost all of our audit reports on the port companies
referred readers to the disclosures those port companies made about the impact
of Covid-19 on their operations.29
4.28 We did this because we felt that the readers of port companies’ financial
statements would be interested in the how the port company was affected by,
and responded to, Covid-19.
4.29 Our audit reports for listed companies (Marsden Maritime Holdings, Port of
Tauranga, and South Port) included a description of the key audit matters in those
audits. This was required because these port companies are listed entities.
26 29 We did not refer readers to Port of Napier’s Covid-19-related disclosures in our audit report.Part 4
The effects of Covid-19 on port companies during 2019/20
4.30 In describing the key audit matters, our auditors summarised how Covid-19
affected those matters. More often than not, our audit reports emphasised areas
of uncertainty from Covid-19, such as the valuation uncertainty referred to in
paragraph 4.24.
The medium-term impact of Covid-19 on port companies
4.31 Looking to 2020/21 and beyond, it is unclear how Covid-19 will affect port
companies. The nature of any economic recovery remains uncertain because it is
unclear how Covid-19 will evolve and what capacity the world economy has to
recover from lockdown measures other countries have used to slow the spread of
the virus.
4.32 Currently, Covid-19 still affects international shipping, which is leading to delays
in moving freight through ports in New Zealand and internationally. In New
Zealand, this has particularly affected Ports of Auckland in 2020/21. However,
there has been a subsequent flow-on effect to the other port companies.
4.33 Consequently, shipping companies are reconsidering what ports they visit and
how often. Exporters are facing a shortage of shipping containers to transport
some of New Zealand’s exports.
4.34 No cruise ships will visit our ports while New Zealand’s maritime border remains
closed to passengers. This will result in a loss of revenue for most port companies.
4.35 These factors will continue to adversely affect port companies’ profitability. The
continuing effect of Covid-19 should remain a focus for port companies’ boards,
management, shareholders, and wider stakeholders.
275 Other matters arising from our
audits
5.1 In this Part, we comment on other matters arising from our 2019/20 audits of
port companies. We discuss:
• the port companies’ disclosures about their environmental impact;
• the accounting for inland ports and freight hubs; and
• the disclosures of major customers by port companies listed on New Zealand’s
Exchange (the NZX).
Environmental impact disclosures made by port
companies
Some disclosure is happening
5.2 Changes to the environment, such as larger and more intense storms and rising
water levels, can significantly affect port companies. Port companies also need to
consider the impact they are having on the environment.
5.3 We reviewed the information port companies provided in their annual reports
about how they are managing their environmental impact. Most port companies
included disclosures in their annual reports about a variety of matters. We
summarise some of them below.
5.4 Three port companies30 disclosed in their annual reports that they have prepared
environmental strategies that are aligned with the United Nations Sustainable
Development Goals.31 This is helping them determine where to focus their efforts.
5.5 Port companies are increasingly mindful of their carbon footprint. Several port
companies have disclosed their current carbon footprint in their annual reports
and the mitigations they have put in place, or are putting in place, to reduce them.
5.6 Mitigations include decarbonising their vehicle fleets but this is more difficult for
some vehicles (such as straddles). Some port companies have goals of producing
zero emissions by 2040 or 2050.
5.7 Some port companies’ annual reports included a focus on improving the marine
environment by monitoring water quality and their discharges into water. This
focus will assist the port companies in determining future improvements to their
stormwater management.
Additional disclosures on climate risks might be needed
5.8 The Government has recently announced that certain organisations will be
required to report on climate risks. These reporting requirements will be based on
the Task Force on Climate-related Financial Disclosures framework, which is widely
30 These are CentrePort, Ports of Auckland, and Port of Napier.
28 31 For more information about the sustainable development goals, see www.un.org/sustainabledevelopment.Part 5
Other matters arising from our audits
acknowledged as international best practice. Affected organisations will need to
make annual disclosures about their governance arrangements, risk management,
and strategies for mitigating any climate change impacts.
5.9 If Parliament approves these new requirements, they will affect several port
companies.32 The types of disclosures required will likely be more detailed than
what port companies already disclose in their annual reports.
5.10 We encourage affected port companies to start considering what information
they will need to disclose and what information they will need to collect to meet
the reporting requirements.
Accounting for inland ports and freight hubs
5.11 As noted in paragraph 1.15, several port companies operate inland ports and
freight hubs. Because of concerns raised with us previously, we considered during
2019/20 how port companies should account for these types of operations in
their financial statements.
5.12 Inland ports are a direct extension of a seaport and are considered integral to the
port’s operations. Inland ports offer cargo customers an alternative delivery point
and thereby help to increase the volume of cargo moving through the seaport.
5.13 Freight hubs offer logistics services by providing facilities and services such
as warehousing, cross docking, cold storage, and providing and storing empty
containers. Third parties operate and lease these services and facilities. The third
parties will not necessarily provide these services and facilities to a port company
or its customers.
5.14 Although inland ports and freight hubs seem similar, they are different in
substance and require different accounting treatments.
5.15 Inland ports are owner-occupied property and are accounted for in keeping with
NZ IAS 16: Property, Plant and Equipment. Freight hubs, on the other hand,
are not owner-occupied and are accounted for in keeping with NZ IAS 40:
Investment Property.
5.16 We are satisfied that all port companies that currently operate inland ports and
freight hubs are correctly accounting for them in their financial statements. Port
companies that operated both inland ports and freight hubs had correctly applied
the accounting rules. They had appropriate factors in place that management
could use to determine how the different assets should be treated.
5.17 Accounting for inland ports and freight hubs can be a matter of significant
judgement for port companies. We have asked our auditors to confirm that port
32 All issuers listed on the NZX will be required to comply with the new climate-reporting requirements. This will
include the listed port companies and port companies that are owned by listed organisations. 29Part 5
Other matters arising from our audits
companies that have subsequently set up these types of operations are also
accounting for them correctly.
Disclosures of major customers by port companies
5.18 Listed companies must comply with NZ IFRS 8: Operating Segments (NZ IFRS 8).
The core principle of NZ IFRS 8 is that an organisation must disclose information
to enable readers of its financial statements to evaluate the nature and
financial effects of the business activities that it engages in and the economic
environments it operates in.
5.19 This is important for listed companies. They are typically large companies that can
operate in different industries and locations in New Zealand and internationally.
5.20 Paragraph 34 of NZ IFRS 8 requires an organisation to provide information about
the extent to which it relies on major customers. Specifically, an organisation
is required to disclose the total amount of revenue it receives from each single
external customer that contributes to more than 10% of its revenue.
5.21 Of the listed port companies, South Port New Zealand disclosed this in its
financial statements. Port of Tauranga did not include the disclosure. Marsden
Maritime Holdings was not required to make this disclosure as it did not have any
qualifying customers in 2019/20.
5.22 We consider that, although port companies should ordinarily make this disclosure,
it provides limited information to the readers of the financial statements. This is
because the user of the port decides which shipping company (which the port
company receives revenue from) transports the freight through the port, rather
than the port company. Therefore, the port company relies more on its major
users than on its major customers.
5.23 We encourage port companies listed on the NZX to improve their disclosures by
summarising their reliance on the major users of the port. In our view, including
this information alongside the major customer information required by NZ IFRS 8
will provide more meaningful information to readers of their financial statements.
30Appendix
Port companies’ 2019/20
information
Figure 6
Port companies’ financial information for 2019/20
Port company Revenue Net profit Dividends Total Total
after tax paid assets equity
$million $million $million $million $million
CentrePort Limited 262.7 158.4 5.0 506.4 455.5
Lyttelton Port Company
129.7 -152.7 6.7 555.9 356.1
Limited
Marsden Maritime
15.1 6.7 6.6 155.8 137.3
Holdings Limited
Port Marlborough
30.8 3.2 3.4 203.2 150.8
New Zealand Limited
Port Nelson Limited 66.7 8.3 6.3 356.8 250.4
Ports of Auckland
234.5 23.1 0.0 1,451.5 821.2
Limited
Port of Napier Limited 101.4 21.6 11.0 375.8 185.3
Port of Tauranga
302.3 89.9 124.5 1,817.2 1,163.6
Limited
Port Otago Limited 138.3 50.5 9.5 655.8 548.6
PrimePort Timaru
24.2 5.6 1.7 91.9 61.3
Limited
Port Taranaki Limited 51.8 12.2 8.0 198.2 148.9
South Port
44.6 9.4 6.8 59.4 45.6
New Zealand Limited
Source: Port companies’ audited financial statements.
Figure 7
Port companies’ import and export information for 2019/20
Port company Exports Imports Main bulk import and export
$billion $billion commodities
Meat and fish, dairy, and logs including
CentrePort Limited 1.69 2.42
related wood products.
Lyttelton Port Coal, meat and fish, dairy, and
6.32 3.97
Company Limited vegetables and foodstuffs.
Port Marlborough
0.09 0.00 Logs including related wood products.
New Zealand Limited
Logs including related wood products,
Port Nelson Limited 1.02 0.26 vegetables and foodstuffs, and meat
and fish.
Ports of Auckland Vegetables and foodstuffs and vehicles,
4.14 23.30
Limited including machinery.
31You can also read