RESPIRENET: A DEEP NEURAL NETWORK FOR ACCURATELY DETECTING ABNORMAL LUNG SOUNDS IN LIMITED DATA SETTING
←
→
Page content transcription
If your browser does not render page correctly, please read the page content below
RESPIRENET: A DEEP NEURAL NETWORK FOR ACCURATELY DETECTING
                                                        ABNORMAL LUNG SOUNDS IN LIMITED DATA SETTING

                                                              Siddhartha Gairola1 , Francis Tom2 , Nipun Kwatra1 and Mohit Jain1

                                                                                 Microsoft Research India1 , Microsoft2

                                                                ABSTRACT
arXiv:2011.00196v2 [cs.SD] 7 May 2021

                                            Auscultation of respiratory sounds is the primary tool for
                                        screening and diagnosing lung diseases. Automated anal-
                                        ysis, coupled with digital stethoscopes, can play a crucial
                                        role in enabling tele-screening of fatal lung diseases. Deep
                                        neural networks (DNNs) have shown a lot of promise for
                                        such problems, and are an obvious choice. However, DNNs
                                        are extremely data hungry, and the largest respiratory dataset
                                        ICBHI [21] has only 6898 breathing cycles, which is still
                                        small for training a satisfactory DNN model. In this work,
                                        RespireNet, we propose a simple CNN-based model, along
                                        with a suite of novel techniques—device specific fine-tuning,
                                        concatenation-based augmentation, blank region clipping,
                                                                                                          Fig. 1. Overview of proposed RespireNet framework. We pre-
                                        and smart padding—enabling us to efficiently use the small-
                                                                                                          process the audio signal (bandpass filtering, downsampling,
                                        sized dataset. We perform extensive evaluation on the ICBHI
                                                                                                          normalization, etc.), apply concatenation-based augmenta-
                                        dataset, and improve upon the state-of-the-art results for
                                                                                                          tion and smart padding, and generate the mel-spectrogram.
                                        4-class classification by 2.2%.
                                                                                                          Blank region clipping is applied to remove blank regions in
                                            Index Terms— Abnormality detection, lung sounds,              the high frequency ranges. The processed spectrogram is then
                                        crackle and wheeze, ICBHI dataset, deep learning                  used to train our DNN model via a two-stage training. Stage-
                                                                                                          1: the model is trained using entire train set. Stage-2: device
                                                           1. INTRODUCTION                                specific fine-tuning which trains using subset of data corre-
                                                                                                          sponding to each device.
                                        Respiratory diseases like asthma, chronic obstructive pul-
                                        monary disease (COPD), lower respiratory tract infection,              Algorithmic detection of lung diseases from respiratory
                                        lung cancer, and tuberculosis are the leading causes of death     sounds has been an active area of research [17, 20] especially
                                        worldwide [14], constituting four of the 12 most common           with the advent of digital stethoscopes. Most of these works
                                        causes of death. Early diagnosis has been found to be cru-        focus on detecting abnormal respiratory sounds of wheeze and
                                        cial in limiting the spread of respiratory diseases, and their    crackle. Wheeze is a typical symptom of asthma and COPD.
                                        adverse effects on the length and quality of life. Listening      It is characterized by a high-pitched continuous sound in the
                                        to chest sounds using a stethoscope is a standard method          frequency range of 100-2500Hz and duration above 80 msec
                                        for screening and diagnosing lung diseases. It provides a         [3, 19]. Crackles, which are associated with COPD, chronic
                                        low cost and non-invasive screening methodology, avoiding         bronchitis, pneumonia and lung fibrosis [7, 18], have a dis-
                                        the exposure risks of radiography and patient-compliance          continuous, non-tonal sound, around frequency of ∼650 Hz
                                        requirements associated with tests such as Spirometry.            and duration of 5 msec (for fine crackles), or frequency of
                                            There are a few drawbacks of stethoscope-based diagno-        100-500 Hz and duration of 15 msec (for coarse crackles).
                                        sis: requirement of a trained medical professional to inter-           Although early works focused on hand-crafted features
                                        pret auscultation signals, and subjectivity in interpretations    and traditional machine learning [4, 8], more recently, deep
                                        causing inter-listener variability. These limitations are exac-   learning based methods have received the most attention [1,
                                        erbated in impoverished settings and during pandemic situa-       9, 12]. For training DNNs, a time-frequency representation of
                                        tions (such as COVID-19), due to shortage of expert medi-         the audio signal such as Mel-spectrograms [1, 10, 25], stacked
                                        cal professionals. Automated analysis of respiratory sounds       MFCC features [2, 9, 13, 16, 25] or optimized S-transform
                                        can alleviate these drawbacks, and also help in enabling tele-    spectrogram [6] is used. This 2D “image” is then fed into
                                        medicine applications to monitor patients outside a clinic by     CNNs [2, 16], RNNs [9, 15], or hybrid CNN-RNNs [1] to
                                        less-skilled workforce such as community health workers.          learn robust high dimensional representations.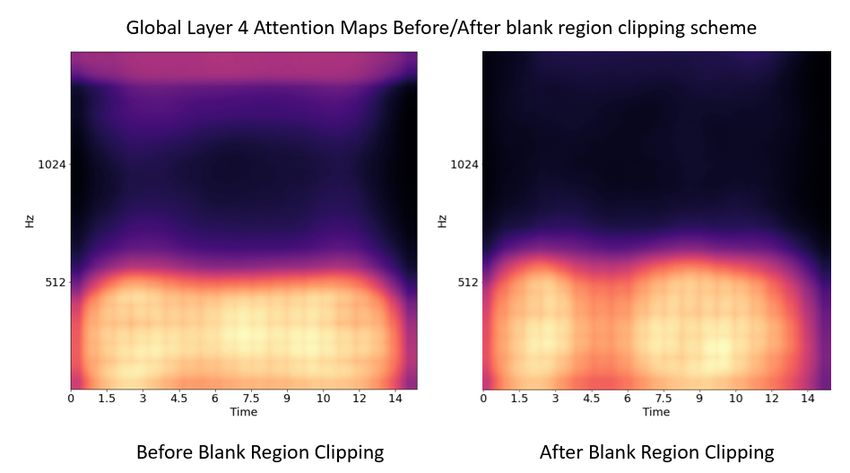
It is well known that DNNs are data hungry and typically                  Butterworth band-pass filter to remove noise (heartbeat, back-
require large datasets to achieve good performance. In this                   ground speech, etc.). We also apply standard normalization
work, we use the ICBHI challenge dataset [21], a popular res-                 on the input signal to map the values within the range (-1, 1).
piratory sound dataset. In spite of being the largest publicly                The audio signal is then converted into a Mel-spectrogram,
available dataset, it has only 6898 breathing cycle samples,                  which is fed into our DNN.
which is quite small for training deep networks. Thus, a big                  Network architecture: We use a CNN-based network, ResNet-
focus of our work has been on developing a suite of tech-                     34, followed by two 128-d fully connected linear layers with
niques to help train DNNs in a data efficient manner. We                      ReLU activations. The last layer applies softmax activation to
found that a simple CNN architecture, such as ResNet, is                      model classwise probabilities. Dropout is added to the fully-
adequate for achieving good accuracy. This is in contrast                     connected layers to prevent overfitting. The network is trained
to prior work employing complex architectures like hybrid                     via a standard categorical cross-entropy loss to minimize the
CNN-RNN [1], non-local block additions to CNNs [12], etc.                     loss for multi-class classification. The overall framework and
    In order to efficiently use the available data, we did ex-                architecture is illustrated in Figure 1.
tensive analysis of the ICBHI dataset. We found several char-
acteristics of the data that might inhibit training DNNs ef-                  2.1. Efficient Dataset Utilization
fectively. For example, the dataset contains audio recordings                 Even though ICBHI is the largest publicly available dataset
from four different devices, with skewed distribution of sam-                 with 6898 samples, it is still relatively small for training
ples across the devices, which makes it difficult for DNNs to                 DNNs effectively. Thus, a major focus of our work has been
generalize well across devices. Similarly, the dataset has a                  to develop techniques to efficiently use the available samples.
skewed distribution across normal and abnormal classes, and                   We extensively analyzed the dataset to identify dataset char-
varying lengths of audio samples. We propose multiple novel                   acteristics that inhibit training DNNs effectively, and propose
techniques to address these problems—device specific fine-                    solutions to overcome the same.
tuning, concatenation-based augmentation, blank region clip-                       The first commonly used technique we apply is transfer
ping, and smart padding. We perform extensive evaluation                      learning, where we initialize our network with weights of a
and ablation analysis of these techniques.                                    pre-trained ResNet-34 network on ImageNet [23]. This is fol-
The main contributions of our work are:                                       lowed by our training where we train the entire network end-
   1. demonstration that a simple network architecture is suf-                to-end. Interestingly, even though ImageNet dataset is very
       ficient for respiratory sound classification, and more fo-             different from the spectrograms which our network sees, we
       cus is needed on making efficient use of available data.               still found this initialization to help significantly. Most likely,
   2. a detailed analysis of the ICBHI dataset pointing out its               low level features such as edge-detection are still similar and
       characteristics impacting DNN training significantly.                  thus “transfer” well.
   3. a suite of techniques—device specific fine-tuning,                      Concatenation-based Augmentation: Like most medical
       concatenation-based augmentation, blank region clip-                   datasets, ICBHI dataset has a huge class imbalance, with
       ping and smart padding—enabling efficient dataset us-                  the normal class accounting for 53% of the samples. To
       age. These techniques are orthogonal to the choice of                  prevent the model from overfitting on abnormal classes, we
       network architecture and should be easy to incorporate                 experimented with several data augmentation techniques.
       in other networks.                                                     We first apply standard audio augmentation techniques, such
                                                                              as noise addition, speed variation, random shifting, pitch
                          2. METHOD                                           shift, etc., and also use a weighted random sampler to sample
                                                                              mini-batches uniformly from each class. These standard tech-
Dataset: We perform all evaluations on the ICBHI scientific                   niques help a little, but to further improve generalization of
challenge respiratory sound dataset [21, 22]. It is one of the                the underrepresented classes (wheeze, crackle, both), we de-
largest publicly available respiratory datasets. The dataset                  veloped a concatenation based augmentation technique where
comprises of 920 recordings from 126 patients with a com-                     we generate a new sample of a class by randomly sampling
bined total duration of 5.5 hours. Each breathing cycle in a                  two samples of the same class and concatenating them (see
recording is annotated by an expert as one of the four classes:               Figure 2). This scheme led to a non-trivial improvement in
normal, crackle, wheeze, or both (crackle and wheeze). The                    the classification accuracy of abnormal classes.
dataset comprises of recordings from four different devices1
from hospitals in Portugal and Greece. For every patient, data
was recorded at seven different body locations.
Pre-processing: The sampling rate of recordings in the
dataset varies from 4 kHz to 44.1 kHz. To standardize, we
down-sample the recordings to 4 kHz and apply a 5-th order                        Fig. 2. Proposed concatenation-based augmentation.
    1 The four devices used for recordings are AKGC417L Microphone, 3M
Littmann Classic II SE Stethoscope, 3M Litmmann 3200 Electronic Stetho-       Smart Padding: The breathing cycle length varies across pa-
scope, and WelchAllyn Meditron Master Elite Electronic Stethoscope            tients as well as within a patient depending on various factors

                                                                          2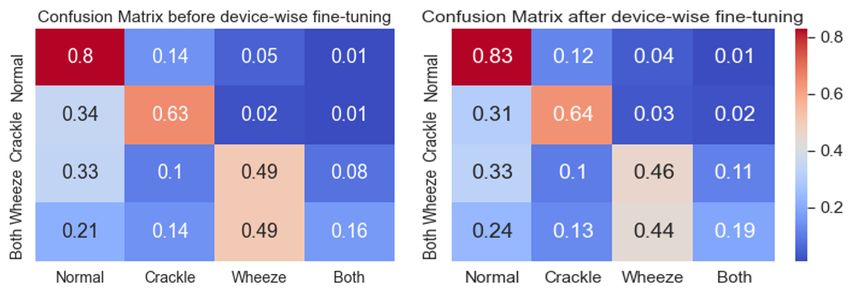
(e.g., breathing rate can increase moderately during fever). for the underrepresented devices in the already small dataset.
In the ICBHI dataset, the length of breathing cycles ranges To verify this, we divided the test set into 4 subsets depending
from 0.2s to 16.2s with a mean cycle length of 2.7s. This on their device type, and compute the accuracy of abnormal
poses a problem while training our network as it expects a class samples in each subset. As expected, we found the clas-
fixed size input2 . The standard way to handle this is to pad sification accuracy to be strongly correlated with the training
the audio signal to a fixed size via zero-padding or reflection set size of the corresponding device. To address this, we first
based padding. We propose a novel smart padding scheme, train a common model with the full training data (stage-1,
which uses a variant of the augmentation scheme described Figure 1). We then make 4 copies of this model and fine-tune
above. For each data sample, smart padding first looks at the (stage-2) them for each device separately by using only the
breathing cycle sample for the same patient taken just before subset of training data for that device. We found this approach
and after the current one. If this neighbouring cycle is of the to significantly improve the performance, especially for the
same class or of the normal class, we concatenate the cur- underrepresented devices.
rent sample with it. If not, we pad by copying the same cycle
again. We continue this process until we reach our desired 3. EXPERIMENTS
size. This smart padding scheme also augments the data and We evaluate the performance of our framework on the res-
helps prevent overfitting. We experimented with different in- piratory anomaly classification task proposed in the ICBHI
put lengths, and found a 7s window to perform best. A small challenge [21]. This is further divided into two subtasks:
window led to clipping of samples, thus loosing valuable in- (i) classify a breathing cycle into one of the four classes–
formation in an already scarce dataset, while a very large win- normal(N), crackle(C), wheeze(W), both(B), and (ii) clas-
dow caused repetition leading to degraded performance. sify a breathing cycle into normal or anomalous class,
where anomalous = {crackle, wheeze, both}. Our eval-
uation method is same as the one proposed in the orig-
inal ICBHI challenge. The final score is computed as
the mean of Sensitivity Se = NPcc+N +Pw +Pb
w +Nb
and Specificity
Pn
Sp = Nn , where Pi and Ni are the number of correctly
classified and total number of samples in class i, respectively
(i ∈ {normal, crackle, wheeze, both}). For the 2-class
case, we adopt the anomalous and normal class scores as Se
and Sp respectively, and the score is computed as their mean.
We compare our performance using the above evaluation
metric on two dataset divisions: the official 60-40% split [21]
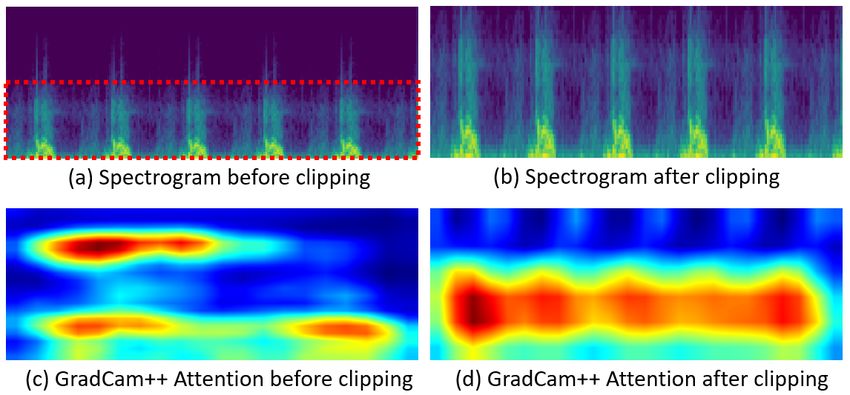
Fig. 3. Blank region clipping: The network attention [5] and the 80-20% split [1, 11, 12] for train-test4 . The Sensitivity
starts focusing more on the bottom half of the spectrogram, Se , Specificity Sp and ICBHI Score values are reported in
instead of blank spaces after clipping. Table 1. RespireNet achieves state-of-the-art (SOTA) in both
train-test split divisions, and outperforms SOTA [12] on the
Blank Region Clipping: On analyzing samples using Grad- official split (60-40) by 4% and SOTA [1] on the 80-20 split
Cam++ [5] which our base model mis-classified, we found by 2.2%. Further, RespireNet achieves a score of 77% on the
notable black regions3 at higher frequency regions of their 2-class classification task, achieving the new SOTA.
spectrograms (Figure 3). On further analysis, we found that Implementation Details: We train our models on a Tesla v100
many samples, and in particular 100% of the Litt3200 de- GPU on a Microsoft Azure VM. We used the SGD optimizer
vice samples, had blank region in the 1500-2000Hz frequency with momentum of 0.9, and a batch size of 64. We used a
range. Since this was adversely affecting our network perfor- fixed learning rate of 1e-3 for stage-1 and 1e-4 for stage-2 of
mance, we selectively clip off the blank rows from the high training. Stage-1 was trained for 200 epochs. The highest
frequency regions of such spectrograms. This ensures that the validation checkpoint from stage-1 was used to train stage-2
network focuses on the region of interest leading to improved for another 50 epochs for each device.
performance. Figure 3 shows this in action. We further analyze the effect of our novel proposed tech-
Device Specific Fine-tuning: The ICBHI dataset has sam- niques by conducting an ablation analysis on the 4-class clas-
ples from 4 different devices. We found that the distribu- sification task on the 80/20 split.
tion of samples across devices is heavily skewed, e.g. the Concatenation-based Augmentation: Due to the small size of
AKGC417L Microphone alone contributes to 63% of the abnormal samples in the dataset, our model tends to overfit on
samples. Since each device has different audio characteris- the abnormal classes quickly, and achieved a score of 62.2%.
tics, the DNN may fail to generalize across devices, especially Standard augmentations (noise addition, etc.) improved the
2 CNNs can be made size agnostic by using adaptive average pooling, but score to 66.2%, which further improved to 66.8% with our
that typically hurts accuracy. concatenation-based augmentation. Also, most of the gain
3 Black region in a spectrogram means that the audio signal has zero en-
ergy in the corresponding audio frequency range. 4 For both the splits, the train and test set are patient-wise disjoint.
3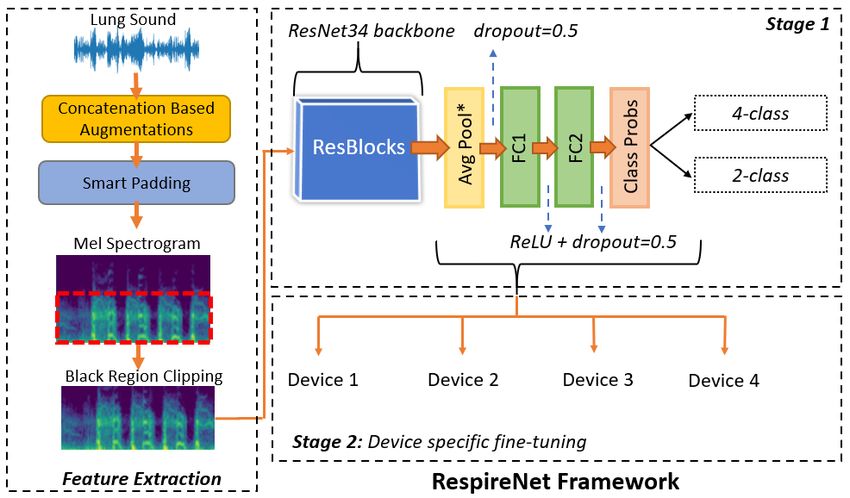
Split & Task                Method                   Sp            Se          Score                  Device      % Samples      Score Improvement
  60/40 Split        Jakovljevic et al. [8]             -          -            39.5%
      &               Chambres et al. [4]            78.1%      20.8%           49.4%
                                                                                                     AKGC417L          63%               1.7%
    4-class            Serbes et al. [24]               -          -            49.9%                 Meditron         21%               1.6%
                        Ma et al. [11]               69.2%      31.1%           50.2%                 Litt3200          9%               9.3%
                        Ma et al. [12]               63.2%      41.3%           52.3%                 LittC2SE          7%               8.6%
                         CNN (ours)                  71.4%      39.0%           55.2%
                    CNN+CBA+BRC (ours)               71.8%      39.6%           55.7%         Table 3. Device specific fine-tuning: The devices with small
                   CNN+CBA+BRC+FT (ours)             72.3%      40.1%           56.2%         number of samples show a big improvelment in their scores.
  80/20 Split         Kochetov et al. [9]            73.0%      58.4%           65.7 %
      &               Acharya et al. [1]             84.1%      48.6%           66.3%                            4. RELATED WORK
    4-class             Ma et al. [12]               64.7%      63.7%           64.2%
                        CNN (ours)                   78.8%      53.6%           66.2%         Recently, there has been a lot of interest in using deep learn-
                    CNN+CBA+BRC (ours)               79.7%      54.4%           67.1%         ing models for respiratory sounds classification [1, 9, 12]. It
                   CNN+CBA+BRC+FT (ours)             83.3%      53.7%           68.5%
                                                                                              has outperformed statistical methods (HMM-GMM) [8] and
  80/20 Split           CNN (ours)                   83.3%      60.5%           71.9%
      &             CNN+CBA+BRC (ours)               76.4%      71.0%           73.7%
                                                                                              traditional machine learning methods (boosted decision trees,
    2-class        CNN+CBA+BRC+FT (ours)             80.9%      73.1%           77.0%         SVM) [4, 24]. In these deep learning based approaches, a
                                                                                              time-frequency representation of the audio signal is provided
Table 1. Performance comparison of the proposed model                                         as input to the model. Kochetov et al. [9] propose a deep re-
with the state-of-the-art systems following random splits. We                                 current network with a noise masking intermediate step for
see significant improvements from our proposed techniques:                                    the four class classification task, obtaining a score of 65.7%
concatenation-based augmentation (CBA), blank region clip-                                    on the 80-20 split. However the paper omits the details re-
ping (BRC) and device specific fine-tuning (FT).                                              garding noise label generation [1], thus making it hard to re-
                                                                                              produce. Deep residual networks and optimized S-transform
 Length.   1 sec    2 sec   3 sec   4 sec   5 sec   6 sec    7 sec   8 sec        9 sec       based features are used by Chen et al. [6] for three-class clas-
  Scores   56.6     59.0    60.3    61.1    62.3    64.4     66.2        65.1     65.5        sification of anomalies in lung sounds. The model is trained
                                                                                              and tested on a smaller subset of the ICBHI dataset on a 70-30
       Table 2. Input length size vs classification score.                                    split and achieve a score of 98%.
                                                                                                   Acharya and Basu [1] propose a Mel-spectrogram based
came from improved accuracy of the abnormal classes, where                                    hybrid CNN-RNN model with patient-specific model tuning,
the sensitivity increased by 1.5%. This demonstrates that our                                 achieving a score of 66.3% on 4-class and 80-20 split. Ma
augmentation scheme to generate novel samples for the ab-                                     et al. [12] introduce LungRN+NL which incorporates a non-
normal class helps the model generalize better.                                               local block in the ResNet architecture and apply mixup aug-
Smart Padding: The length of breathing cycle in the dataset                                   mentations to address the data imbalance problem and im-
has a wide variation, thus we need to pad the shorter sam-                                    prove the model’s robustness, achieving sensitivity of 63.7%.
ples and clip the longer ones to match the input length of                                    However, none of these approaches focus on characteristics of
the network. We experimented with different input lengths                                     the ICBHI dataset, which we exploit to improve performance.
and found that a 7s length performed optimally (see Table 2).
Since the average cycle length is 2.7s, padding became cru-
cial as a majority of the inputs need padding. We found the                                          5. CONCLUSION AND FUTURE WORK
padding scheme to have a significant impact on accuracy. For                                  The paper proposes RespireNet a simple CNN-based model,
the base model, smart padding improves accuracy over zero-                                    along with a set of novel techniques—device specific fine-
padding and reflection-based padding by 5% and 2% respec-                                     tuning, concatenation-based augmentation, blank region clip-
tively. This demonstrates the effectiveness of our padding                                    ping, and smart padding—enabling us to effectively utilize a
scheme, which incorporates data augmentation for padding,                                     small-sized dataset for accurate abnormality detection in lung
rather than plain copying or adding zeros.                                                    sounds. Our proposed method achieved a new SOTA for the
Blank Region Clipping: This provided an improvement of                                        ICBHI dataset, on both the 2-class and 4-class classification
0.5% over the base model score of 66.2%. When combined                                        tasks. Further, our proposed techniques are orthogonal to the
with our proposed augmentation, it helped achieve a score of                                  choice of network architecture and should be easy to incorpo-
67.1%, outperforming the current SOTA [1] by 0.8%.                                            rate within other frameworks.
                                                                                                  The current performance limit of the 4-class classification
Device specific fine-tuning: We found that the large skew in                                  task can be mainly attributed to the small size of the ICBHI
sample distribution across devices caused the model to not                                    dataset, and the variation among the recording devices. Fur-
generalize well for under-represented devices. Our device                                     thermore, there is lack of standardization in the 80-20 split
specific fine-tuning scheme helped significantly, resulting in                                and we found variance in the results based on the particular
an improvement of 1.4% in the final ICBHI score. We also                                      split. In future, we would recommend that the community
observed that this fine-tuning disproportionally helped the                                   should focus on capturing a larger dataset, while taking care
under-represented classes. Table 3 shows that devices with                                    of the issues raised in this paper.
fewer samples had ∼9% increase in their scores.

                                                                                          4
References [14] World Health Organization. The global impact of respiratory
diseases (2nd edition). Forum of International Respiratory So-
[1] Jyotibdha Acharya and Arindam Basu. Deep neural network cieties (FIRS), 2017.
for respiratory sound classification in wearable devices en-
abled by patient specific model tuning. IEEE Transactions on [15] D. Perna and A. Tagarelli. Deep auscultation: Predicting res-
Biomedical Circuits and Systems, PP:1–1, 03 2020. piratory anomalies and diseases via recurrent neural networks.
2019 IEEE 32nd International Symposium on Computer-Based
[2] Murat Aykanat, Özkan Kiliç, Bahar Kurt, and S. Saryal. Clas- Medical Systems (CBMS), pages 50–55, 2019.
sification of lung sounds using convolutional neural networks.
EURASIP Journal on Image and Video Processing, 2017:1–9, [16] Diego Perna. Convolutional neural networks learning from res-
2017. piratory data. pages 2109–2113, 12 2018.
[3] Abraham Bohadana, Gabriel Izbicki, and Steve Kraman. Fun- [17] Hüseyin Polat and Inan Guler. A simple computer-based
damentals of lung auscultation. The New England journal of measurement and analysis system of pulmonary auscultation
medicine, 370:744–751, 02 2014. sounds. Journal of medical systems, 28:665–72, 01 2005.
[4] Gaetan Chambres, Pierre Hanna, and Myriam Desainte- [18] Renard Xaviero Adhi Pramono, Stuart A. Bowyer, and
Catherine. Automatic detection of patient with respiratory dis- E. Rodrı́guez-Villegas. Automatic adventitious respiratory
eases using lung sound analysis. pages 1–6, 09 2018. sound analysis: A systematic review. PLoS ONE, 12, 2017.
[5] A. Chattopadhyay, Anirban Sarkar, Prantik Howlader, and [19] Sandra Reichert, Gass Raymond, Christian Brandt, and Em-
V. Balasubramanian. Grad-cam++: Generalized gradient- manuel Andrès. Analysis of respiratory sounds: State of the
based visual explanations for deep convolutional networks. art. Clinical Medicine : Circulatory, Respiratory and Pul-
2018 IEEE Winter Conference on Applications of Computer monary Medicine, 2, 05 2008.
Vision (WACV), pages 839–847, 2018.
[20] Sandra Reichert, Gass Raymond, Christian Brandt, and Em-
[6] Hai Chen, Zhiyuan Pei, Mianjie Li, and Jianqing Li. manuel Andrès. Analysis of respiratory sounds: State of the
Triple-classification of respiratory sounds using optimized s- art. Clinical Medicine : Circulatory, Respiratory and Pul-
transform and deep residual networks. IEEE Access, PP:1–1, monary Medicine, 2, 05 2008.
03 2019.
[21] B. M. Rocha, D. Filos, L. Mendes, I. Vogiatzis, E. Perantoni,
[7] B Flietstra, Natasha Markuzon, Andrey Vyshedskiy, and E. Kaimakamis, P. Natsiavas, A. Oliveira, C. Jácome, A. Mar-
R Murphy. Automated analysis of crackles in patients with ques, R. P. Paiva, I. Chouvarda, P. Carvalho, and N. Maglav-
interstitial pulmonary fibrosis. Pulmonary medicine, 2011: eras. α respiratory sound database for the development of auto-
590506, 01 2011. mated classification. In Nicos Maglaveras, Ioanna Chouvarda,
and Paulo de Carvalho, editors, Precision Medicine Powered
[8] Niksa Jakovljevic and Tatjana Loncar-Turukalo. Hidden by pHealth and Connected Health, pages 33–37, Singapore,
Markov Model Based Respiratory Sound Classification, pages 2018. Springer Singapore.
39–43. 01 2018.
[22] Bruno Rocha, D. Filos, Luı́s Mendes, Gorkem Serbes,
[9] Kirill Kochetov, Evgeny Putin, Maksim Balashov, Andrey Sezer Ulukaya, Yasemin Kahya, Niksa Jakovljevic, Tatjana
Filchenkov, and Anatoly Shalyto. Noise Masking Recurrent Loncar-Turukalo, Ioannis Vogiatzis, Eleni Perantoni, Evange-
Neural Network for Respiratory Sound Classification: 27th In- los Kaimakamis, Pantelis Natsiavas, Ana Oliveira, Cristina
ternational Conference on Artificial Neural Networks, Rhodes, Jácome, Alda Marques, N. Maglaveras, Rui Pedro Paiva,
Greece, October 4–7, 2018, Proceedings, Part III, pages 208– Ioanna Chouvarda, and Paulo De Carvalho. An open access
217. 10 2018. ISBN 978-3-030-01423-0. database for the evaluation of respiratory sound classification
algorithms. Physiological Measurement, 40, 02 2019.
[10] Renyu Liu, Shengsheng Cai, Kexin Zhang, and Nan Hu. Detec-
tion of adventitious respiratory sounds based on convolutional [23] Olga Russakovsky, Jia Deng, Hao Su, Jonathan Krause, San-
neural network. pages 298–303, 11 2019. jeev Satheesh, Sean Ma, Zhiheng Huang, Andrej Karpathy,
Aditya Khosla, Michael Bernstein, Alexander C. Berg, and
[11] Yi Ma, Xinzi Xu, Qing Yu, Yuhang Zhang, Yongfu Li, Jian
Li Fei-Fei. ImageNet Large Scale Visual Recognition Chal-
Zhao, and Guoxing Wang. Lungbrn: A smart digital stetho-
lenge. International Journal of Computer Vision (IJCV), 115
scope for detecting respiratory disease using bi-resnet deep
(3):211–252, 2015.
learning algorithm. 10 2019.
[24] Gorkem Serbes, Sezer Ulukaya, and Yasemin Kahya. An Au-
[12] Yi Ma, Xinzi Xu, and Yongfu Li. Lungrn+nl: An improved
tomated Lung Sound Preprocessing and Classification System
adventitious lung sound classification using non-local block
Based OnSpectral Analysis Methods, pages 45–49. 01 2018.
resnet neural network with mixup data augmentation. 08 2020.
[25] Lukui Shi, Kang Du, Chaozong Zhang, Hongqi Ma, and Wen-
[13] Elmar Messner, Melanie Fediuk, Paul Swatek, Stefan Scheidl,
jie Yan. Lung sound recognition algorithm based on vggish-
Freyja-Maria Smolle-Juttner, Horst Olschewski, and Franz
bigru. IEEE Access, PP:1–1, 09 2019.
Pernkopf. Crackle and breathing phase detection in lung
sounds with deep bidirectional gated recurrent neural net-
works. volume 2018, pages 356–359, 07 2018.
56. SUPPLEMENTARY MATERIAL Device N C W B
This supplementary material includes some other details AKGC417L 0.53 0.83 0.56 0.75
about the dataset, and additional results which could not be Meditron 0.28 0.11 0.17 0.11
accommodated in the main paper. Litt3200 0.10 0.02 0.14 0.09
LittC2SE 0.09 0.04 0.13 0.05
6.1. Dataset Details Table 5. Distribution of breathing cycles across classes and
The 2017 ICBHI dataset [21] comprises of 920 recordings devices.
from 126 patients with a combined total duration of 5.5 hours.
Each breathing cycle in a recording is annotated by a single For creating the splits we perform sample 80-20 w.r.t
expert as one of the four classes: normal, crackle, wheeze or number of patients. From the numbers in Table 4, we have 64
both (crackle and wheeze). These cycles have various record- patients from Meditron device but only 1468 breathing cycles
ing lengths (see Figure 4) ranging from 0.2s to 16.2s (mean (22.9 breathing cycles per patient on an average), whereas
cycle length is 2.7s) and the number of cycles is imbalanced for AKGC417L device we have 32 patients and 4364 breath-
across the four classes (i.e. 3642, 1864, 886, 506 cycles for ing cycles (136.4 breathing cycles per patient on an average).
normal, crackle, wheeze and both classes respectively). This depicts the huge skew in the splits across devices and pa-
tients. Further there is also a skew between abnormal classes
across devices: The majority of crackle class (83% of the
total samples) is found within the AKGC417L device whereas
wheeze and both have different proportions across devices.
6.2. Additional Results
Single Device Training We train our model only on samples
from the AKGC417L device. Table 6 depicts the test perfor-
mance on the 4 different devices. This demonstrates that the
training only on a single device, does not translate well across
the other devices, thus further motivating the use of device
specific fine-tuning.
Device Normal Crackle Wheeze Both
Fig. 4. Distribution of length of cycles across samples. 65% AKGC417L 61.3% 77.5% 23.8% 28.2%
of the samples have a cycle length of < 3 seconds, and 33% Meditron 47.3% 69.2% 26.3% 0.0%
of the samples have a cyle length between 4-6 seconds. Litt3200 51.2% 66.7% 20.7% 66.7%
LittC2SE 16.8% 22.2% 0.0% 0.0%
The dataset consists of sound recordings from four de- Table 6. Scores device wise for each class when trained only
vices AKGC417L Microphone, 3M Littmann Classic II SE on AKGC417L. Overall Score: 53.0%, Sensitivity: 55.7%
Stethoscope, 3M Litmmann 3200 Electronic Stethoscope and and Specificity: 50.3%.
WelchAllyn Meditron Master Elite Electronic Stethoscope and
is not balanced across patients as well as number of breathing
Attention Map Visualization Figure 5 depicts global av-
cycles (see Tables 4, 5). This creates a skew in the data distri-
erage of attention maps computed (for layer-4 of ResNet34)
bution and has an adverse impact on the performance of the
using Grad-Cam++[5] for 1370 samples in the test split be-
model as discussed in the analysis earlier.
fore and after employing the blank region clipping scheme
during network training. It can be observed that the network
Patient starts focusing more on the bottom half of the spectrogram,
Device N C W B Total
Count* instead of blank spaces after using blank region clipping. This
AKGC417L 32 1922 1543 500 381 4346 demonstrates the efficacy of using the proposed blank region
Meditron 64 1037 215 148 56 1456 clipping scheme which also results in improved performance.
Litt3200 11 347 77 126 44 594
Confusion Matrix Figure 6 shows the confusion matrix
LittC2SE 23 336 29 112 25 502
before and after device specific fine-tuning.
Table 4. Number of breathing cycles across classes and de-
vices, along with the distribution of patients across devices.
*Number of patients total to 130 instead of 126 as some of the
devices have an overalap with the patients.
6Fig. 5. Global average of attention maps computed using Grad-Cam++[5] for samples in the test split before and after
employing the blank region clipping scheme during network training.
Fig. 6. Confusion matrices before and after device-wise fine-tuning.
7You can also read