Residual votes in the 2020 election in Georgia
←
→
Page content transcription
If your browser does not render page correctly, please read the page content below
Residual votes in the 2020 election in Georgia∗

           David Cottrell†             Felix E. Herron‡            Michael C. Herron§

                                         Daniel A. Smith¶

                                       November 12, 2020

  ∗
     The authors thank Nicolás Macri for research assistance and Sara Loving for critical feedback.
   †
     Assistant Professor of Political Science, University of Georgia. Baldwin Hall 378, Athens, GA 30602
(david.cottrell@uga.edu).
   ‡
     Expected BSc in Informatik, Technische Universität Berlin, March 2021 (felix.herron@gmail.com).
   §
     Professor of Government, Dartmouth College.               6108 Silsby Hall, Hanover, NH 03755
(michael.c.herron@dartmouth.edu).
   ¶
     Professor of Political Science, University of Florida. 234 Anderson Hall, Gainesville, FL 32611 (da-
smith@ufl.edu).
Abstract The 2020 General Election took place against the backdrop of a pandemic and numerous claims about incipient voter fraud and election malfeasance. No state’s presidential race was closer than Georgia’s, where a hand recount of the presidential contest is planned. As an initial post-election audit of the 2020 election in Georgia, we analyze residual vote rates in statewide races. A race’s residual vote rate combines the rates at which ballots contain undervotes (abstentions) and overvotes (which occur when voters cast more than the allowed number of votes in a race). Anomalously high residual vote rates can be indicative of underlying election administration problems, like ballot design flaws. Our analysis of residual vote rates in Georgia uncovers noth- ing anomalous in the presidential race, a notable result given this race’s closeness. We do, however, find an unusually high overvote rate in Georgia’s special election for a seat in the United States Senate. This high overvote rate is concentrated in Gwinnett County and appears to reflect the county’s two-column ballot design that led roughly 4,000 voters to select more than one candidate for senate in the special election, in the process rendering invalid their votes in this contest.
Introduction

The 2020 General Election was unique in American history. Conducted during the country’s
worst public health crisis since the Spanish flu, millions of voters who would ordinarily have
voted in-person instead cast vote-by-mail ballots.1 Moreover, throughout its concluding
months the election was awash in claims about voter fraud and malfeasance.2
   With these challenges as background, understanding the performance of the 2020 election
from a purely administrative point of view—as opposed to from the point of view of political
parties or candidates who ran for office—is a key task for scholars of election administration
and election officials alike. Post-election audits will be one component of this task, and these
audits can take many forms.
   One such form, exemplified by this paper, is a statistical study of what are called residual
votes. Consider a given race in an election of interest. If a ballot cast in the election does
not contain a valid vote for the race, then this non-vote can be said to be a residual vote.
Residual votes consist of undervotes (abstentions) and overvotes (when a voter casts most
than the allowed number of votes for a given race). Neither undervotes nor overvotes are
valid votes. An election has a residual vote rate for each race that took place in it, and this
rate is the fraction of ballots cast in the election that lack valid votes in the race.
   For example, as of the writing of this paper the presidential residual vote rate in Georgia
in the 2020 General Election is approximately 0.367 percent. This, to be clear, is the rate
at which ballots cast in Georgia in November 2020 did not contain valid votes for president.
Georgia’s 2020 presidential residual vote rate is itself the sum of the presidential undervote
rate in the state (which is approximately 0.362 percent) and the corresponding overvote rate
(approximately 0.005 percent). Residual vote rates can be calculated for jurisdictions other
   1
     “93 Million And Counting: Americans Are Shattering Early Voting Records,” NPR.org, Novem-
ber 1, 2020, available at https://www.npr.org/2020/10/26/927803214/62-million-and-counting-
americans-are-breaking-early-voting-records (last accessed November 8, 2020).
   2
     For example, see “THE ATTACK ON VOTING,” The New York Times, September 30, 2020, available
at https://www.nytimes.com/2020/09/30/magazine/trump-voter-fraud.html (last accessed November
8, 2020).

                                                1
than entire states. One might, say, inquire about the presidential residual vote rate in a
single Georgia county, like Fulton County. Or, one might alternatively calculate the residual
vote rate associated with a statewide referendum on the 2020 election ballot.
Scholarly interest in residual votes can be traced to the 2000 presidential election and to
events that took place in Florida in the election’s aftermath. Residual vote rates vary by
voting technology (Leib and Dittmer, 2002; Ansolabehere and Stewart III, 2005), are cast
disproportionately often by minority voters (Herron and Sekhon, 2003; Tomz and Houweling,
2003), sometimes represent political disaffection (Stewart III et al., 2020), and are affected
by ballot formats (Frisina et al., 2008; Herron, Martinez and Smith, 2019). Putting aside for
the moment the matter of intentional undervoting, residual vote rates measure the extent to
which voters are able to register their preferences on their ballots. These rates can be used,
post-election, as a metric of election administration performance.3
In what follows, we assess residual vote rates from statewide contests in Georgia in
the 2020 election. Our analysis includes Georgia’s presidential race, presently the tightest
presidential contest in the nation and one slated to undergo a hand recount.4 We look to
see whether the residual vote rates we calculate are (1) either expected or unusual based on
findings in the literature and (2) consistent with one another in a way that we will make
clear shortly. Our analysis relies on statewide, county-level, and precinct-level election data
from Georgia, and it examines both residual vote rates and their two components, namely,
undervote and overvote rates.
Before turning to the 2020 election in Georgia, we stipulate three important points. First,
our analysis is focused on the administration of the 2020 General Election in Georgia. The
candidates who won the races in this election are not a concern here. Second, the analysis
3
Residual votes are not to be confused with mail-in ballots that are rejected on the basis of lateness or
signature defects on their return envelopes (Baringer, Herron and Smith, 2020). Rejected mail ballots are
not tabulated and as such do not contain residual votes.
4
“Hand recount moves ahead under interpretation of Georgia election rules,” Atlanta Journal-
Constitution, November 11, 2020, available at https://www.ajc.com/politics/hand-recount-moves-
ahead-under-interpretation-of-georgia-election-rules/A6TZPKBIMRCCTKBUZASTLLO4SE/ (last ac-
cessed November 11, 2020).
2relies on recent and still unofficial 2020 election results made public by the Georgia Secretary
of State.5 Third, residual vote rates are but one measure of the extent to which a state had
administrative success in an election. There are many other measures of this that one might
consider, e.g., the rate at which mail-in ballots were rejected in the state, the extent to which
in-person voters had to wait in line prior to voting, whether newly eligible voters were able
to register to vote, and how difficult it was for voters with disabilities to cast ballots. We
suspect that the 2020 election will be scrutinized in all of these dimensions and others as
well, and here we begin such a review process by examining residual vote rates in Georgia.
Georgia’s electoral environment in the 2020 election
We now review notable features of Georgia’s electoral environment as of November 2020.
These features provide context for the analysis that follows.
How Georgians cast their ballots
In Georgia, voters cast their ballots in two different ways. Individuals completing mail ballots
fill out paper forms that are processed in local elections offices by optical scan tabulating
machines. Individuals voting in-person at designated polling locations use “IMAGECAST
X” electronic voting machines that print out paper ballots that are processed by optical scan
machines.6 In-person voters can vote on Election Day itself or beforehand, utilizing what is
called “advanced voting.”7
5
For these results, see Georgia Secretary of State Brad Raffensperger, “November 3, 2020 General
Election,” which are posted at https://results.enr.clarityelections.com/GA/105369/web.264614/#/
summary (last accessed November 10, 2020).
6
For a tutorial on how in-person voters in Georgia cast their ballots, see “VOTING IS AS EASY AS 1
2 3!,” Georgia Secretary of State, available at https://sos.ga.gov/admin/uploads/Voting_is_easy.pdf
(last accessed November 8, 2020). There are some exceptions to the mail or in-person voting method
categorization we noted in the body of the paper. For procedures used to assist disabled voters in Georgia, see
“VOTERS WITH DISABILITIES,” Georgia Secretary of State, available at https://sos.ga.gov/index.
php/elections/voters_with_disabilities (last accessed November 11, 2020).
7
On in-person early voting in Georgia, see “Registered voters in Georgia can vote in person before Election
Day,” Georgia.gov, available at https://georgia.gov/early-voting (last accessed November 8, 2020).
3COBB CO T
Notice
Distinguishing between voting by mail and in-person voting to Voters:
is important. Consider a
This consolidated sample ballot contains
2020 election voter who filled out a mail ballot in Georgia. If this voter lived in Cobb
County, the presidential race would have been presented to him or her as a set of three
races for the November 3rd General/Spe
candidate names (plus a write-in option) with corresponding circles to be bubbled in. See
Election, including some races that you m
Figure 1, which shows the presidential portion of Cobb County’s sample ballot for the 2020
8
not be eligible to vote on. Please check o
General Election.
for your Personal Sample Ballot at:
Figure 1: Cobb County presidential race
www.mvp.sos.ga.gov
For President For Public Serv
SPECIAL ELECTION Commissione
of the United States
(Vote for One) (To Succeed Jason
For United States Senate (Vote for One)
Donald J. Trump - President (To Fill the Unexpired Term of Jason Shaw
Michael R. Pence - Vice President Johnny Isakson, Resigned) (Incumbent) Republican
(Incumbent) Republican (Vote for One)
Al Bartell Robert G. Bryant
L
Independent Democrat
Joseph R. Biden - President
Kamala D. Harris - Vice President
Democrat Allen Buckley Elizabeth Melton
Independent Libertarian
Jo Jorgensen - President Doug Collins
P
Jeremy "Spike" Cohen - Vice President Republican
Libertarian Write-in
John Fortuin For Public Serv
Green Commissione
(To Succeed Lauren Bubba
Derrick E. Grayson (Vote for One)
Republican
Write-in Lauren Bubba McDona
(Incumbent) Republican
M
For United States Senate Michael Todd Greene
(Vote for One) Independent
Daniel Blackman
Democrat
David A. Perdue
By filling in one circle, our hypothetical Cobb County voter Annette
couldDavis Jackson
have cast a valid vote
(Incumbent) Republican Republican
Nathan Wilson
in the presidential race. On the other hand, the voter could haveDeborah
circled a single candidate’s Libertarian
A
Jon Ossoff Jackson
Democrat Democrat
name instead of filling in a circle; this error would have lead to an undervote. Or, the
Shane Hazel Jamesia James Write-in
Libertarian
voter could have voted for two presidential Democrat
candidates by filling in two circles, leading to
For U.S. Representativ
Congress From th
S
A. Wayne Johnson
an overvote. As these examples illustrate, a Georgia voter completing Congressional District
Republican a mail-in ballot can
Write-in (Vote for One)
freely undervote or overvote. There are no constraints on how such
TamaraaJohnson-Shealey
voter fills in his or herKaren Handel
Democrat Republican
paper ballot (which, arguably, is a weakness of this form of voting).
Matt Lieberman Lucy McBath
Democrat (Incumbent) Democrat
However, when an in-person voter in Georgia votes with a ballot marking device that
Kelly Loeffler
8
We downloaded this sample ballot from https://s3.us-west-2.amazonaws.com/cobbcounty.org.if-
(Incumbent) Republican
us-west-2/prod/2020-09/2020Nov_SampleBallot.pdf on November 8, 2020. Write-in
Joy Felicia Slade For U.S. Representativ
Democrat Congress From th
4 Congressional District
Brian Slowinski (Vote for One)
Libertarian
Barry Loudermilk
(Incumbent) Republican
Valencia Stovalllater prints out a paper ballot, the voter is constrained by the device’s programming. To the
best of our knowledge, Georgia’s in-person voting machines do not permit voters to overvote
(which, arguably, is a strength of this form of voting).9
That said, the use of ballot marking devices in Georgia for the purposes of facilitating
in-person voting may not always succeed at preventing overvotes. Since the introduction of
Georgia’s newly acquired voting machines in March 2020, there have been reports of these
machines malfunctioning across Georgia, including during the state’s 2020 presidential pri-
mary. In the case of machine malfunction, in-person voters in Georgia are issued emergency
paper ballots on which overvotes are possible (O.G.C.A § 21-2-418(h)). Thus, the use of
voting machines for in-person voting in Georgia does not imply that literally all in-person
voters in the state are protected against overvoting.10
The 2020 election in Georgia
Georgia’s 2020 General Election featured eight statewide contests. Five of these were partisan
races involving candidates (President, two United States Senate races, and two Public Service
Commissioner races), and three of them were ballot measures that voters could choose to
support or not (two proposed constitutional amendments and a statewide referendum). The
order of the eight statewide contests on the 2020 ballot was effectively the same for all
Georgia voters. Namely, when filling out their ballots, voters initially encountered the five
statewide candidate races; then, they saw a set of Congressional, state senate, state house,
9
Per the Georgia Secretary of State, “Ballot marking devices (BMDs) offer reliability and assurance,
balancing the need for both security and accessibility in the voting process. BMDs have proven to reduce
the rate of undervotes, overvotes and stray-marked votes in elections. They can specifically alert voters if
they have skipped or missed a ballot selection, ensuring that all voting choices are complete.” See “Georgia
Voting System Frequently Asked Questions: Meet Democracy Suite (D-Suite),” Georgia Secretary of State,
available at https://sos.ga.gov/admin/uploads/VoterFAQ.pdf (last accessed November 8, 2020).
10
On the use of voting machines in Georgia starting in March 2020, see “SECURITY-FOCUSED TECH
COMPANY, DOMINION VOTING TO IMPLEMENT NEW VERIFIED PAPER BALLOT SYSTEM,”
Georgia Secretary of State, available at https://sos.ga.gov/securevoting/ (last accessed November 9,
2020). On machine malfunctions, see “Voting debacle in Georgia came after months of warnings went unad-
dressed,” The Washington Post, June 10, 2020, available at https://www.washingtonpost.com/politics/
voting-debacle-in-georgia-came-after-months-of-warnings-went-unaddressed/2020/06/10/
1ab97ade-ab27-11ea-94d2-d7bc43b26bf9_story.html (last accessed November 9, 2020) and “Georgia
5and local races that depended on voters’ districts; and, finally, they encountered the three
statewide ballot measures. Some voters might then see additional local ballot measures.
Of the eight statewide contests, first on the 2020 Georgia ballot was the United States
presidential race. As of November 10, 2020, at approximately 12:25pm Eastern Standard
Time, Democrat Joe Biden’s lead over Republican presidential incumbent Donald Trump
was only slightly more than 12,200 votes out of nearly five million votes cast.11 We already
noted that the presidential race is headed for a recount.12
After the presidential race on the 2020 ballot came Georgia’s two races for seats in
the United States Senate. These races were (1) the regularly scheduled contest between
Republican incumbent Senator David Perdue, his Democratic challenger Jon Ossoff, and
a Libertarian candidate and (2) a Senate special election with 20 total candidates. The
incumbent in the special election was Republican Kelly Loeffler, and her chief opponent was
Democrat Raphael Warnock. As no candidate in either of Georgia’s two Senate contests
exceeded 50 percent of the total vote cast, which under Georgia law is required to win an
election outright, on January 5, 2021, there will be a special election in Georgia, with Loeffler
and Warnock facing each other in a run-off alongside the rematch between Perdue and Ossoff.
In Georgia’s official election administration data, the state’s two United States Senate
races are called “US Senate (Perdue)” and “US Senate (Loeffler).” To maintain consistency
with official data, we adopt this naming convention as well.
Beyond the presidential and senate races, the three ballot measures considered by Geor-
gia voters in 2020 concerned fees and taxes collected in Georgia, state and local sovereign
immunity, and a tax exemption for charities.13
Heading into November 3, 2020, every indication pointed to robust voter turnout in
election ‘catastrophe’ in largely minority areas sparks investigation,” NBC News, June 9, 2020, avail-
able at https://www.nbcnews.com/politics/2020-election/georgia-secretary-state-launches-
investigation-after-unacceptable-voting-problems-n1228541 (last accessed November 9, 2020).
11
These figures are based on official Georgia election data. See Appendix A for an explanation of the data
used in this paper.
12
In Georgia, recount procedures allow a candidate to request a recount if the number of votes separating
the candidates in a race is less than 0.5 percent of total votes cast (O.C.G.A. § 21-2-495 (2019)(c)(1)).
13
For details on these measures, see “Voters to decide three statewide ballot measures,” The At-
6Georgia. Over 2.6 million voters had cast early in-person ballots prior to November 3, and
an additional 1.3 million voters cast mail ballots; combined, these early votes accounted for
roughly four-in-five of the approximately five million ballots cast in the election.14 There were
also indicators that the presidential contest would be close. Although Trump won Georgia
in 2016 (McKee, Smith and Hood, 2019), statewide support for Democratic candidates had
started to tick upward in 2008, driven in large part by Black turnout, what Huang and Shaw
(2009) have called the “Obama effect.” Even though Obama did not actively campaign in
Georgia in 2008, the election of the nation’s first African-American president energized the
state’s Black electorate (McKee, Hood III and Hill, 2012). Indeed, by the 2018 midterm
elections, Democratic gubernatorial candidate Stacey Abrams nearly won an upset victory
over Republican Brian Kemp (Hood III and McKee, 2019).
It is interesting to consider whether either Trump’s or Biden’s presidential campaign
might have been bolstered by the unusual circumstance of two United States Senate races
on the 2020 ballot in Georgia. Republican incumbent Senator Perdue faced a stiff challenge
from Democrat Ossoff, who narrowly lost a competitive race for a seat in the United States
House of Representatives in a June 2017 special election. And, appointed Senator Loeffler
faced a panoply of candidates, including Democrat Warnock, in a so-called jungle primary.15
How these dual Senate races may have affected the 2020 presidential contest is a subject for
future research.
lanta Journal-Constitution, September 28, 2020, available at https://www.ajc.com/politics/election/
voters-to-decide-three-statewide-ballot-measures/L72DS45K2JAVVDGYLBYGSCNTRA/ (last accessed
November 10, 2020).
14
See US Elections Project, “2020 General Election Early Vote Statistics, Georgia Early Voting Statistics,”
available at https://electproject.github.io/Early-Vote-2020G/GA.html (last accessed November 9,
2020).
15
See “David Perdue and Jon Ossoff advance to Georgia Senate runoff,” Vox, November 6, 2020, available
at https://www.vox.com/2020/11/5/21537684/senate-results-georgia-perdue-jon-ossoff-runoff
(last accessed November 8, 2020).
7Residual vote rates in Georgia statewide contests
We now turn to residual votes cast in Georgia in the 2020 General Election. Broadly speak-
ing, our analysis moves from general to specific, starting with statewide figures and then
transitioning to county-level and precinct-level results. Our final results section breaks down
residual votes into undervotes and overvotes and focuses attention on one Georgia county
that has anomalous residual votes in the US Senate (Loeffler) race.
Residual votes and ballot roll-off
Residual votes do not usually swing major contests for elected office (Stewart III, 2014;
Stewart III et al., 2020). There are some execptions, though. Most prominently, in Florida’s
2000 General Election the presidential overvote rate in Duval County was more than 50
times greater than corresponding rates in other Florida counties (Leib and Dittmer, 2002;
Mebane, 2004). In the 2006 midterm election in Florida, a ballot design in Sarasota County
lead to a substantial undervote in the state’s 13th Congressional District (Frisina et al., 2008).
Other elections have not been immune to ballot design-induced overvotes and undervotes,
and several contests in North Carolina exemplify the way that ballot design can influence
residual vote rates and candidate choices (Hamilton and Ladd, 1996; Ho and Imai, 2006;
Herrnson, Hanmer and Niemi, 2012).
Residual votes are related to the phenomenon known as ballot roll-off, by which voters,
faced with an extensive set of races, stop voting before reaching the ends of their ballots (e.g.,
Mueller, 1969; Magleby, 1984; Charles S. Bullock and Dunn, 1996; Nichols, 1998). Roll-off—
in this case undervotes—leads to residual votes, and literature has shown that races lower
down on the ballot tend to have disproportionately more residual votes.
16
The precincts column in Table 1 specifies for each contest the number of precincts in our Georgia data that
reported votes. Two of the races in the table (Constitutional Amendment # 1 and Statewide Referendum
A) have precinct totals that appear incomplete.
8Statewide residual vote rates
For the eight statewide contests in Georgia in 2020, Table 1 provides precincts reporting, total
votes cast, total residual votes, and residual vote rates.16 This table reveals that the residual
vote rate in the presidential contest was approximately 0.37 percent, a number relatively
low compared to presidential residual vote rates in the 2016 General Election (Stewart III
et al., 2020). Low residual vote rates are indicative of voter engagement and interest, and
a presidential residual vote rate of 0.37 percent shows that the vast majority of voters who
turned out in Georgia to cast ballots either prior to or on Election Day itself were able to
register their presidential preferences. As an initial audit result, a low presidential residual
vote rate should be considered normatively pleasing.
Table 1: Residual vote rates in statewide races
Contest Precincts Votes Residual votes Rate
President of the United States 2,656 4,998,171 18,389 0.37
US Senate (Perdue) 2,656 4,947,130 69,430 1.38
US Senate (Loeffler) 2,656 4,907,080 109,480 2.18
Public Service Commission District 1 2,500 4,469,723 130,379 2.83
Public Service Commission District 4 2,500 4,431,905 168,197 3.66
Constitutional Amendment #1 2,493 4,322,596 270,378 5.89
Constitutional Amendment #2 2,500 4,289,852 310,250 6.74
Statewide Referendum A 2,480 4,282,930 274,970 6.03
Moving downward in Table 1, the next two races are US Senate (Perdue) and US Senate
(Loeffler). Both of these races for federal office had higher residual vote rates than the
presidential contest. This is typical in American elections (but certainly could have been
very different if one or both of the Senate races were not competitive). Moverover, the first
United States Senate race (Perdue) had a lower residual vote rate than the second such race
(Loeffler). Again, this is not surprising given the ordering of these two races.
The two Public Service Commission races in Table 1 follow similar patterns. Their
residual vote rates are higher than the rates for preceeding races, and the District 4 residual
vote rate is greater than the District 1 rate. Further down the ballot, the three ballot
9measures have even greater numbers of residual votes, which is consistent with previous
research (Mueller, 1969; Magleby, 1984).
In a set of five statewide candidate races in Georgia’s 2020 election—and here we note
that five is a small number—it would not have been particularly troubling had we observed
differences between statewide residual vote rates and the order in which races appeared
on ballots. However, even this caveat is not necessary here. Rather, Table 1 shows that
residual vote rates in top statewide races in Georgia in 2020 were monotonically increasing
in ballot position. We observe the same pattern for the three statewide ballot measures: a
rising residual vote rate as one goes down the ballot. These forms of internal consistency
are normatively pleasing from the perspective of the administration of the 2020 election in
Georgia.
In what follows, we do not focus much attention on the two statewide Public Service
Commission races or the three statewide ballot measures that appear in Table 1. Our
general findings on 2020 residual vote rates in Georgia hold independently of whether we
consider residual votes cast in these races.
Residual vote rates in Georgia’s counties and precincts
We now extend our analysis of statewide residual vote rates in the 2020 General Election by
assessing residual vote rates across Georgia’s 159 counties.
President and Senate residual vote rates by county
A county-level analysis can provide evidence of internal consistency in residual vote rates in
statewide races. By analyzing counties, we can assess whether a given statewide result on
the nature of residual votes in Georgia in 2020 reflects patterns in all (or almost all) counties
or in a small set of counties. In addition, individual counties in Georgia administer elections,
subject to state and federal laws. With a county-level analysis, we can identify anomalies in
10residual vote rates that appear in a single county.
Figure 2 plots county-level presidential residual vote rates against residual vote rates
from US Senate (Perdue) (left panel) and US Senate (Loeffler) (right panel). Each panel in
the figure also contains a gray 45-degree line. If a county’s presidential residual vote rate
were identical to its residual vote rate in US Senate (Perdue), then in the left panel of Figure
2 the county’s point would fall on the pictured 45-degree line. However, it is evident in this
panel that all 159 county points fall above the line, indicating that, for each Georgia county,
the presidential residual vote rate in the 2020 General Election was smaller than the residual
vote rate in US Senate (Perdue). A similar statement applies to presidential and residual
vote rates in US Senate (Loeffler).
Figure 2: Presidential and senate residual vote rates, by county
US Senate (Perdue) US Senate (Loeffler)
8
Senate residual vote rate
6
4
2
0
0 2 4 6 8 0 2 4 6 8
Presidential residual vote rate
Note: each point denotes a single Georgia county, and points are sized proportionally to
number of ballots cast in the county.
11It is clear from Figure 2 that not only was the statewide presidential residual vote rate in
Georgia lower than corresponding residual vote rates in US Senate (Perdue) and US Senate
(Loeffler), but this same regularity holds across all 159 Georgia counties. Moreover, there
do not appear to be any anomalous counties in the two panels of Figure 2. While Georgia’s
159 counties did not have identical residual vote rates in US Senate (Perdue) and US Senate
(Loeffler)—residual vote rates tended to be higher in the latter—no county appears strikingly
at odds with the others.
President and Senate residual vote rates by precinct
Continuing our movement from larger to smaller units, Figure 3 contains three histograms
of precinct-level residual vote rates in the 2020 General election. The panels correspond to
the presidential race (left), US Senate (Perdue) (middle), and US Senate (Loeffler) (right).17
Each panel incorporates data from over 2,500 precincts.
Figure 3: President and Senate residual vote rates, by precinct
President US Senate (Perdue) US Senate (Loeffler)
0.03
Density
0.02
0.01
0.00
0.0 2.5 5.0 7.5 10.0 0.0 2.5 5.0 7.5 10.0 0.0 2.5 5.0 7.5 10.0
Residual vote rate
The precinct-level figures reinforce what we have already seen in our statewide results:
presidential residual vote rates in precincts tend to be lower than residual vote rates from
US Senate (Perdue) which themselves are lower than residual vote rates from US Senate
17
The histograms in Figure 3 are truncated at ten percent. There are two precincts with residual vote
rates greater than this quantity across the three races described in the figure.
12(Loeffler).
Figure 3 illustrates that precinct-level residual vote rates in the contest for President of
the United States exhibit less variability than those of the two Senate races. This reflects
the fact that there is less variability in aggregate (here, precinct-level) residual vote rates
when the underlying rate is close to zero, as it is in the presidential race.
Undervote and overvote rates in Georgia
We now break down the residual vote rates that we have analyzed above into undervote and
overvote rates. The distinction between these two rates is an important one. Undervotes
can be interpreted as intentional abstentions, and voters are entirely within their rights to
abstain from voting in any race that they choose. Thus, an elevated or otherwise anomalous
undervote rate is not necessarily a sign of a problem in election administration.
Overvotes, however, may be interpreted differently with respect to voter intent. When,
say, a voter casts two votes for President, an action which invalidates both votes, this likely
indicates the voter’s fundamental misunderstanding of how many candidates one may vote
for in a given contest. It could also indicate an administrative failure of some sort, like a
misleading ballot design. In the 2000 presidential election in Duval County, Florida, which
we mentioned earlier, there were a plethora of presidential overvotes. Mebane (2004) shows
that these reflected an adminsitrative choice made by Duval County officials to spread the
ten presidential candidates running for office in Florida across two ballot pages.
Undervote and overvote rates across Georgia’s counties
We begin by plotting against each other overvote and undervote rates from all eight of
Georgia’s statewide contests in the 2020 General Election. Each point in Figure 4 represents
one county and one race where these races are listed in Table 1. All told, Figure 4 contains
18
Not every county-race pairing for the eight statewide races in Georgia is represented in Figure 4. The
reason for this is the fact that some counties have what appear to be incomplete results for the 2020 General
13over 1,200 points, representing Georgia’s 159 counties times eight statewide races, each with
a corresponding pair of overvote and undervote rates.18
Figure 4: Undervote and overvote rates in statewide contests, by county
1.5
1.0
Overvote rate
0.5
0.0
0 10 20 30
Undervote rate
Note: each point denotes a county-race pair, and points are sized proportionally to number
of ballots cast in the county.
The figure has several implications. First, undervoting in Georgia’s statewide races in
2020 was much more common than overvoting. Note that the figure’s axes are not identical:
the undervoting axis in Figure 4 stretches from zero to 30 percent and the overvoting axis,
from zero to 1.5 percent. This implies that the majority of the residual votes enumerated in
Table 1 are undervotes.19
Second, Georgia counties with the greatest 2020 election turnout, where undervote rates
are more statistically meaningful than in counties with fewer voters, tended to have lower
undervote rates. The large circles in Figure 4 are in general smaller than ten percent.
Third, the vast majority of county-race points in Figure 4 are located close to the figure’s
Election. See fn. 16.
19
Although not directly apparent in Figure 4, the high undervote rates in the figure are from the three
14horizontal axis, connoting overvote rates that are zero or extremely close to zero.
Fourth, there is an exception to this rule. One large county circle has an overvote rate
over one percent, and this circle stands out in Figure 4. As we discuss in detail in the next
section, this anomolous county is Gwinnett County, and the outlier overvote rate involves
US Senate (Loeffler).
Overvoting and absentee ballots in US Senate (Loeffler)
As discussed previously, US Senate (Loeffler) featured 20 candidates (plus a write-in option)
as opposed to the US Senate (Perdue) race, which had only three candidates (plus a write-in
option). Figure 5 shows the distribution of undervote and overvote rates in US Senate (Loef-
fler) across Georgia’s counties and facilitates a comparison of these rates with corresponding
undevote and overvote rates from the other seven statewide races listed in Table 1. In the
figure, there is a distinct vertical pattern of points in the left panel (US Senate (Loeffler))
compared to a distinct horizontal pattern of points in the right panel (other contests).
Drawing on Figure 5, we suspect that the presence of so many candidates on the ballot
in US Senate (Loeffler) may have confused voters, leading them to vote for multiple can-
didates. This seems particularly plausible insofar as there were multiple Senate candidates
in US Senate (Loeffler) listed as being associated with the Republican party and multiple
candidates associated with Democratic party as well. We cannot know from our aggregate
data if predominantly Democratic (Republican) voters overvoted in US Senate (Loeffler) by
choose multiple Democratic (Republican) candidates, but this would be worth investigating.
The pattern of points in Figure 5 highlights a potential tradeoff between ballot access for
candidates and the risk of voter confusion in the presence of a large number of candidates.
Indeed, a rationale for the infamous butterfly ballot in Palm Beach County, Florida, which
Wand et al. (2001) show was pivotal to the 2000 presidential election outcome, was the
presence of ten candidates for President and the desire of Palm Beach County elections
statewide ballot measures in Table 1.
15Figure 5: Undervote and overvote rates in statewide contests, separating out US Senate
(Loeffler), by county
US Senate (Loeffler) Other races
1.5
1.0
Overvote rate
0.5
0.0
0 10 20 30 0 10 20 30
Undervote rate
Note: each point denotes a county-race pair, and points are sized proportionally to number
of ballots cast in the county.
officials to list in a compact way all of the presidential candidates on one page and not use
small font.
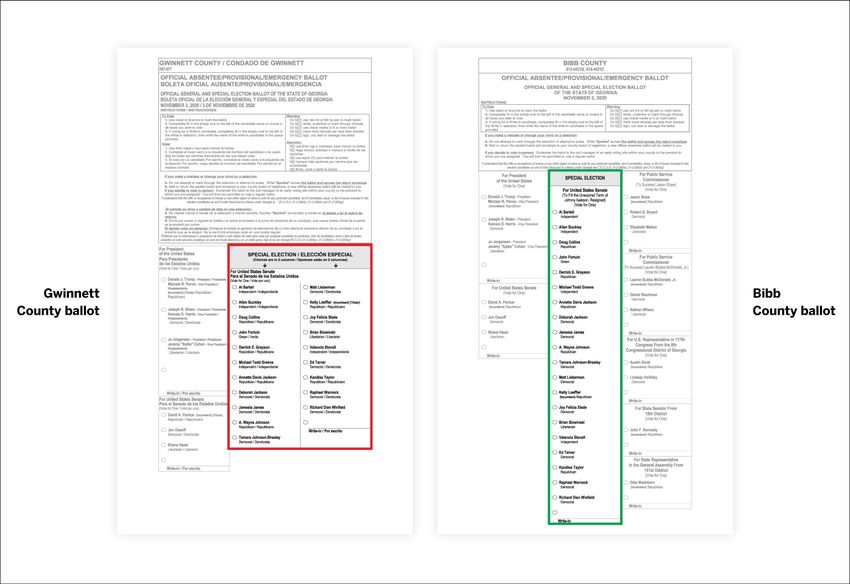
Overvoting in Gwinnett County in US Senate (Loeffler)
Contests with 20 candidates pose ballot design challenges. In dealing with the plethora of
candidates, Gwinnett County, the second most populous county in Georgia with respect to
registered voters,20 opted for a two-column ballot design for the US Senate (Loeffler) race.
Figure 6 displays a copy of the first page of Gwinnett County’s ballot on the left, which can
20
See Georgia Secretary of State, “Voter Registration Statistice,” available at https://sos.ga.gov/
index.php/Elections/voter_registration_statistics (last accessed November 11, 2020).
16be contrasted with the first page of Bibb County’s ballot on the right. The Gwinnett County
ballot lists the candidates for US Senate (Loeffler) in two adjacent columns. In contrast, the
first page of the Bibb County ballot lists the candidates for US Senate (Loeffler) in a single
column. This is a clear difference in the ballot design for the US Senate (Loeffler) contest.
And it is a potentially consequential difference if the two-column ballot leads to confusion.
Figure 6: Sample ballots from Gwinnett County and Bibb County (first page shown)
Graphic from the Brennan Center for Justice (https://www.brennancenter.org/our-work/research-
reports/georgia-ballot-design-problems-and-what-do-about-them).
Because of the prevalence of Spanish language minorities, Gwinnett County is the only
county in Georgia covered under Section 203 of the Voting Rights Act.21 Section 203 requires
covered jurisdictions to provide language assistance in the form of bilingual election material
to their voters. Therefore, ballots in Gwinnett County are bilingual, with English and
Spanish text side-by-side. Bilingual ballots require more space, which potentially explains
21
“Section 203 of the Voting Rights Act,” United States Census Bureau, available at https://www.census.
gov/content/dam/Census/newsroom/press-kits/2017/esri/esri_uc2017_voting_rights_act.pdf
(last accessed November 12, 20200).
17why Gwinnett County chose a two-column format to display the 20 candidates in US Senate
(Loeffler) rather than displaying them in a single, long column.
The Brennan Center for Justice raised an alarm over Gwinnett County’s ballot format
and Georgia’s special election for a seat in the United States Senate. “While most Georgia
counties have been able to fit all the candidates in a single column,” the Brennan Center
noted more than a month prior to Election Day, Gwinnett County’s decision to split the
contest into two columns was “one of the biggest design mistakes we have seen since we
began reviewing ballots more than a decade ago, because voters interpret the two columns
as belonging to different contests and vote once in each column, thereby invalidating their
vote.”22 The Brennan Center warned that the two-column ballot design “is an especially big
challenge for voting by mail, because there is no message from a polling place scanner or an
electronic marking screen warning that a voter has selected more candidates than allowed.”
Table 2: Rate of overvotes for US Senate (Loeffler)
Overvotes Mail votes Rate
Gwinnett County 4,564 115,140 0.040
All other counties 3,230 1,166,360 0.003
All counties combined 7,794 1,281,500 0.006
As Table 2 reveals, there were 4,564 overvotes in the US Senate (Loeffler) contest from
Gwinnett County; this is more than the total 3,230 overvotes cast in this contest in all other
counties in Georgia. Therefore, almost 60 percent of the overvotes in the US Senate (Loeffler)
contest were from Gwinnett County alone. This is extraordinarily high given that Gwinnett
County is responsible for only about nine percent of the 1,281,500 mail votes cast in the US
Senate (Loeffler) contest. With 115,140 mail votes counted in Gwinnett County, there was
one overvote for every 25 mail votes counted (for a rate of 0.04 overvotes per mail vote). In
contrast, all other counties in Georgia saw approximately one overvote for every 360 mail
ballots (for a rate of 0.003 overvotes per mail vote). Therefore the rate of overvotes to mail
22
See “Georgia Ballot Design Problems and What to Do About Them,” Brennan Center for Jus-
tice, September 30, 2020, available at https://www.brennancenter.org/our-work/research-reports/
georgia-ballot-design-problems-and-what-do-about-them (last accessed November 10, 2020).
18votes in Gwinnett County was roughly 13 times greater than in other Georgia counties.
If Gwinnett County had an overvote rate consistent with the rest of Georgia, we would
have expected far fewer overvotes in US Senate (Loeffler). In fact, if Gwinnett County had
the same rate of overvotes to mail votes as all other counties in Georgia, we would have only
expected around 319 overvotes. Therefore, we estimate that the two-column ballot design in
Gwinnett county contributed to approximately 4,245 additional overvotes in the US Senate
(Loeffler) contest. These are votes that were ultimately never counted because they were
invalid.
Undervotes and overvotes in Gwinnett County precincts
As additional evidence regarding the uniqueness of Gwinnett County, we now consider
precinct-level distributions of overvotes on mail ballots cast in US Senate (Loeffler), bro-
ken down by county type.
Figure 7: Overvote rates in US Senate (Loeffler), by precinct
Gwinnett County All other counties
80
Overvotes, US Senate (Loeffler)
60
40
20
0
0 1,000 2,000 3,000 4,000 0 1,000 2,000 3,000 4,000
Absentee by Mail Votes
19To wit, Figure 7 plots the number of overvotes on mail ballots against the number of
mail ballots in two side-by-side panels; precincts in Gwinnett County appear in the left
panel and precincts in all other counties, in the right panel. It is clear that the ratio of
absentee ballots cast to overvotes in Gwinnett County precincts have a much greater vertical
trajectory compared to precincts in Georgia’s other counties. Indeed, in some Gwinnett
County precincts, there were over 70 overvotes in the US Senate (Loeffler) contest for every
500 or 600 absentee ballots cast.
Figure 8: Undervote rates in US Senate (Loeffler), by precinct
Gwinnett County All other counties
300
Undervotes, US Senate (Loeffler)
200
100
0
0 1,000 2,000 3,000 4,000 0 1,000 2,000 3,000 4,000
Absentee by Mail Votes
As evidence that Gwinnett County’s two-column ballot format affected overvotes and
not undervotes, see Figure 8. Focusing on US Senate (Loeffler), this figure makes clear the
similarity in the relationship between mail ballots and undervotes in Gwinnett County and
also outside of it.
20The presidential race in Gwinnett County
Finally, and reflecting the importance and closeness of Georgia’s presidential contest, we
consider the relationship between absentee ballots and residual votes in this race. Did Gwin-
nett County’s ballot design impact presidential residual votes as it affected overvotes in US
Senate (Loeffler)? The answer to this question is, no. That is, we see no evidence that
Gwinnett County’s ballot design affected votes cast for president. The side-by-side panels
of Figure 9 reveal that the relationship between mail ballots and presidential residual votes
in Gwinnett County’s precincts is quite similar to the relationship between mail ballots and
presidential residual votes outside of Gwinnett County.
Figure 9: Residual vote rates in the presidential race, by precinct
Gwinnett County All other counties
60
Residual votes, President
40
20
0
0 1,000 2,000 3,000 4,000 0 1,000 2,000 3,000 4,000
Absentee by Mail Votes
21Discussion
Fair, free, and transparent elections are key features of modern democracy (Katz, 1997). Vote
tallies in elections should reflect the intentions of the eligible voting electorate (Grofman and
Lijphart, 1986), and the presence of residual votes can identify possible breakdowns in the
relationship between voter intentions and election outcomes.
Neither undervoting nor overvoting is prohibited, and there are legitimate reasons why
some voters might wish to engage in these behaviors. Residual votes produced by them,
however, should not be the unintended consequence of ballot design, a matter which varies
considerably across the United States (Niemi and Herrnson, 2003; Kropf, 2014).
With respect to the 2020 presidential election in Georgia, a very close race that is heading
to a recount, we find no evidence of residual vote anomalies. This conclusion holds when we
examine Georgia statewide, when we look at its 159 counties, and when we analyze precincts
within these counties.
However, we do find evidence that a two-column ballot design in Gwinnett County almost
certainly affected the votes of some Georgians in the state’s United States Senate special
election. What looks to be a confusing ballot design in Gwinnett County, one that was flagged
by the Brennan Center in late September 2020, was likely the cause of an inordinately high
number of United States Senate special election overvotes on mail ballots cast in Gwinnett.
These residual votes were likely not pivotal in deciding a victor in the 2020 Senate special
election: the leading candidate in the contest received 32.9 percent of the vote and the second
candidate, 25.9 percent. Both of these figures lie far from the 50 percent threshold that was
needed to win Georgia’s Senate special election outright. Still, because in-person voting in
Georgia in November 2020 was carried out predominantly using voting machines, the voters
who were in the greatest danger of undervoting and overvoting were those who cast mail
ballots. There are no precautions against erroneous ballot marks when filling out a ballot at
home and mailing it in for processing at a later time.
If the intentions of a sufficiently large number of voters are not reflected in the tabulation
22of votes cast in an electoral contest, the outcome of the contest may not reflect the true
intention of the voting electorate. Accordingly, heading into Georgia’s January 5, 2021
runoff election, all eyes should be on ballot designs advanced by the Peach State’s 159
county election administrators. There should also be particular attention on voters casting
mail ballots, making sure that they know how to properly indicate their preferred candidates.
Neither of these efforts should be tall tasks, given that there are only two contests, with two
candidates each, on the January 5, 2021 Georgia statewide ballot.
23References
Ansolabehere, Stephen and Charles Stewart III. 2005. “Residual Votes Attributable to
Technology.” The Journal of Politics 67(2):365–389.
Baringer, Anna, Michael C. Herron and Daniel A. Smith. 2020. “Voting by Mail and Ballot
Rejection: Lessons from Florida for Elections in the Age of the Coronavirus.” Election
Law Journal: Rules, Politics, and Policy 19(3):289–320.
Charles S. Bullock, III and Richard E. Dunn. 1996. “Election Roll-Off: A Test of Three
Explanations.” Urban Affairs Review 32(1):71–86.
Frisina, Laurin, Michael C. Herron, James Honaker and Jeffrey B. Lewis. 2008. “Ballot For-
mats, Touchscreens, and Undervotes: A Study of the 2006 Midterm Elections in Florida.”
Election Law Journal: Rules, Politics, and Policy 7(1):25–47.
Grofman, Bernard and Arend Lijphart. 1986. Electoral laws and their political consequences.
New York, NY: Algora Publishing.
Hamilton, James T. and Helen F. Ladd. 1996. “Biased ballots? The impact of ballot structure
on North Carolina elections in 1992.” Public Choice 87:259–80.
Herrnson, Paul S., Michael J. Hanmer and Richard G. Niemi. 2012. “The Impact of Ballot
Type on Voter Errors.” American Journal of Political Science 56(3):716–730.
Herron, Michael C. and Jasjeet S. Sekhon. 2003. “Overvoting and Representation: An
Examination of Overvoted Presidential Ballots in Broward and Miami-Dade Counties.”
Electoral Studies 22:21–47.
Herron, Michael C., Michael D. Martinez and Daniel A. Smith. 2019. “Ballot design, voter
intentions, and representation: A study of the 2018 midterm election in Florida.” Pa-
per presented at the annual Election Science, Reform, and Administration conference,
University of Pennsylvania.
24Ho, Daniel E. and Kosuke Imai. 2006. “Randomization Inference With Natural Experi-
ments: An Analysis of Ballot Effects in the 2003 California Recall Election.” Journal of
the American Statistical Association 101(475):888–900.
Hood III, MV and Seth C McKee. 2019. “Why Georgia, Why? Peach State Residents’
Perceptions of Voting-Related Improprieties and Their Impact on the 2018 Gubernatorial
Election.” Social Science Quarterly 100(5):1828–1847.
Huang, Taofang and Daron Shaw. 2009. “Beyond the battlegrounds? Electoral college
strategies in the 2008 presidential election.” Journal of Political Marketing 8(4):272–291.
Katz, Richard S. 1997. Democracy and Elections. Oxford: Oxford University Press.
Kropf, Martha. 2014. The evolution (or not) of ballot design ten years after Bush v. Gore. In
The Measure of American Elections, ed. Barry C. Burden and Charles Stewart III. New
York, NY: Cambridge University Press pp. 157–174.
Leib, Jonathan I. and Jason Dittmer. 2002. “Florida’s residual votes, voting technology, and
the 2000 election.” Political Geography 21(1):91–98.
Magleby, David B. 1984. Direct Legislation: Voting on Ballot Propositions in the United
States. Baltimore, MD: John Hopkins University Press.
McKee, Seth C., Daniel A. Smith and MV Trey Hood. 2019. “The Comeback Kid: Donald
Trump on Election Day in 2016.” PS: Political Science & Politics 52(2):239–242.
McKee, Seth C., MV Hood III and David Hill. 2012. “Achieving validation: Barack Obama
and black turnout in 2008.” State Politics & Policy Quarterly 12(1):3–22.
Mebane, Walter R. 2004. “The Wrong Man is President! Overvotes in the 2000 Presidential
Election in Florida.” Perspectives on Politics 2(3):525–535.
Mueller, John E. 1969. “Voting on the Propositions: Ballot Patterns and Historical Trends
in California.” American Political Science Review 63(4):1197–1212.
25Nichols, Stephen M. 1998. “State Referendum Voting, Ballot Roll-off, and the Effect of New
Electoral Technology.” State and Local Government Review 30(2):106–117.
Niemi, Richard G. and Paul S Herrnson. 2003. “Beyond the butterfly: The complexity of
US ballots.” Perspectives on Politics pp. 317–326.
Stewart III, Charles. 2014. The performance of election machines and the decline of residual
votes in the United States. In The Measure of American Elections, ed. Barry C. Burden
and Charles Stewart III. New York, NY: Cambridge University Press pp. 223–247.
Stewart III, Charles, R. Michael Alvarez, Stephen S. Pettigrew and Cameron Wimpy. 2020.
“Abstention, Protest, and Residual Votes in the 2016 Election.” Social Science Quarterly
101(2):925–939.
Tomz, Michael and Robert P. Van Houweling. 2003. “How Does Voting Equipment Affect
the Racial Gap in Voided Ballots?” American Journal of Political Science 47(1):46–60.
Wand, Jonathan N., Kenneth W. Shotts, Jasjeet S. Sekhon, Walter R. Mebane, Michael C.
Herron and Henry E. Brady. 2001. “The Butterfly Did It: The Aberrant Vote for Buchanan
in Palm Beach County, Florida.” American Political Science Review 95(4):793–810.
26A Georgia election data
Election data for Georgia can be found on https://results.enr.clarityelections.com/
GA/105369/web.264614/#/reporting. On this page, links are provided for downloadable
XML data for each of Georgia’s 159 counties. The data is evolving as more votes are
tabulated. We used the Selenium brower simulation tool to scrape the Georgia data.
27You can also read