REPOSITIONED FOR GROWTH - INVESTOR PRESENTATION November 15, 2021 - H&R REIT
←
→
Page content transcription
If your browser does not render page correctly, please read the page content below

REPOSITIONED
FOR GROWTH
INVESTOR PRESENTATION
November 15, 2021

                        INVESTOR PRESENTATION
                               November 15, 2021   1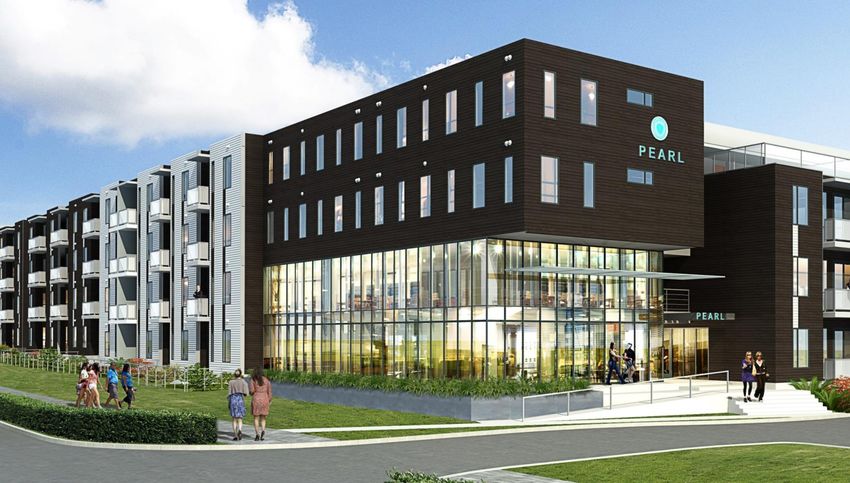
CAUTION      Forward-Looking Statements
             Certain statements made in this presentation will contain forward‐looking information within the meaning of applicable securities laws (also
             known as forward‐looking statements) including, among others, statements made or implied relating to H&R Real Estate Investment Trust’s
REGARDING    (“H&R” or “the REIT”) objectives, strategies to achieve those objectives, H&R’s beliefs, plans, estimates, projections and intentions and statements
             with respect to H&R's strategic repositioning initiatives, including the tax-free spin-off of Primaris REIT, the disposition of H&R's remaining retail

FORWARD-
             assets and the monetization of H&R's ECHO interest, the disposition of office properties without redevelopment opportunities, including in each
             case the proceeds therefrom, H&R's focus on multi-residential and industrial assets and its development pipeline, the benefits to H&R from the
             foregoing, including the impact on H&R's financial metrics, including NAV, H&R's pro forma and target asset mix, H&R's pro forma balance sheet,

LOOKING      Primaris REIT's strategy, capital structure and opportunities, Primaris REIT's development activities, H&R's development pipeline and activities,
             including planned future expansions and building of new properties, the expected yield on cost of H&R's developments and other investments,
             the expected costs and timing of any of H&R's projects and H&R's target business and financial metrics. Statements concerning forward‐looking

STATEMENTS   information can be identified by words such as “outlook”, “objective”, “may”, “will”, “expect”, “intend”, “estimate”, “anticipate”, “believe”, “should”,
             “plans”, “project”, “budget” or “continue” or similar expressions suggesting future outcomes or events. Such forward‐looking statements reflect
             H&R’s current beliefs and are based on information currently available to management. Forward‐looking statements are provided for the purpose
             of presenting information about management’s current expectations and plans relating to the future and readers are cautioned that such
             statements may not be appropriate for other purposes. These statements are not guarantees of future performance and are based on H&R’s
             estimates and assumptions that are subject to risks and uncertainties, including those discussed in H&R’s materials filed with the Canadian
             securities regulatory authorities from time to time, including H&R’s MD&A for the quarter ended September 30, 2021, and H&R’s most recently
             filed annual information form, which could cause the actual results and performance of H&R to differ materially from the forward‐looking
             statements made in this presentation. Although the forward‐looking statements made in this presentation are based upon what H&R believes are
             reasonable assumptions, there can be no assurance that actual results will be consistent with these forward‐looking statements. Readers are also
             urged to examine H&R’s materials filed with the Canadian securities regulatory authorities from time to time as they may contain discussions on
             risks and uncertainties which could cause the actual results and performance of H&R to differ materially from the forward‐looking statements
             made in this presentation. All forward‐looking statements made in this presentation are qualified by these cautionary statements. These
             forward‐looking statements are made as of November 15, 2021 and H&R, except as required by applicable law, assumes no obligation to update or
             revise them to reflect new information or the occurrence of future events or circumstances.
                                                                                        .

             Non-GAAP Measures
             The REIT’s audited annual financial statements are prepared in accordance with International Financial Reporting Standards (“IFRS”). H&R’s
             management uses a number of measures which do not have a meaning recognized or standardized under IFRS or Canadian Generally Accepted
             Accounting Principles (“GAAP”). The non-GAAP measures the REIT’s proportionate share, property operating income (cash basis), Same-Asset
             property operating income (cash basis), Funds from Operations (“FFO”), Adjusted Funds from Operations (“AFFO”), Payout Ratio per Unit as a % of
             AFFO, Interest Coverage ratio, Debt/Earnings before interest, taxes, depreciation and amortization (“EBITDA”) and Net Asset Value (“NAV”), as well
             as other non-GAAP measures discussed elsewhere in this presentation, should not be construed as an alternative to financial measures calculated
             in accordance with GAAP. Further, H&R’s method of calculating these supplemental non-GAAP financial measures may differ from the methods
             of other real estate investment trusts or other issuers, and accordingly may not be comparable. H&R uses these measures to better assess its
             underlying performance and provides these additional measures so that investors may do the same. These non-GAAP financial measures are
             more fully defined and discussed in H&R’s MD&A as at and for the nine months ended September 30, 2021, available at www.hr-reit.com and on
             www.sedar.com.

             Other
             All figures have been reported at H&R’s ownership interest, including equity accounted investments and in Canadian dollars unless otherwise
             stated.
             Balance Sheet figures have been converted at $1.27 CAD for each U.S. $1.00, unless otherwise stated.
             Income Statement figures have been converted at $1.25 CAD for each U.S. $1.00, unless otherwise stated.

                                                                                                                               INVESTOR PRESENTATION
                                                                                                                                      November 15, 2021           2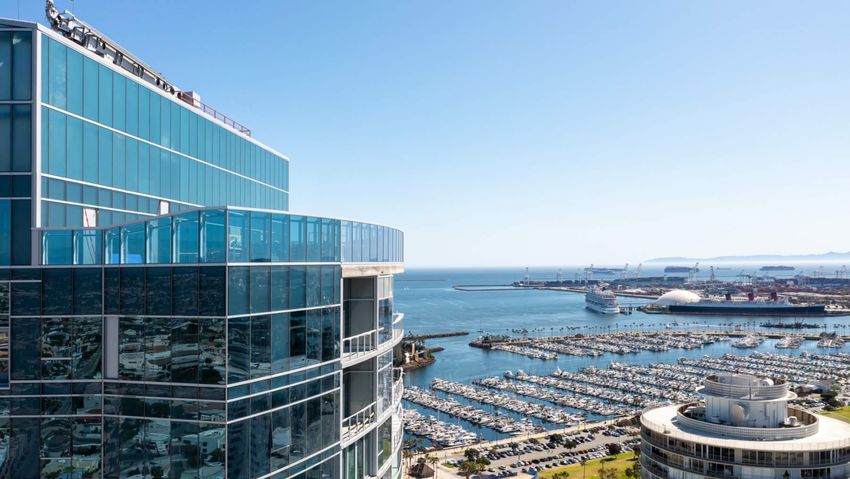
REPOSITIONED
FOR GROWTH

To be a leading owner, operator and
developer of multi-residential and
industrial properties, surfacing value
through asset redevelopment and
greenfield development, funded by
capital recycling.

                                         INVESTOR PRESENTATION
                                                November 15, 2021   3
STRATEGIC
REPOSITIONING INITIATIVES

                       Tax-free spin-off of Primaris including all of H&R’s enclosed malls to
     PRIMARIS          unitholders

                       Disposition of remaining grocery-anchored and essential service retail
     EXIT RETAIL       properties, including ECHO interest

                       Office properties with redevelopment opportunities will be held while
                       remaining office properties will be sold
     EXIT OFFICE
                       Sale of Bow and Bell Campus

                       Reinvest proceeds generated from retail and office dispositions to grow
     FOCUS ON MULTI-   Class A multi-residential and industrial property portfolio, including
     RESIDENTIAL AND   significant development and redevelopment of properties in prime
     INDUSTRIAL        locations primarily within the GTA and high growth U.S. sunbelt and
                       gateway cities

                                                                                  INVESTOR PRESENTATION
                                                                                         November 15, 2021   4
STRATEGIC REPOSITIONING BENEFITS
TRANSFORM FROM DIVERSIFIED TO SIMPLIFIED

  Higher Growth             Enhanced                  Attractive                 Financial
    Properties              Geography               Developments                 Flexibility

Greater exposure to     Enhanced major market     Attractive development   Strong balance sheet
higher growth multi-    presence in the Greater   and redevelopment        enhances financial
residential and         Toronto Area and high     opportunities to drive   flexibility to execute on
industrial, combined    growth U.S. Sunbelt and   future growth            growth plans
with reduced exposure   Gateway cities
to retail and office

                                                                                   INVESTOR PRESENTATION
                                                                                          November 15, 2021   5
TRANSFORM H&R INTO A HIGH-GROWTH
  MULTI-RESIDENTIAL AND INDUSTRIAL PLATFORM

    Investment Properties                      Investment Properties
         Sept 30, 2021                              Post Spin-Off                                       Investment Properties
                                                   January 1, 2022                                          5-Year Target

                      Multi-                   Retail
                                                19%              Multi-
   Retail           Residential
                                                               Residential                         Industrial
    33%                23%
                                                                  30%

                                  Industrial
                                     12%                                              Multi-
                                                                                 Residential 45%

                    Office
Industrial
                     35%
   9%                                                     Office Redevelopment
                                               Office                                                                               Multi-
                                                24%                15%
                                                                                                                                  Residential

                                                                                                                INVESTOR PRESENTATION
                                                                                                                       November 15, 2021    6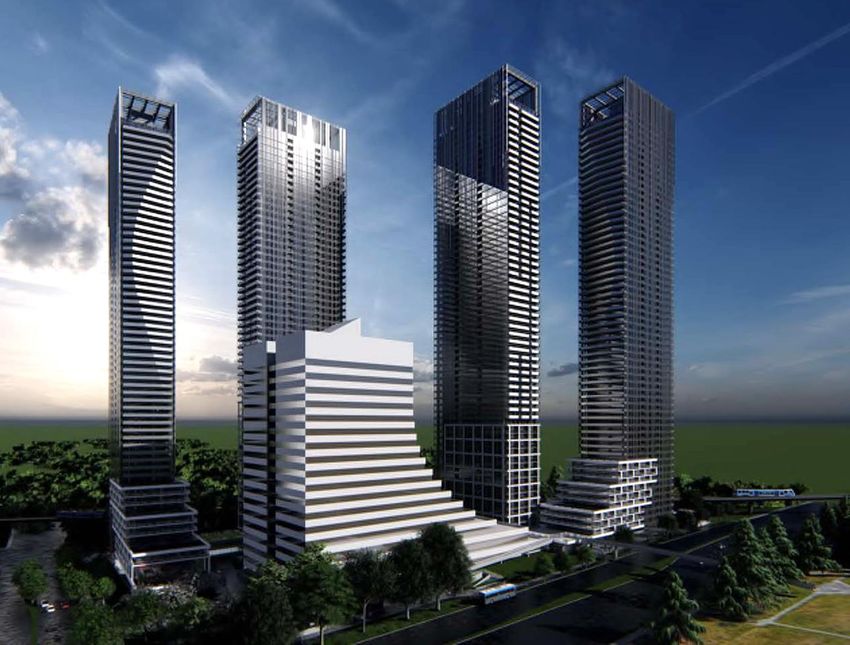
SIGNIFICANTLY INCREASE EXPOSURE TO THE
  GTA AND HIGH GROWTH U.S. SUNBELT
  AND GATEWAY CITIES
          Investment Properties                     Investment Properties
               Sept 30, 2021                                                              Investment Properties
                                                         Post Spin-Off
                                                                                              5-Year Target
                                                        January 1, 2022
                                                                  Alberta
                               Alberta                              7%
      Other                                         Other
       25%                      20%                  23%
                                                                                     Gateway
                                                                             GTA                                            GTA
                                                                                       U.S.
                                                                             21%

Gateway                             GTA
  U.S.                              19%   Gateway
  12%                                       U.S.
                                            17%

                Sunbelt U.S.
                                                                      Sunbelt U.S.
                   24%                                                                           Sunbelt
                                                                         32%
                                                                                                   U.S.

                                                                                                 INVESTOR PRESENTATION
                                                                                                        November 15, 2021         7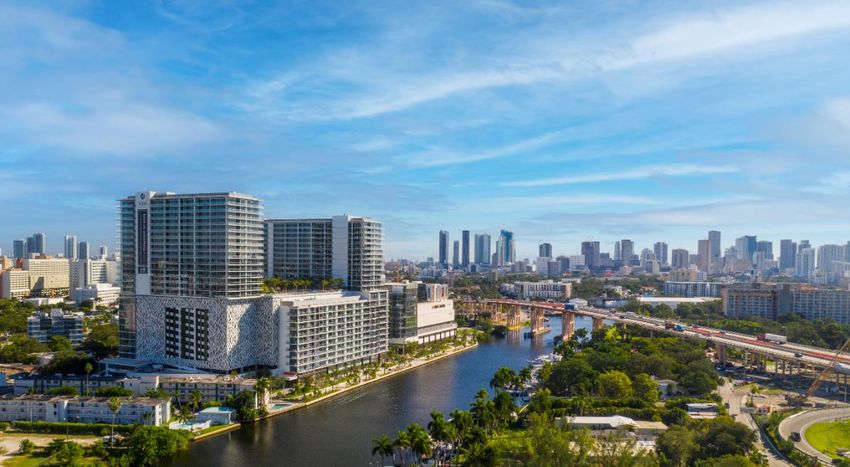
THE NEW H&R OFFERS VALUE
AND GROWTH
Proforma NAV per Unit
                                                                                                              Proforma NAV per Unit

                                                 $22.77                                                       Unit Price1                        $15.63

                                                                             $17.46                           Q3/21 IFRS NAV                     $22.77
           $15.63
                                                               $5.50
                                                                                                              Primaris Distribution²              $5.50

                                                                                                              Proforma H&R NAV³                  $17.46

                                                                                                                H&R Repositioned for Growth

       Unit Price1                         Q3/21 IFRS NAV     Primaris      Proforma   H&R Repositioned for
                                                            Distribution²   H&R NAV³         Growth

1. Stock price as of September 30, 2021.
2. Anticipated value of Primaris distribution.
3. Includes $0.19 of transaction gains.

                                                                                                                               INVESTOR PRESENTATION
                                                                                                                                      November 15, 2021   8
H&R                                                                                                  Favourable impact on operating and credit metrics
                                                                                                     enhancing growth and improving balance sheet
POST SPIN

                                                                                                                    Post Spin
     Key Metrics                                                                       September 30, 2021         January 1, 2022              Impact

     Reduce Calgary Office Exposure                                                       $1.3 billion            $372.5 million

     Reduce Retail Exposure                                                               $4.2 billion             $1.8 billion

     Improve Balance Sheet - Debt/EBITDA                                                     9.9x                      9.5x

     Enhance Growth Profile – Same-Asset Property Operating
                                                                                             0.4%1                    3.0%
     Income (Cash Basis)

     Conservative Payout Ratio as a % of FFO                                                42.5%                    40-50%

     Reduce Leverage – Debt to Total Assets                                                 48.5%                     46.8%

     Create Flexibility - Secured/Total Debt                                                65.6%                     58.5%

     Improve borrower profile - Unencumbered/Unsecured2                                       1.8x                     2.0x

1.    Six-year 2014-2020 Same-Asset Property Operating Income (Cash Basis), average.
2.    Excludes ECHO.

                                                                                                                                        INVESTOR PRESENTATION
                                                                                                                                               November 15, 2021   9
EXIT $3.2 BILLION OF PROPERTIES TO
  FUND MULTI-RESIDENTIAL AND
  INDUSTRIAL DEVELOPMENT PIPELINE

$1.1 billion        $2.1 billion
retail properties   office properties

                                        INVESTOR PRESENTATION
                                               November 15, 2021   10
EXIT REMAINING RETAIL THROUGH DISPOSITION PROGRAM
SYNCHRONIZED TO MATCH CAPITAL FUNDING
REQUIREMENTS
$600 million of high-quality $470 million investment in ECHO,
Grocery-Anchored and Essential Service
Disposition Portfolio
$1.1 billion
grocery-anchored and single- an attractive grocery-anchored sale of retail assets
tenant properties real estate portfolio Lowe’s 11
earmarked for
• 56 properties • Weighted average lease term Metro 11 capital recycling
• 2.8 million square feet 8.6 years Sobeys 9
• Weighted average lease term • 95.9% occupied Walmart 4
8.6 years
• 98.5% occupied Shoppers Drug Mart 2
• Strong covenant tenants Other Essential 19
Total Grocery-Anchored and Essential
56
Service Properties
Interest in Giant Eagle Supermarkets
through investment in ECHO Realty L.P.
REDEPLOYING PROCEEDS FROM DISPOSITIONS TO
FUND MULTI-RESIDENTIAL AND INDUSTRIAL
DEVELOPMENT PIPELINE
INVESTOR PRESENTATION
November 15, 2021 11EXIT OFFICE THROUGH DISPOSITIONS AND
REDEVELOPMENTS
Office to be sold Office to be redeveloped $2.1 billion
• Up to $2.1 billion of office • $1.3 billion of office of office properties to
be sold
• 15 properties • Potential for 5,900 residential units
• 99.5% occupancy • Toronto, ON $1.3 billion
• 4.2 million sf • 310 Front St. W. of office properties held
• Weighted average lease term 9.1 years • 145 Wellington St. W. for redevelopment
• 55 Yonge St.
• 69 Yonge St.
• 100 Wynford Dr.
• Burnaby, BC
• Kingsway
• Montreal, QC
• 200 Bouchard Blvd.
REDEPLOYING PROCEEDS FROM DISPOSITIONS TO
FUND MULTI-RESIDENTIAL AND INDUSTRIAL
DEVELOPMENT PIPELINE
INVESTOR PRESENTATION
November 15, 2021 12REZONING AND REDEVELOPMENT OF
OFFICE PROPERTIES INTO HIGHEST AND BEST USE ~5,900
Residential units
Advance the
rezoning and
redevelopment of
office properties
currently valued
at $1.3 billion into
upscale multi-
residential
properties in
prime locations
within growing
markets
Burnaby Toronto Toronto Toronto
3777 Kingsway 145 Wellington 310 Front 55 Yonge
INVESTOR PRESENTATION
November 15, 2021 13SIGNIFICANT MULTI-RESIDENTIAL AND INDUSTRIAL
DEVELOPMENT PIPELINE
2022 Construction Starts
2,150 residential units
580,000 industrial GLA Primarily U.S.-based,
multi-residential greenfield
Vancouver
1,100 units
development located in
2023 Construction Starts high growth gateway and
Montreal
800 units 1,450 residential units sunbelt cities.
440,000 industrial GLA
2024+ Construction Starts
Toronto
4,000 units
~9,100 residential units Significant pipeline of office to
California New Jersey class A multi-residential and
400 units 2,800 units mixed-use redevelopment
concentrated in prime locations
2024+ Construction Starts within growing markets.
Texas
~2,200,000 industrial GLA
2,300 units
Florida
1,300 units
~12,700
Residential
H&R expects to evaluate each potential development in the context of its capital allocation strategy,
Units
and may elect to pursue development on its own, with capital partners, or sell the developments with
approvals in place, capturing much of the value creation. INVESTOR PRESENTATION
November 15, 2021 142022 AND 2023
CONSTRUCTION STARTS
2022 starts
2023 starts
Expected Industrial GLA Projected Total
Completion (square feet)/ Development Development
Property Geography Use Type Ownership Date Residential Units Yield at Cost Budget ($CAD)
1 Mississauga Rd. N Mississauga, ON Industrial Greenfield 100.0% 2023 330,000 GLA 6.3% $73,000,000
2 Slate Dr. Mississauga, ON Industrial Greenfield 50.0% 2023 250,000 GLA 6.0% $57,000,000
3 West Love Dallas, TX Multi-residential Greenfield 100.0% 2023 400 units 5.7% $124,000,000
4 Largo/Hwy 19 Tampa, FL Multi-residential Greenfield 100.0% 2024 300 units 5.9% $84,000,000
5 Midtown Park Dallas, TX Multi-residential Greenfield 100.0% 2024 350 units 5.7% $112,000,000
6 Sunrise – Phase I Orlando, FL Multi-residential Greenfield 100.0% 2024 300 units 5.9% $113,000,000
7 CityLine Dallas, TX Multi-residential Greenfield 100.0% 2024 300 units 5.6% $93,000,000
8 The Cove – Phase I Jersey City, NJ Multi-residential Greenfield 100.0% 2024 500 units 6.0% $406,000,000
9 Carlsbad San Diego, CA Multi-residential Greenfield 33.3% 2024 100 units 5.6% $37,000,000
10 River Landing – Phase II Miami, FL Multi-residential Greenfield 100.0% 2024 350 units 5.8% $229,000,000
11 North Service Burlington, ON Industrial Redevelopment 100.0% 2024 170,000 GLA 5.6% $45,000,000
12 Prosper – Phase I Dallas, TX Multi-residential Greenfield 100.0% 2025 350 units 5.7% $109,000,000
13 Sunrise – Phase II Orlando, FL Multi-residential Greenfield 100.0% 2025 350 units 5.9% $120,000,000
14 Hercules Project – Phase III Hercules, CA Multi-residential Greenfield 31.7% 2025 100 units 6.0% $42,000,000
15 McNabb St. Markham, ON Industrial Redevelopment 100.0% 2025 270,000 GLA 6.0% $67,000,000
16 Bryan St. Dallas, TX Multi-residential Greenfield 100.0% 2025 200 units 5.0% $114,000,000
Total 1,020,000 GLA/ 3,600 units 5.8% $1,825,000,000
INVESTOR PRESENTATION
November 15, 2021 15PIPELINE OF MULTI-RESIDENTIAL AND
INDUSTRIAL DEVELOPMENTS
2024+
Industrial GLA(Square feet)/
Property Geography Use Type Residential Units 1 2
1 Kingsway Burnaby, BC Multi-residential Redevelopment 1,100 units
2 310 Front St. W. Toronto, ON Multi-residential Redevelopment 500 units
3 145 Wellington St. W. Toronto, ON Multi-residential Redevelopment 500 units
4 55 Yonge Toronto, ON Multi-residential Redevelopment 400 units
5 69 Yonge St. Toronto, ON Multi-residential Redevelopment 100 units
6 100 Wynford Dr. Toronto, ON Multi-residential Redevelopment 2,500 units
3 4
7 200 Bouchard Blvd. Montreal, QC Multi-residential Redevelopment 800 units
8 Prosper – Future Phases Dallas, TX Multi-residential Greenfield 600 units
9 The Cove – Future Phases Jersey City, NJ Multi-residential Greenfield 2,300 units
10 Hercules Project – Future Phases Hercules, CA Multi-residential Greenfield 300 units
11 Industrial Lands Toronto, ON Industrial Greenfield 2,200,000 GLA
Total 2,200,000 GLA/9,100 units
INVESTOR PRESENTATION
November 15, 2021 16H&R STRATEGIC PRIORITIES
TO DRIVE GROWTH
Class A Property High-Quality Disposition Program Financial Flexibility to
Multi-Residential Redevelopment Distribution Facilities Drive Growth
Through the Lantower Advance the rezoning Build and expand the Redeploy proceeds from Maintain a strong, flexible
platform, grow class A for redevelopment of institutional-quality retail and office sales to balance sheet with an
multi-residential property $1.3 billion of office distribution-focused self-fund significant investment grade credit
exposure through properties into upscale industrial platform development pipeline. rating. Reduce leverage
acquisitions and multi-residential through development. over time.
developments in high properties within growing
growth U.S. gateway and markets.
sunbelt cities.
Continue to embed sustainability in every facet of our business and advance our long-term ESG strategy
INVESTOR PRESENTATION
November 15, 2021 17INCREASE CLASS A
MULTI-RESIDENTIAL
PROPERTY EXPOSURE
IN HIGH GROWTH U.S. GATEWAY
AND SUNBELT CITIES
Targeting increased exposure Highly skilled locally-based
to institutional-quality properties property management team
in proven high growth markets
through acquisition and
development
INVESTOR PRESENTATION
November 15, 2021 18Lantower Residential - Prime income-producing multi-residential $3.0B
properties with attractive growth characteristics¹ Fair Value
Multi-Residential Fair Value Number of Units 4.56%
by Geography by Geography Weighted
Average Cap Rate
New York
11%
Texas
New York 19%
32%
7.4%
North Texas Same Property
$3.0B Carolina 33% NOI Growth2
Fair Value of
20%
8,305
Investment units
Properties
95.6%
Occupancy
North Carolina Florida
16% 33%
Florida
36%
6.6 years
1. Figures above are as at September 30, 2021. Average Age
2. Excludes Jackson Park, which has been temporarily negatively impacted by COVID-19.
INVESTOR PRESENTATION
November 15, 2021 19BUILD AND EXPAND THE
INSTITUTIONAL-QUALITY
DISTRIBUTION PLATFORM THROUGH
ACQUISITION AND DEVELOPMENT
INVESTOR PRESENTATION
November 15, 2021 20H&R Industrial - High-quality distribution $1.1B
facilities located in key industrial markets Fair Value
8.4M
Square feet
REIT owned
% of industrial Number of sq.ft. Avg lease Credit Ratings
Tenant rentals locations (in 000s) TTM (years) (S&P)
5.27%
1 Canadian Tire Corporation 26.1% 2 2,104 5.3 BBB Stable Weighted
Average Cap Rate
2 Finning International Inc. 9.3% 15 440 7.0 BBB+ Stable
3 Purolator Inc. 8.0% 12 535 8.0 Not Rated
4 Deutsche Post AG 6.5% 1 343 9.3 Not Rated
5 Unilever Canada Inc. 5.8% 1 372 3.0 A+ Stable
96.4%
Occupancy
6 Hudson's Bay Company 3.4% 1 369 3.8 Not Rated
7 Solutions 2 GO Inc. 2.9% 1 215 10.7 Not Rated
8 The TJX Companies Inc. 2.3% 1 253 0.9 A Stable
30 ft
9 One Jeans Group Inc. 2.2% 1 413 1.6 Not Rated Average Clear
10 Amazon.com Inc. 2.2% 1 164 9.9 AA Stable Height
Total Top 10 68.7% 36 5,208 6.0
98,300 sf
Average
Tenant Size
INVESTOR PRESENTATION
November 15, 2021 21Maintain a strong and flexible BBB (High)
balance sheet with an investment grade credit rating by DBRS
Post Spin, January 1, 2022 $4.3B
Unencumbered
Debt2 to Total Assets Assets1
Lines of Credit
Unsecured 3%
Term Loans
5% >$1.0B
Available under
Senior
Lines of Credit
Unsecured 48.5%
Debentures Unitholders’
15% Equity &
$10.4B Exchangeable
46.8%
2.9x
Proforma Total Units Interest Coverage
Capitalization 53%
Mortgages 3.6%
24% Weighted
Average
Interest Rate
Q3 2021 Post Spin
January 1, 2022
4.7 years
Weighted
Average Term
1. Excludes ECHO. Maturity
2. Debt includes mortgages payable, debentures payable, unsecured term loans and lines of credit.
INVESTOR PRESENTATION
November 15, 2021 22TARGET METRICS
Target business metrics support value creation
strategies
Credit Metrics Target
Debt / EBITDA 3.0x
Secured Debt / Total Debt 2.0x
INVESTOR PRESENTATION
November 15, 2021 23Well-laddered debt maturity schedule
H&R Post Spin, January 1, 2022¹
$900
$800
$700
$600
$500
Secured Unsecured
46% 54%
$400
$300
$200
$100
$0
2022 2023 2024 2025 2026 2027 2028 2029 2030
Mortgage Payments Unsecured Term Loans Senior Unsecured Debentures
1. Per the REIT’s Financial Statements.
INVESTOR PRESENTATION
November 15, 2021 24SUSTAINABILITY AT
H&R
Sustainability at H&R encompasses the
Environmental, Social and Governance
(ESG) features that can materially affect
the long-term value of our company.
We believe that tracking both building
performance and corporate metrics
provides a better indication of overall
achievement and helps contribute to our
exceptional culture.
INVESTOR PRESENTATION
November 27,
OCTOBER 15, 2021 25OUR APPROACH Integrate sustainability priorities into decision
making across all stages of an asset’s lifecycle
TO SUSTAINABILITY
Strategic Planning Acquisitions
H&R’s Executive team The Investment Committee
identifies and assesses oversees and approves acquisitions
material inline with the REIT's strategic
environmental, social plan. H&R conducts environmental
and governance risk due diligence prior to acquiring a
factors as an integral property, including environmental
part of the strategic assessments, undertaking further
planning process. remedial action and monitoring
where necessary.
Asset Management
Development
Our Property Operations
Sustainability initiatives are
and Asset Management
incorporated into our
teams integrate
development and
sustainability
redevelopment projects.
opportunities into their
daily management and
tracking processes.
INVESTOR PRESENTATION
November 15, 2021 26CLIMATE AND
RESOURCE EFFICIENCY
In 2020, H&R expanded its reporting H&R’s like-for-like Greenhouse Gas (GHG) market- 4.1 %
based emissions decreased by over 10% Reduction in normalized
boundary to report utility in 2020 compared to 2019, equivalent to taking emissions intensity in 2019
consumption and emissions where 2,093 passenger vehicles off the road.2
vs. 2018 for H&R Utility
Tracker properties.
H&R has control over utility usage
and/or is able to access utility data.
The result was an increase in data
coverage1 from 22% of 2018 usage 2,920 homes
H&R’s like-for-like electricity use decreased by 9%
(CDP 2019 Reporting) to 62% of 2019 in 2020 compared to 2019. This reduction
usage (CDP 2020 Reporting). is equivalent to the electricity use of 2,920 single-
In 2021, data coverage has been family homes in Ontario.3
9%
further increased to 65%.
1,398 people
H&R’s like-for-like water use decreased by
9.6% in 2020 compared to 2019, equivalent to the
annual household water use of 1,398 people.4
9.6%
1. Complete or partial, as per Sustainability Accounting Standards Board (SASB) definitions
2. Greenhouse Gas Emissions from a Typical Passenger Vehicle (United States Environmental Protection Agency, 2018)
3. OEB Report: Defining Ontario’s Typical Electricity Customer (Ontario Energy Board, 2018)
4. How much water do I use at home each day? (U.S. Geological Survey)
INVESTOR PRESENTATION
November 15, 2021 27DIVERSITY AND
INCLUSION
We recognize that to be successful in a multi-cultural world, we must
embrace and adopt diversity outside of gender, including disability, age,
ethnicity, business experience and sexual orientation. Such diversity is
important to ensure that H&R can draw on a broad range of approaches,
backgrounds, skills and experience to achieve effective stewardship and
management.
As at H&R’s 2021 Annual General Meeting, 30% of the Board of
Trustees are female.
We are proud to share that WOMEN represent the following
percentages of our team:
2020 2019
Senior Executives 45% 33%
All Executives 42% 40%
Overall Workforce 47% 47%
Board of Trustees 25% 12.5%
INVESTOR PRESENTATION
November 15, 2021 28GOVERNANCE
PRACTICES
H&R has established policies governing the tenure and constitution of our Board of Trustees
which will enhance diversity and reduce risk for our organization. Management and the Board
review H&R’s corporate governance practices regularly to ensure alignment with best practices
and provide strong transparency to our unitholders.
• Tenure for all new Trustees is limited to 10 years.
• Beginning in 2016, the REIT has undertaken a comprehensive board renewal process, expanding from 5 to 10 members.
This process was executed in a thoughtful and prudent manner, satisfying the need for change and new perspectives,
while also allowing for continuity and retention of institutional memory.
• Women currently represent 30% of our Board, marking progress on the Board's diversity commitment and achieving the
30% Canada Club goal.
• Independent Board Chairperson.
• Say on Pay vote (95% support for 2021) strongly supports executive compensation.
• Expanded the minimum unit ownership to Trustees and all Executive Officers.
• Clawback policy applicable to all incentive compensation.
INVESTOR PRESENTATION
November 15, 2021 29APPENDIX
30PRO FORMA IMPACT OF DISPOSITIONS
TOP 10 TENANTS
As at September 30, 20211 Post Spin-Off January 1, 20221
Average Average
% of H&R % of H&R
Lease Credit Lease Credit
Rental Number of Owned Rental Number of Owned
Tenant Term to Ratings Tenant Term to Ratings
from Locations sq.ft. (in from Locations sq.ft. (in
Maturity (S&P) Maturity (S&P)
IP 000’s) IP 000’s)
(in Years) (in Years)
1. 12.2% 1 1,997 16.6 BBB- Stable 1. 8.5% 1 845 11.4 BBB- Stable
2. 8.6% 23 2,534 12.9 BBB+ Stable 2. 6.3% 1 660 9.2 A+ Stable
3. 5.6% 1 845 11.4 BBB- Stable 3. 5.5% 4 1,345 11.9 BBB+ Stable
4. 4.1% 1 660 9.2 A+ Stable 4. 5.1% 195 1,610 10.1 Not Rated
5. 3.3% 195 1,610 10.1 Not Rated 5. 3.1% 1 466 9.6 BBB+ Stable
6. 3.0% 19 2,682 5.5 BBB Stable 6. 3.0% 1 472 11.5 BB Stable
7. 2.0% 1 466 9.6 BBB+ Stable 7. 2.8% - - 16.6 BBB- Stable
8. 1.9% 1 472 11.5 BB Stable 8. 2.5% 3 2,110 5.3 BBB Stable
9. 1.6% 13 1,346 12.5 BBB+ Stable 9. 2.5% 13 1,346 12.5 BBB+ Stable
10. 1.2% 17 356 3.9 BBB+ Negative 10. 1.6% 3 270 6.1 AA- Stable
Total 43.5% 272 12,968 12.0 Total 40.9% 222 9,124 10.5
Reduction in Ovintiv exposure from 12% to 3% of rental income
1. Figures above are at H&R’s ownership interest including equity accounted investments
INVESTOR PRESENTATION
November 15, 2021 31River Landing
Miami, FL
Fact Sheet
Urban mixed-use property
341,000 sf of retail space
149,000 sf of office space
528 multi-residential rental units
1,000 feet of waterfront on Miami River,
adjacent to the Health District, close to
downtown Miami
Achieved final completion with the
second residential tower being
transferred from properties under
development to investment properties
in Q2 2021
INVESTOR PRESENTATION
November 15, 2021 32Shoreline Gateway
Long Beach, CA
Fact Sheet
Land acquired July 16, 2018
H&R ownership: 31.2%
35-storey multi-residential tower
consisting of 315 rental units
6,450 sf of retail space
Development budget:
U.S. $71.1M at H&R’s ownership interest
Construction financing:
U.S. $41.1M secured at H&R’s ownership
interest
Will become the tallest multi-residential
tower in Long Beach with views
overlooking the Pacific Ocean
Expected to be completed in Q1 2022
INVESTOR PRESENTATION
November 15, 2021 33Hercules
San Francisco, CA
PHASE II:
“The Grand at Bayfront”
232 multi-residential rental units
including a state-of-the-art fitness center,
bike shop, residents lounge and sporting
club. Total development budget of U.S.
$31.6 million and construction financing
of U.S. $20.7 million has been secured,
both at H&R’s ownership interest.
Expected to be completed in Q4 2021
H&R ownership: 31.7%
38.4 acres of land to be developed into a
waterfront master planned community
which will be surrounded by a future
intermodal transit centre.
INVESTOR PRESENTATION
November 15, 2021 34The Pearl
Austin, TX
Fact Sheet
Multi-residential development site
H&R Ownership: 33.3%
383 multi-residential units
Expected completion: Q4 2021
Close to major technology employers
including Apple, IBM, Oracle and
Samsung, as well as the University of
Texas at Austin and downtown Austin
Development budget:
U.S. $24.4M and construction financing
of U.S. $16.0M has been secured, both at
H&R’s ownership interest
INVESTOR PRESENTATION
November 15, 2021 35West Love
Dallas, TX
Location
Located in West Love mixed-use development with walkable retail
and planned office. Proximity to the Dallas core/downtown allows for
an easy to commute to numerous regional attractions. 5-minute
drive to Southwest Airlines HQ, Dallas Love Field, and Dallas’ largest
medical district.
The Project
West Love will comprise of a five-storey, 400 unit multi-residential
property. Construction is expected to commence in January 2022,
with an expected completion date of 2023.
INVESTOR PRESENTATION
November 15, 2021 36Midtown Park
Dallas, TX
Location
Short drive to Preston Hollow Village and North Park Mall,
underscoring the affluent renter profile. Adjacent to North Central
Express (Hwy 75), benefiting from over 275,000 passing vehicles per
day. 5-minute drive to two separate large medical districts.
The Project
The project will comprise a five-storey building of 350 multi-
residential units. Construction is expected to begin in 2022 and an
expected completion date of 2024.
INVESTOR PRESENTATION
November 15, 2021 37Bayside
Largo, FL
Location
Short drive to one of United States’ top beaches (Clearwater).
Adjacent to US Hwy 19, allowing for access to major employment
centers across the Tampa MSA. 3-minute drive to Tech Data
Corporation, Tampa’s largest public company (#88 on Fortune 500).
The Project
The project will comprise a four-storey building of 300 multi-
residential units. Construction is expected to begin in 2022 and an
expected completion date of 2024.
INVESTOR PRESENTATION
November 15, 2021 383777 Kingsway
Burnaby, BC
Location
H&R has a 50% ownership interest in 3777 Kingsway, which is
located along the Kingsway at the intersection with Boundary Rd.,
directly across from Central Park. The park is 220-acres of green
space including walking trails, playgrounds, and other outdoor
activities.
The Project
• In June 2020, H&R along with its partner, submitted a re-zoning
application for the east and north portions of its 3777 & 3791
Kingsway sites
• The proposal could add four mixed-use high-density towers
including retail and residential uses with approximately 2,200
multi-residential units area and 47,000 square feet of
commercial area.
Re-zoning and site plan approval is expected in Q3 2022
INVESTOR PRESENTATION
November 15, 2021 39145 Wellington St. W.
Toronto, ON
Location
145 Wellington St. W. is located at the junction of Toronto’s
Financial and Entertainment Districts
The Project
In August 2019, H&R submitted a rezoning and site plan approval
application for the redevelopment of 145 Wellington St. W., which is
currently a 13-storey office building
The proposed project would redevelop the subject site with a
full office replacement in a new modern 13-storey podium, topped
with a 47-storey residential tower, for an overall building height of
60 storeys
A total of 123,000 square feet of office space and 1,700 square feet
of grade-related retail and 500 new multi-residential units is
proposed
Re-zoning and site plan approval is expected in Q4 2021
INVESTOR PRESENTATION
November 15, 2021 4055 Yonge
Toronto, ON
Location
55 Yonge is located in the heart of Toronto’s Financial District.
The Project
The site encompass approximately 0.37 acres. The REIT submitted a
re-zoning application in March 2021 to replace the existing 13-storey
office building with a 66-storey residential and office tower with
retail uses on the first two floors.
This further breaks down into approximately 12,000 square feet of
retail space, 146,000 square feet of office space and 400 multi-
residential units.
Obtain approval for re-zoning and site plan in Q1 2023
INVESTOR PRESENTATION
November 15, 2021 41310 Front St.
Toronto, ON
Location
310 Front St. is located at the junction between Toronto’s Financial
and Entertainment Districts
The Project
In April 2021, H&R submitted a combined a re-zoning application
and official plan amendment application for a 69-storey
development including retail, residential and office uses
The development will replace the existing eight-storey office
building at 310 Front St., and will integrate into H&R’s larger office
block which incudes 320 and 330 Front St.
The project will include approximately 118,000 square feet of office,
2,000 square feet of retail and 500 multi-residential units.
Obtain approval for re-zoning and site plan in Q1 2023
INVESTOR PRESENTATION
November 15, 2021 42You can also read