Indianapolis-Carmel-Anderson, Indiana - COMPREHENSIVE HOUSING MARKET ANALYSIS U.S. Department of Housing and Urban Development, Office of Policy ...
←
→
Page content transcription
If your browser does not render page correctly, please read the page content below

COMPREHENSIVE HOUSING MARKET ANALYSIS

  Indianapolis-Carmel-
    Anderson, Indiana
U.S. Department of Housing and Urban Development,
Office of Policy Development and Research
As of October 1, 2019

Share on:
Indianapolis-Carmel-Anderson, Indiana Comprehensive Housing Market Analysis as of October 1, 2019                                                                                Executive Summary 2

Executive Summary
Housing Market Area Description
The Indianapolis-Carmel-Anderson Housing Market Area
(Indianapolis HMA) is coterminous with the 11-county Indianapolis-
Carmel-Anderson, IN Metropolitan Statistical Area (MSA). The HMA
is in the center of the state of Indiana and less than 200 miles
from the cities of Chicago, Illinois, Louisville, Kentucky, Cincinnati,
Ohio, and Columbus, Ohio.

The current population is estimated at 2.07 million, rising an
average of 1.0 percent annually since 2010.

The diverse economy of the HMA, with historic strengths in the
pharmaceutical, insurance and financial services, and automobile
                                                                                                          Tools and Resources
manufacturing industries, along with emerging strengths in
the transportation and logistics and high-tech industries, has                                             Find interim updates for this metropolitan area, and select geographies nationally,
                                                                                                           at PD&R’s Market-at-a-Glance tool.
supported growth and limited the impact of national recessions.                                            Additional data for the HMA can be found in this report’s supplemental tables.
                                                                                                           For information on HUD-supported activity in this area, see the Community Assessment Reporting Tool.

                                                                                                    Comprehensive Housing Market Analysis Indianapolis-Carmel-Anderson, Indiana
                                                                                                      U.S. Department of Housing and Urban Development, Office of Policy Development and Research
Indianapolis-Carmel-Anderson, Indiana Comprehensive Housing Market Analysis as of October 1, 2019                                                                                      Executive Summary 3

Market Qualifiers
Economy                                                              Sales Market                                                                  Rental Market
             Strong, but Slowing: During the                                        Slightly Tight. The average                                                    Slightly Tight. The rental market
             12 months ending September                                             home sales price in the HMA                                                    vacancy rate in the HMA is currently
             2019, total nonfarm payroll jobs                                       rose 5 percent during the 12                                                   estimated at 8.5 percent, down
             increased 0.8 percent, slowing                                         months ending September 2019.                                                  from 12.0 percent in 2010 when
             from a 1.4-percent increase during                                                                                                                    conditions were slightly soft.
             the previous 12 months.
Nonfarm payroll jobs in the HMA recovered from                       The average home sales price in the HMA has                                   A portion of demand in the HMA for rental housing
the Great Recession in 2012, 2 years before the                      increased each year since 2010, exceeding the                                 during the early 2010s was met by single-family
nation, and have been increasing each year since.                    prerecession high in 2013. During the 12 months                               homes shifting to renter occupancy, but some of those
The transportation and utilities sector is the fastest-              ending September 2019, total home sales fell                                  homes have returned to the sales market because
growing sector in the current period of expansion,                   3 percent compared with the previous 12 months,                               sales market conditions improved. The resulting
increasing 25 percent, or by 14,400 jobs, since                      continuing a period of year-over-year decline that                            reduction in available rental inventory has contributed
2013. The professional and business services sector                  began in late 2018. Prices have risen and total sales                         to the tightening of conditions in the overall rental
added the most jobs, 30,400 jobs or 21 percent,                      have fallen, partially due to the limited inventory of                        market. The apartment market is also slightly tight,
and has been the largest employment sector                           homes for sale, which was 2.5 months in September                             with a vacancy rate of 4.5 percent during the third
since 2013. During the 3-year forecast period, job                   2019, down from 2.7 months a year earlier. During the                         quarter of 2019, down from 5.1 percent a year ago.
growth is expected to average 0.8 percent annually,                  3-year forecast period, demand is expected for 19,350                         The average apartment rent increased 5 percent
consistent with the current rate of growth.                          homes, and the 2,500 homes under construction are                             year-over-year, faster than the 3-percent increase for
                                                                     expected to meet a portion of the demand.                                     the nation. During the 3-year forecast period, demand
                                                                                                                                                   for an additional 10,900 rental units is expected. The
                                                                                                                                                   3,800 units under construction are expected to meet
                                                                                                                                                   a portion of that demand.

TABLE OF CONTENTS
Economic Conditions 4                                                                                         3-Year Housing Demand Forecast
Population and Households 9                                                                                                                             Sales Units                    Rental Units
                                                                                                                 Total Demand                             19,350                         10,900
Home Sales Market Conditions 12                                Indianapolis HMA
                                                                                                                 Under Construction                        2,500                          3,800
Rental Market Conditions 17                                   Notes: Total demand represents estimated production necessary to achieve a balanced market at the end of the forecast period. Units under
Terminology Definitions and Notes 20                          construction as of October 1, 2019. The forecast period is from the current date (October 1, 2019), to October 1, 2022.
                                                              Source: Estimates by the analyst

                                                                                                     Comprehensive Housing Market Analysis Indianapolis-Carmel-Anderson, Indiana
                                                                                                         U.S. Department of Housing and Urban Development, Office of Policy Development and Research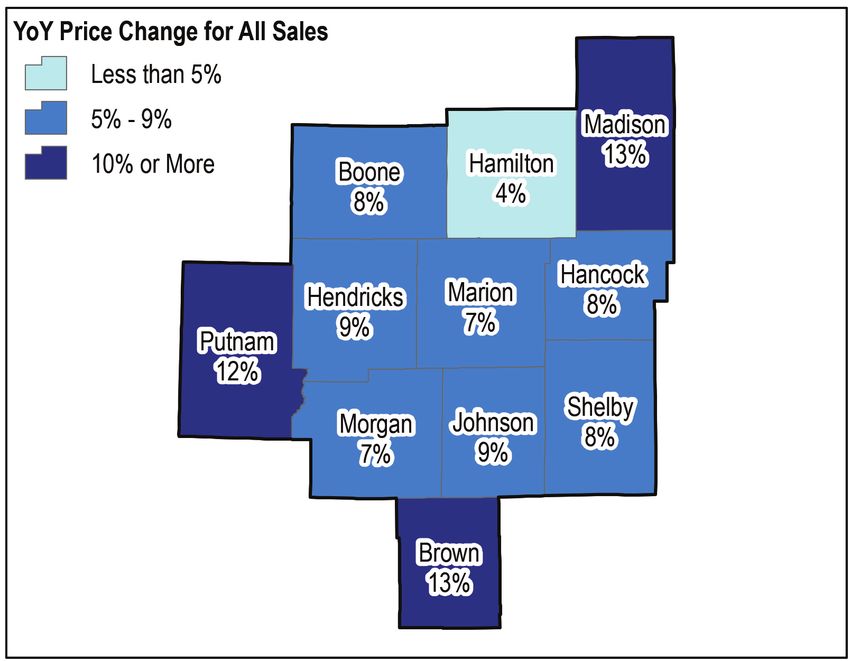
Indianapolis-Carmel-Anderson, Indiana Comprehensive Housing Market Analysis as of October 1, 2019                                                                                    Economic Conditions 4

Economic Conditions                                                                                      Name of Employer
                                                                                                                            Table 1. Major Employers in the Indianapolis HMA
                                                                                                                                                              Nonfarm Payroll Sector                   Number of
                                                                                                                                                                                                       Employees
Largest Sector: Professional and Business Services
                                                                                                         State of Indiana                                     Government                                  33,500

    The logistics and distribution and high-tech industries have become                                  Indiana University Health                            Government                                  23,200
    a larger share of payroll jobs in the 2010s, complementing the                                       St. Vincent Hospitals & Health Center                Education & Health Services                  17,400
    historical employment base in the manufacturing sector and the                                       Federal Government                                   Government                                   16,900
    finance and insurance industry.                                                                      Community Health Network                             Education & Health Services                  11,350
                                                                                                         Eli Lilly and Company                                Manufacturing                                10,000
Primary Local Economic Factors                                                                           Walmart Inc.                                         Wholesale & Retail Trade                       8,925
The logistics and distribution and high-tech industries have emerged with                                Kroger Co.                                           Wholesale & Retail Trade                       7,675
greater prominence in the Indianapolis HMA since the Great Recession.                                    Amazon.com, Inc.                                     Wholesale & Retail Trade                    5,000+
Complementing the existing FedEx Corporation distribution hub at the                                     FedEx Corporation                                    Transportation & Utilities                     5,000
Indianapolis International Airport and CSX Transportation intermodal railroad                            Note: Excludes local governments and school districts.
                                                                                                         Source: Indy Partnership, 2018
hub are new Amazon.com, Inc., Kohl’s Corporation, Chewy, Inc., and several
foodservice distribution centers that opened in the current decade. These
                                                                                                         Figure 1. Share of Nonfarm Payroll Jobs in the Indianapolis HMA, by Sector
companies contributed to approximately 17,000 additional jobs in the logistics
and distribution industry since 2010 (Quarterly Census of Employment and                                                                         Local 7%         Mining, Logging, & Construction 5%
                                                                                                                                   State 3%
Wages). Amazon.com, Inc. and FedEx Corporation are among the largest                                                         Federal 2%
                                                                                                                                                                                  Manufacturing 9%
employers in the HMA (Table 1). In the high-tech-industry, which generally                                            Other Services 4%
includes companies in the professional and business services sector, the                                                                          Government                                Wholesale 5%
                                                                                                                                                      12%
number of large high-tech firms with 1,000 or more employees has increased
                                                                                                         Leisure & Hospitality 10%
from one in the early 2010s to three currently as international high-tech firms                                                                                       Trade 14%              Retail 9%
                                                                                                                                                             Total
opened offices in the HMA. Salesforce.com, Inc. opened an office in downtown                                                                                1,077.8
                                                                                                                                              Education
Indianapolis in 2016, and InfoSys Limited, an IT consulting firm, opened an                                                                    & Health
office in 2017, joining ANGI Homeservices Inc., the operator of household                                                                      Services
                                                                                                                                                 15%
service review repository Angie’s List, as large high-tech employers in the HMA.                                                                                                           Transportation & Utilities 7%
                                                                                                                         Health 13%
                                                                                                                                                                                         Information 1%
In addition to growth in these new industries, the manufacturing sector and
the finance and insurance industry, which have been a part of the economy for                                                    Education 2%
                                                                                                                                                                                   Financial Activities 6%

decades, remain an integral part of the economy. The manufacturing sector has                                                                         Professional & Business Services 16%
generally added jobs each year since 2012, currently accounting for 9 percent                            Notes: Total nonfarm payroll is in thousands. Percentages may not add to 100 percent due to rounding.
of total nonfarm payroll jobs (Figure 1), reversing from the declining payroll                           Based on 12-month averages through September 2019.
                                                                                                         Source: U.S. Bureau of Labor Statistics

                                                                                                    Comprehensive Housing Market Analysis Indianapolis-Carmel-Anderson, Indiana
                                                                                                      U.S. Department of Housing and Urban Development, Office of Policy Development and Research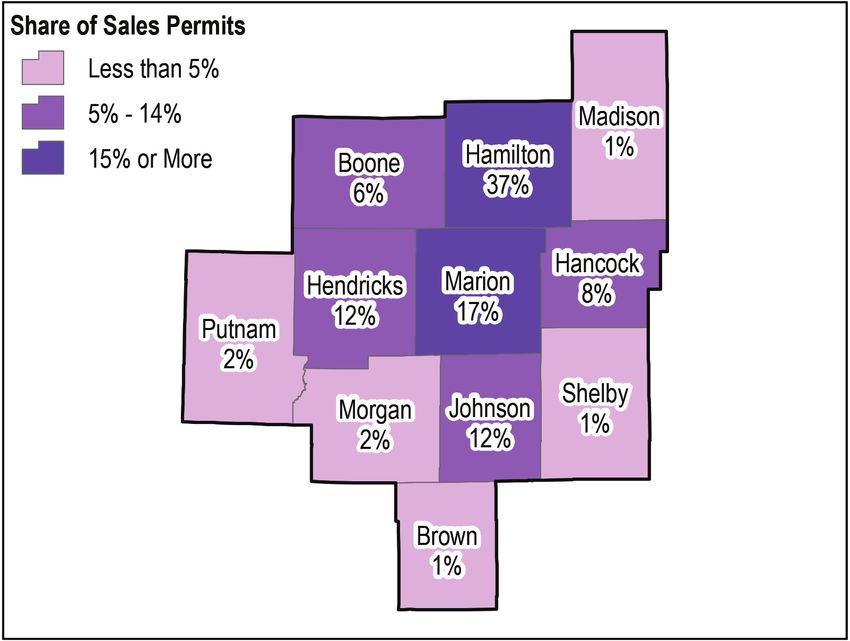
Indianapolis-Carmel-Anderson, Indiana Comprehensive Housing Market Analysis as of October 1, 2019                                                                   Economic Conditions 5

trends of the 2000s. The diverse array of employers within the manufacturing                            14,600 jobs, or 1.4 percent during the previous 12 months and an average
sector, including pharmaceutical manufacturer Eli Lilly and Company, engine                             annual gain of 21,000 jobs, or 2.2 percent, from 2011 through 2017.
builder Rolls-Royce Holdings plc, and smaller companies affiliated with the                             During the most recent 12 months, the number of jobs added in the goods-
automotive industry and the Indianapolis Motor Speedway, have supported slow                            producing sectors was higher than the number added during the previous 12
but sustained post-recession growth. The finance and insurance industry, including                      months, while the number of jobs added in the service-providing sectors was
companies such as Navient Corporation, Government Employees Insurance                                   lower. Payroll expansion occurred in the goods-producing sectors and five of
Company (GEICO), and Liberty Mutual Insurance, has also supported growth in                             the nine service-providing sectors. The education and health services sector
the HMA, with approximately 6,800 jobs added industry-wide since 2010.                                  led growth during the most recent 12 months, increasing by 4,200 jobs, or
                                                                                                        2.6 percent. The opening of new healthcare facilities, including the William
Current Conditions—Nonfarm Payrolls                                                                     K. Nasser, MD, Healthcare Education and Simulation Center, which is part of
The economy in the Indianapolis HMA has been expanding since 2011, but
                                                                                                        the St. Vincent healthcare system, and the Goodman Campbell Brain and Spine
growth slowed during the 12 months ending September 2019 compared with
                                                                                                        facility, supported job growth. The mining, logging, and construction sector was
the previous 12 months, rising at a pace below the average annual gain from
                                                                                                        the fastest growing, expanding 3.3 percent, or by 1,700 jobs. Rapid job growth
2011 through 2017. Total nonfarm payrolls increased by 8,700 jobs, or 0.8
                                                                                                        in the sector was supported by the construction of the first Bus Rapid Transit
percent, during the most recent 12 months (Table 2), slowing from a gain of
                                                                                                        (BRT) line in the city of Indianapolis, which opened in September 2019.
           Table 2. 12-Month Average Nonfarm Payroll Jobs (1,000s)                                      Nonfarm payroll jobs declined in four sectors during the most recent 12 months.
                       in the Indianapolis HMA, by Sector                                               The largest decline was in the financial activities sector, down by 1,200 jobs,
                                       12 Months     12 Months                                          or 1.7 percent, compared with a gain of 2,500 jobs, or 3.7 percent, during the
                                         Ending        Ending         Absolute       Percentage         previous year. The closure of a State Farm office, laying off 100 employees,
                                       September     September        Change          Change
                                          2018          2019                                            contributed to the decline. The leisure and hospitality and the wholesale and
 Total Nonfarm Payroll Jobs             1,069.1        1,077.8            8.7            0.8            retail trade sectors also shifted from gains during the previous 12 months to
 Goods-Producing Sectors                  142.9          146.4            3.5            2.4            losses during the most recent 12 months.
    Mining, Logging, & Construction        51.3           53.0              1.7          3.3
    Manufacturing                           91.7           93.4             1.7           1.9           Current Conditions—Unemployment
 Service-Providing Sectors                926.2          931.4            5.2            0.6            The unemployment rate in the HMA has generally matched or been lower than
    Wholesale & Retail Trade              153.5          152.9           -0.6           -0.4
                                                                                                        the nation since 2000 (Figure 2). In the HMA, the unemployment rate averaged
    Transportation & Utilities              71.4            73.1            1.7          2.4
    Information                            14.0             13.1         -0.9           -6.4
                                                                                                        3.1 percent during the most recent 12 months, down slightly from 3.2 percent
    Financial Activities                   68.9             67.7          -1.2           -1.7           during the previous 12 months. The 12-month average rate in the HMA peaked
    Professional & Business Services       171.7         172.3            0.6            0.3            during the 12 months ending November 2010 at 9.7 percent, and has fallen
    Education & Health Services           159.0          163.2             4.2           2.6            since then, averaging below 5.0 percent since the 12 months ending August
    Leisure & Hospitality                 109.2          108.2            -1.0          -0.9            2015. By comparison, the unemployment rate for the nation averaged 3.7
    Other Services                         46.0            46.2           0.2            0.4            percent during the most recent 12 months, down from 4.0 percent during the
    Government                            132.4           134.7           2.3             1.7
                                                                                                        previous 12 months. The rate for the nation also peaked at 9.7 percent during
Notes: Based on 12-month averages through September 2018 and September 2019. Numbers may not
add to totals due to rounding. Data are in thousands.
                                                                                                        the 12 months ending November 2010 but has only averaged below 5.0 percent
Source: U.S. Bureau of Labor Statistics                                                                 since the 12 months ending August 2016.

                                                                                                    Comprehensive Housing Market Analysis Indianapolis-Carmel-Anderson, Indiana
                                                                                                      U.S. Department of Housing and Urban Development, Office of Policy Development and Research
Indianapolis-Carmel-Anderson, Indiana Comprehensive Housing Market Analysis as of October 1, 2019 Economic Conditions 6
Figure 2. 12-Month Average Unemployment Rate in the Figure 3. 12-Month Average Nonfarm Payrolls in the Indianapolis HMA
Indianapolis HMA and the Nation
National Recession Nonfarm Payrolls
Indianapolis HMA Nation
1,100
10.0 9.7%
Nonfarm Payrolls (in Thousands)
9.0
Unemployment Rate (%)
8.0 9.7%
7.0 1,000
6.0 4.9%
5.0
4.0
4.9% 900
3.0
2.0
1.0
0.0 800
Se 00
Se 05
Se 06
Se 02
Se 08
Se 09
Se 03
Se 04
Se 07
Se 01
Se 10
Se 15
Se 12
Se 16
Se 18
19
Se 13
Se 14
Se 00
Se 06
Se 05
Se 08
Se 09
Se 04
Se 17
Se 02
Se 03
Se 07
Se 11
Se 01
Se 15
Se 16
Se 14
Se 10
Se 18
19
Se 12
Se 13
Se 17
Se 11
p-
p-
p-
p-
p-
p-
p-
p-
p-
p-
p-
p-
p-
p-
p-
p-
p-
p-
p-
p-
p-
p-
p-
p-
p-
p-
p-
p-
p-
p-
p-
p-
p-
p-
p-
p-
p-
p-
p-
p-
Se
Se
Note: Based on the 12-month moving average. Note: 12-month moving average.
Source: U.S. Bureau of Labor Statistics Sources: U.S. Bureau of Labor Statistics; National Bureau of Economic Research
Economic Periods of Significance Offsetting job growth in the service-providing sectors, the manufacturing sector
declined by an average of 2,900 jobs, or 2.6 percent, a year during the same
2001 through 2008
8-year period, shrinking from 14 to 10 percent of total jobs. The financial activities
Nonfarm payroll jobs in the Indianapolis HMA expanded during 7 of the first
sector, which includes the banking industry, was relatively stable during the early
8 years of the 2000s. Job growth averaged 7,100 jobs, or 0.8 percent, annually
portion of the decade, but payrolls declined in the mid to late portion of that
from 2001 through 2008, an average that includes a loss of 4,300 jobs, or decade as early effects of the Great Recession led to job loss in the sector. From
0.5 percent, during 2002 (Figure 3). Gains were concentrated in the service- 2001 to 2008, the financial activities sector declined by an average of 400 jobs,
providing sectors, including additions in the education and health services and or 0.6 percent, annually, with job loss concentrated in 2007 and 2008.
the professional and business services sectors, averaging 3,400 and 2,600 jobs,
or 3.2 and 2.2 percent, annually, respectively. As the sectors grew, each became 2009 through 2010
a more significant part of the economy. The professional and business services As a result of the Great Recession, job loss occurred in the HMA from 2009
sector, which includes some, but not all, finance and insurance and high-tech through 2010, with payrolls falling by an average of 21,200 jobs, or 2.2 percent,
companies, expanded from 12 percent of the total jobs in the HMA in 2000, to annually. During the 2-year period, payrolls in the nation declined an average of
14 percent in 2008. The education and health services sector expanded from 2.5 percent annually, a relatively faster decline compared with the HMA. Jobs lost
10 to 13 percent of nonfarm payroll jobs during the same period. in the HMA in the goods-producing sectors accounted for 60 percent of total job
Comprehensive Housing Market Analysis Indianapolis-Carmel-Anderson, Indiana
U.S. Department of Housing and Urban Development, Office of Policy Development and ResearchIndianapolis-Carmel-Anderson, Indiana Comprehensive Housing Market Analysis as of October 1, 2019 Economic Conditions 7
loss. The most severe losses were in the manufacturing sector, which declined professional and business services sector grew the fastest, up an average
by an average of 7,000 jobs, or 7.4 percent, annually, continuing a decade-long of 4.2 percent, or 6,100 jobs, annually. The transportation and utilities sector,
period of decline. The education and health services sector was the only sector which includes logistics and distribution companies, expanded faster than
to add jobs from 2009 through 2010, expanding by an average of 5,400 jobs, during the previous period of growth, increasing an average of 4.0 percent,
or 4.4 percent, annually. or 2,400 jobs, annually from 2011 through 2017, well above the average
annual increase of 1.8 percent, or 900 jobs, from 2001 through 2008. A $170
2011 through 2017 million expansion of the FedEx Corporation facility adjacent to the Indianapolis
Nonfarm payroll jobs in the Indianapolis HMA increased from 2011 through 2017, International Airport in 2016 supported job growth at the company and
supported by gains in both the goods-producing and service-providing sectors. other companies in the sector, including 425 additional jobs at Knight-Swift
Jobs exceeded the 2008 prerecession high by late-2012, nearly 2 years before Transportation Holdings Inc., a trucking and logistics firm.
the nation, and have continued to expand each year since.
Payrolls in the manufacturing sector declined in the early 2010s before
Supporting recovery early in the 2010s were several public-private partnerships, shifting to a period of expansion beginning in 2012. During 2010 and 2011,
including the $63 million construction of the Indianapolis Cultural Trail. Opened manufacturing sector payrolls fell by an average of 1,800 jobs, or 2.0 percent,
in 2013, the trail supported attraction of corporate offices to downtown well below average annual losses during the 2000s; conversely, payrolls in the
Indianapolis and strengthened the appeal of entertainment districts nearby, sector increased, by an average of 1,400 jobs, or 1.6 percent, annually from
resulting in an economic impact of $864 million in 2015. All sectors except 2012 through 2017. Hiring gains at manufacturing companies include 300 jobs
the information sector added jobs from 2011 through 2017, and eight sectors at NTN Driveshaft, Inc., 160 jobs at Heartland Food Products Group, and 160
expanded faster during the period than in the 2001-through-2008 period. The jobs at Schlage lock company.
Jobs by Neighborhood and Commuting Trends There are no large MSAs adjacent to the HMA that impact commuting patterns,
Within the HMA, jobs are concentrated in several neighborhoods, with different so most jobs in the HMA are filled by residents. Approximately 80 percent
industries concentrated in each area. The downtown Indianapolis business of jobs are filled by a worker living in the HMA, and most of the remaining
district, which includes the Indiana Statehouse capitol building, Indiana 20 percent are filled by residents of other MSAs in Indiana (U.S. Census,
University-Purdue University Indianapolis (IUPUI), and IU Health, accounts for OnTheMap, 2017). Among working residents of the HMA, 86 percent work within
approximately 15 percent of all jobs in the HMA (Map 3). A series of office parks the HMA and most of the remaining 14 percent work elsewhere in the state.
in northern Marion County and southern Hamilton County are the locations of
an additional 15 percent of all jobs, including one-third of all jobs in the finance Employment Forecast
and insurance industry. The area surrounding the Indianapolis International During the 3-year forecast period, job growth is expected to average 0.8
Airport in southwestern Marion County, as well as adjacent southeastern percent annually, which is below the 2011-through-2017 average rate and the
Hendricks County, account for 7 percent of all jobs, including nearly one-third same as the rate during the most recent 12 months. Indy Chamber-announced
of total jobs in the transportation and warehousing industry. company expansions and relocations into the HMA—which generally occur over
Comprehensive Housing Market Analysis Indianapolis-Carmel-Anderson, Indiana
U.S. Department of Housing and Urban Development, Office of Policy Development and ResearchIndianapolis-Carmel-Anderson, Indiana Comprehensive Housing Market Analysis as of October 1, 2019 Economic Conditions 8
Map 3. Share of Jobs by Zip Code in the Indianapolis HMA a multi-year period after the announcement—totaled 7,950 jobs during the most
recent 12 months, down from 11,900 jobs during the previous 12 months and an
Wells
White Cass Miami
Benton
Carroll average of 10,750 jobs during 2015 and 2016.
Grant
Blackford
Howard Sectors and industries that have demonstrated growth during the current period
Warren of expansion, including the manufacturing sector, the high-tech industry and
Tippecanoe
the logistics and distribution industry, are expected to support continued job
Clinton Tipton gains during the forecast period. Announced job growth in the manufacturing
Delaware sector includes 500 jobs at Cummins Inc., an automotive engine manufacturer,
460 jobs at Greenleaf Foods, SPC, and 300 jobs at Allison Transmission, Inc.
Fountain
Madison Building on the skill set of Salesforce.com, Inc. employees, two other customer
Montgomery Boone Hamilton relations management software companies, ActiveCampaign and Bloomerang,
are expected to hire a total of 300 workers. An Amazon.com, Inc. fulfillment
Henry center, the fifth in the HMA, opened in August 2019 and is expected to hire
1,000 workers. All hiring announcements are expected to be fulfilled during
Marion
Hancock the forecast period.
Parke
Hendricks
Putnam
Rush
Shelby
Morgan Johnson
Clay
Owen
Decatur
Jobs by Zip Code Brown Bartholomew
Monroe
Percent of Total
Less than 1%
Ripley
Greene
1.0% - 2.5%
Jennings
Greater than 2.5%
Jackson
Lawrence
Daviess Martin Jefferson
Source: U.S. Census, OnTheMap, 2017
Comprehensive Housing Market Analysis Indianapolis-Carmel-Anderson, Indiana
U.S. Department of Housing and Urban Development, Office of Policy Development and ResearchIndianapolis-Carmel-Anderson, Indiana Comprehensive Housing Market Analysis as of October 1, 2019 Population and Households 9
Population and Households Figure 4. Components of Population Change in the Indianapolis HMA,
2000 Through the Forecast
Current Population: 2.07 million Net Natural Change Net Migration Population Growth
A decline in net natural increase (resident births minus resident 25,000
deaths) has contributed to slower population growth in the current
decade compared with the 2000s. 20,000
Population Change
Population Trends 15,000
Strong job growth, a relatively quick recovery from the Great Recession, and a
10,000
moderate cost of living have supported population growth in the Indianapolis HMA
during the past two decades. The city of Indianapolis was ranked seventh on the
5,000
U.S. News list of Best Affordable Places to Live in the U.S. in 2019, and the HMA was
featured in a 2019 Manhattan Institute report on Midwest Success Stories.
0
Population growth is lower in the current decade compared with the previous 2000-2010 2010-2016 2016-Current
one, mostly because of a reduction in net natural increase. Elevated in-migration Notes: Net natural change and net migration totals are average annual totals over the time period. The
since 2016 has supported relatively higher population growth, but growth remains forecast period is from the current date (October 1, 2019), to October 1, 2022.
Sources: U.S. Census Bureau; current to forecast—estimates by the analyst
below the average during the 2000s. From 2000 to 2010, population growth was
fairly steady each year, averaging 22,950 people, or 1.3 percent (Table 3), with declined to an average of 18,800 people, or 1.0 percent, annually from 2010 to
net natural increase accounting for 57 percent of population growth during the 2016, with net natural increase accounting for 59 percent of that growth, or an
decade, or an average of 13,100 people each year (Figure 4). Population growth average of 11,050 people annually.
Table 3. Indianapolis HMA Population and Household Quick Facts Since 2016, net natural change has fallen further, but rising net in-migration
2010 Current Forecast
resulted in a slight increase in total population growth, averaging 21,050
Population Population 1,887,877 2,074,000 2,128,000 people, or 1.0 percent, annually. Net natural increase averaged 9,725 people
Quick Facts Average Annual Change 22,950 19,600 17,950 a year, or 46 percent of growth. Net in-migration accounted for the majority
Percentage Change 1.3 1.0 0.9 of population growth, as the emerging high-tech industry draws workers from
2010 Current Forecast outside the HMA.
Household
Quick Facts
Households
Average Annual Change
732,184
8,425
809,800
8,175
833,800
8,025
Age Cohort Trends
Percentage Change 1.2 1.1 1.0
In recent years the share of older residents has risen while the share of youth
Notes: Average annual changes and percentage changes are based on averages from 2000 to 2010, 2010 has fallen. The share of residents age 60 and older averaged 18 percent of
to current, and current to forecast. The forecast period is from the current date (October 1, 2019),
to October 1, 2022.
the total population from 2013 to 2017, up from 16 percent during the previous
Sources: 2000 and 2010—2000 Census and 2010 Census; current and forecast—estimates by the analyst 5-year period; during the same period, residents age 19 and younger accounted
Comprehensive Housing Market Analysis Indianapolis-Carmel-Anderson, Indiana
U.S. Department of Housing and Urban Development, Office of Policy Development and ResearchIndianapolis-Carmel-Anderson, Indiana Comprehensive Housing Market Analysis as of October 1, 2019 Population and Households 10
for 28 percent of the population, down from 29 percent (Figure 5). The share Map 4. Average Annual Population Change by Census Tract
of young adults age 20 through 39 was relatively stable, and the share of older in the Indianapolis HMA, 2012-2017
working-age adults, age 40 through 59, declined 1 percentage point as more Carroll
adults in the relatively large “baby boom” generation age into their 60s. The Howard
Grant
growing share of older residents has contributed to lower net natural increase.
Tippecanoe
Most in-migrants are youth and young adults, age 34 or younger; seniors
Clinton Tipton
age 65 and older account for less than 5 percent of in-migrants. The growing
number of seniors in the HMA is mostly because of residents aging in place.
Madison
Figure 5. Population by Age Range in the Indianapolis HMA Boone Hamilton
2012 2017
30 Montgomery
25
Population (%)
20
Putnam
15
Hancock
10 Hendricks Marion
5 Rush
0
19 and Under 20-39 40-59 60 and Over
Clay
Sources: U.S. Census Bureau, 2008–2012 and 2013–2017 American Community Survey, 5-year estimates,
with adjustments by the analyst Johnson Shelby
Morgan
Average Annual
Population by Geography Population Change
Owen
By Census Tract
2012-2017
Decatur
The current population, as well as the population growth in the HMA, are
HMA
concentrated in Marion and Hamilton Counties. Approximately 47 percent Bartholomew
Population Change Monroe
of HMA residents live in Marion County, with 16 percent in Hamilton County Brown
-1% or Below
and 37 percent in the remaining nine counties. Marion and Hamilton, the two Unchanged
largest counties, also had the largest population gains since 2010, up by an Greene
+1% to +3% Jennings
average of 6,225 and 6,725 people, or 0.7 and 2.3 percent, a year, respectively. +3% or Above Jackson
By census tract, most of the fastest-growing areas were also in Marion and Lawrence
Hamilton Counties (Map 4), in or near neighborhoods with a high concentration Source: 2012–2017 American Community Survey 5-year data
Comprehensive Housing Market Analysis Indianapolis-Carmel-Anderson, Indiana
U.S. Department of Housing and Urban Development, Office of Policy Development and ResearchIndianapolis-Carmel-Anderson, Indiana Comprehensive Housing Market Analysis as of October 1, 2019 Population and Households 11
of jobs. Portions of southeastern Boone and northern Johnson Counties were The homeownership rate is down from the 2000 and 2010 rates, and has
also relatively fast-growing partially because homes were built in previously declined faster in the current decade. Renter households accounted for 63
undeveloped areas proximate to existing population and employment centers. percent of household growth in the current decade, a larger share of growth
Only two counties, Putnam and Madison, lost population since 2010, falling compared with the 2000s when renter households accounted for only 44
by an average of 240 and 20 people, or 0.2 and 0.1 percent, annually, percent of additional households. The current homeownership rate is estimated
respectively. Putnam County is relatively rural and somewhat far from the at 64.0 percent, down from 66.8 percent in 2010, and 68.2 percent in 2000
highest concentrations of jobs in the HMA. Residents moved out to be closer (Figure 6).
to jobs and services. Before 2013, Madison County was a separate MSA, the During the next 3 years, household growth is expected to slow from the current
Anderson, IN MSA. A declining number of manufacturing jobs in the county, rate as population growth also slows. An average increase of 8,025 households,
along with residential development in the southwest portion of the county, near or 1.0 percent a year, is expected.
Hamilton County, resulted in a larger share of residents commuting to Hamilton
and Marion counties; the county merged with the Indianapolis-Carmel MSA to Figure 6. Households by Tenure and Homeownership Rate
become the Indianapolis-Carmel-Anderson, IN MSA in 2013. in the Indianapolis HMA
Population Forecast Owner Renter Homeownership Rate
During the next 3 years, population growth is expected to continue, but at a 900,000 68.2 69.0
slower rate compared with the rate since 2010. Net natural increase is expected 800,000 66.8 68.0
to continue to decline as the share of older residents rises. Lower net in-migration
Homeownership Rate (%)
700,000 67.0
is expected because of anticipated slower job growth, attracting fewer residents 600,000 66.0
Households
to the HMA. Population growth is expected to average 17,950 people, or 0.9
500,000 64.0 65.0
percent, annually during the forecast period.
400,000 64.0
Household Trends and Forecast 300,000 63.0
Household growth has also slowed in the current decade compared with the 200,000 62.0
2000s, coinciding with slower population growth in the current decade. The 100,000 61.0
number of households is currently estimated at 809,800, with an average 0 60.0
annual increase of 8,175 households, or 1.1 percent a year since 2010, slowing 2000 2010 Current
from an average annual increase of 8,425 households, or 1.2 percent a year Note: The current date is October 1, 2019.
from 2000 to 2010. Sources: 2000 and 2010—2000 Census and 2010 Census; current—estimates by the analyst
Comprehensive Housing Market Analysis Indianapolis-Carmel-Anderson, Indiana
U.S. Department of Housing and Urban Development, Office of Policy Development and ResearchIndianapolis-Carmel-Anderson, Indiana Comprehensive Housing Market Analysis as of October 1, 2019 Home Sales Market Conditions 12
Home Sales Market Conditions in multifamily buildings or other housing types in 2018, unchanged from 2010
(2010 and 2018 American Community Survey, 1-year data).
Market Conditions: Slightly Tight During the 12 months ending September 2019, average home sales prices rose,
while total sales declined compared with the previous 12 months. A low inventory
Home sales prices have been rising since 2010 due to improved of homes for sale, measuring 2.5 months in September 2019, down from 2.7
economic conditions and a low inventory of homes for sale. Home months in September 2018 (Indiana Association of REALTORS®, with adjustments by
sales declined during the most recent 12 months, continuing a the analyst), constrained the number of sales while supporting an increase in the
period of decline that began in late-2018 when relatively few average sales price. The average home sales price continued a decade-long period
homes for sale constrained the number of homes sold. of growth that began in 2010 and increased 5 percent to $226,400 during the
most recent 12 months. Total home sales, including new and existing home sales,
Current Conditions declined 3 percent year-over-year to 50,400 homes sold during the 12 months
The home sales market in the Indianapolis HMA is slightly tight, improving ending September 2019, continuing a period of decline that began in late 2018. The
from soft conditions in 2010. The vacancy rate is currently estimated at 1.3 previous period of decline occurred from mid-2014 through early 2015.
percent (Table 4), down from 2.7 percent in 2010. Rapid economic recovery Existing home sales accounted for approximately 90 percent of all homes sold
from the Great Recession, lower levels of home construction compared with during the 12 months ending September 2019. Most existing homes sold for less
the 2000s, and a relatively affordable median home sales price supported than $200,000, while most new construction home sales prices were between
improved home sales market conditions in the current decade. The median $200,000 and $399,999 (Figure 7).
home price in the HMA was affordable to 89 percent of households in the HMA
during the third quarter of 2019, compared with 64 percent of households for Figure 7. Share of Sales by Price Range During the 12 Months Ending
the nation (National Association of Home Builders). Nearly all owner-occupied September 2019 in the Indianapolis HMA
homes in the HMA are single-family homes, with just 4 percent of owner units Existing Home Sales New Home Sales
40
Table 4. Home Sales Quick Facts in the Indianapolis HMA 35
Indianapolis HMA Nation 30
Share of Sales (%)
Vacancy Rate 1.3% NA 25
Months of Inventory 2.5 4.1
20
Home Sales Total Home Sales 50,400 5,811,000
15
Quick Facts 1-Year Change -3% -1%
Total Home Sales Price $226,400 $320,700 10
1-Year Change 5% 2% 5
Mortgage Delinquency Rate 1.4% 1.4% 0
NA = data not available. $0 to $100k to $200k to $300k to $400k to $600k and
Notes: The vacancy rate is as of the current date (October 1, 2019). Home sales and prices are for the 12 months $99k $199k $299k $399k $599k More
ending September 2019. Months of inventory and mortgage delinquency data are as of September 2019.
Sources: Months of inventory—National Association of Realtors and Indiana Association of REALTORS®; homes Note: New and existing home sales include single-family homes, townhomes, and condominiums.
sales and prices—Metrostudy, A Hanley Wood Company; mortgage delinquency rate—CoreLogic, Inc. Source: Metrostudy, A Hanley Wood Company
Comprehensive Housing Market Analysis Indianapolis-Carmel-Anderson, Indiana
U.S. Department of Housing and Urban Development, Office of Policy Development and ResearchIndianapolis-Carmel-Anderson, Indiana Comprehensive Housing Market Analysis as of October 1, 2019 Home Sales Market Conditions 13
Home Sales Distressed sales have also become a smaller part of the home sales market in
recent years as economic conditions strengthened. From 2008 through 2012,
Total home sales peaked in 2006 (Figure 8), nearly 2 years before the pre-
distressed sales accounted for 39 percent of all home sales, but have declined
Great Recession nonfarm payroll peak, and reached a low in 2011. Home sales
each year since 2012, accounting for only 6 percent of total sales during the 12
totaled 59,300 in 2006 and fell by an average of 5,300 home sales, or 11
months ending September 2019.
percent, annually during the Great Recession and recovery, to a low of 32,850
in 2011. Home sales began to increase in 2012 when the economy in the HMA
transitioned from recovery to expansion. Economic expansion supported an
REO Sales and Delinquent Mortgages
During the early to mid-2000s, the rate of seriously delinquent mortgages and
average annual increase of 3,400 homes sold, or 8 percent a year, from 2012
real estate owned (REO) properties in the HMA was higher than the HUD-
through 2017 to 53,250 homes sold during 2017. Since 2018, home sales have
defined Midwest region and the nation, but current rates are similar (Figure 9).
declined, partially because of slower job growth and a low inventory of homes
The impact of the foreclosure crisis in the HMA was relatively similar to the
for sale. Home sales have declined by an average of 1,625 homes sold, or
Midwest region and less severe than the nation. The rate peaked in all three
3 percent, a year since 2018.
areas during the same month, January 2010, at 7.9 percent for the HMA, 7.8
Figure 8. 12-Month Sales Totals by Type in the Indianapolis HMA percent for the Midwest region, and 8.6 percent for the nation. The rate in all
three areas fell to 1.4 percent during September 2019, down from 1.7, 1.6, and
Existing Home Sales New Home Sales
1.8 percent, respectively, a year earlier.
60,000
50,000 Figure 9. Percentage of Loans 90 or More Days Delinquent, in Foreclosure,
40,000
or Transitioned to REO in the HMA, Midwest Region, and Nation
Sales Totals
Indianapolis HMA Midwest Region Nation
30,000
in Foreclosure, or Transitioned to REO (%)
9.0
Loans 90 or More Days Delinquent,
20,000 8.0
7.0
10,000
6.0
0 5.0
4.0
06
08
09
07
0
5
6
8
9
2
4
3
7
1
p-1
p-1
p-1
p-1
p-1
p-1
p-1
p-1
p-1
p-1
p-
p-
p-
p-
Se
Se
Se
Se
Se
Se
Se
Se
Se
Se
Se
Se
Se
Se
3.0
Source: Metrostudy, A Hanley Wood Company, with adjustments by the analyst 2.0
1.0
New home sales during the 2000s were a larger part of the home sales market than 0.0
during 2010s, but they have increased in recent years as low inventory of existing
Se 00
Se 06
Se 05
Se 08
Se 04
Se 09
Se 02
Se 03
Se 07
Se 01
Se 10
Se 15
Se 6
Se 8
9
Se 2
Se 13
Se 4
Se 17
Se -11
p-1
p-1
p-1
p-1
p-1
p-
homes for sale has shifted a portion of demand to new construction. New home
p-
p-
p-
p-
p-
p-
p-
p-
p-
p-
p-
p-
p-
p
Se
sales made up 12 percent of total sales during the peak in 2006, 7 percent during Midwest region = Illinois, Indiana, Michigan, Minnesota, Ohio, and Wisconsin. REO = real estate owned.
the low in 2011, and 9 percent during the 12 months ending September 2019. Source: CoreLogic, Inc., with estimates by the analyst
Comprehensive Housing Market Analysis Indianapolis-Carmel-Anderson, Indiana
U.S. Department of Housing and Urban Development, Office of Policy Development and ResearchIndianapolis-Carmel-Anderson, Indiana Comprehensive Housing Market Analysis as of October 1, 2019 Home Sales Market Conditions 14
Home Sale Prices Sales Construction Activity
The average home sales price reached a prerecession peak in 2007 (Figure 10), Homebuilding, as measured by the number of homes permitted, has generally been
1 year after total home sales peaked, and has been above the prerecession rising since the economy recovered from the Great Recession in 2012, supported
high since 2013, 1 year after home sales began to rise. In 2007, the average by strengthening economic conditions and improved sales market conditions. After
home sales price was $179,700, falling an average of $10,350, or 6 percent, declining by an average of 3,375 homes permitted a year from 2006 through 2008,
annually to a low of $158,900 in 2009. Since 2010, the average home sales permitting averaged 4,100 homes annually during the recession-era low period from
price increased an average of 4 percent, or $6,925, annually to $226,400 2008 through 2011 (Figure 11). Full recovery from recession-era job loss in 2012 and
currently. The current average price is $46,700, or 26 percent above the economic expansion supported an average increase of 530 homes permitted each
prerecession high and $67,500, or 42 percent, above the recession-era low. year from 2012 through 2018 to a high of 7,400 homes. In response to slowing job
The declining number of distressed sales, which have an average sales price 30 growth during the 12 months ending September 2019, single-family home permitting
to 45 percent below the average total sales price, has also contributed to rising has fallen to 6,825 homes, down from 7,200 homes during the previous 12 months
average prices as fewer low-priced homes are sold. (preliminary data, with adjustments by the analyst).
Figure 10. 12-Month Average Sales Price by Type of Sale
in the Indianapolis HMA Figure 11. Average Annual Sales Permitting Activity in the Indianapolis HMA
Existing Home Sales New Home Sales Total Home Sales Single-Family Homes/Townhomes Condominiums
16,000
350,000
14,000
300,000 12,000
Average Sales Price ($)
10,000
250,000 8,000
6,000
200,000
4,000
150,000 2,000
0
100,000
9
1
15
16
12
13
14
17
06
5
07
01
01
00
20
20
20
20
20
20
20
20
–2
–2
–2
06
08
09
07
10
15
12
16
18
19
13
14
17
11
08
18
p-
p-
p-
p-
p-
p-
p-
p-
p-
p-
00
p-
p-
p-
p-
20
Se
20
Se
Se
Se
Se
Se
Se
Se
Se
Se
Se
Se
Se
Se
20
Source: Metrostudy, A Hanley Wood Company, with adjustments by the analyst Notes: Includes single-family homes, townhomes, and condominiums. Data for 2019 are through September 2019.
Sources: U.S. Census Bureau, Building Permits Survey; 2000 through 2017—final data and estimates by the
analyst; 2018 and 2019—preliminary data and estimates by the analyst
The gap between the average new and existing home sales prices has widened
since 2007. The average new and existing home sales prices were $240,200
and $172,500 in 2007, a 39-percent difference; whereas, the average new and Sales, Prices, and Construction Activity by County
existing home sales prices were $331,000 and $216,000 during the 12 months Within the Indianapolis HMA, homes sales and homebuilding tend to be
ending September 2019, a 53-percent difference. concentrated in Marion and Hamilton Counties (Maps 5a and 5b), which are also the
Comprehensive Housing Market Analysis Indianapolis-Carmel-Anderson, Indiana
U.S. Department of Housing and Urban Development, Office of Policy Development and ResearchIndianapolis-Carmel-Anderson, Indiana Comprehensive Housing Market Analysis as of October 1, 2019 Home Sales Market Conditions 15
Map 5a. Share of Total Home Sales by County in the Indianapolis HMA Map 5b. Share of Sales Permits by County in the Indianapolis HMA
Notes: 12 months ending September 2019. Includes all homes sold through Indiana listing services. Source: U.S. Census Bureau, Building Permits Survey 2018, with adjustments by the analyst
Source: Indiana Association of REALTORS®
two counties with the fastest-growing population in the HMA. These counties median home sales price in Marion County. The three counties with the fastest
also include or are proximate to areas with a high concatenation of jobs. Marion increase in home sales prices were the farthest from Marion County, while the
County is mostly built-out, with a relatively small portion of vacant land available six counties with price growth similar or slightly higher than Marion County
for development, so fewer homes are permitted in the county, whereas the were adjacent. Hamilton County has the highest-priced homes and the slowest
northern and eastern portions of Hamilton County are generally undeveloped, price growth.
so more land is available to build.
Indicative of price variation in the HMA and specifically higher prices in
Home sales prices tend to be higher outside of Marion County (Map 5c), and Hamilton County, the same model of home, using the same floorplans from the
price growth is stronger (Map 5d). The median home sales price during the 12 same homebuilder, is listed for approximately $50,000 more, or 16 percent
months ending September 2019 was highest in Hamilton County, and 8 of the higher, in Hamilton County than in Hendricks County. The variation in price is
10 counties in the HMA had a median home sales price that was higher than the partially due to variation in land and permitting costs. Ryan Homes is currently
Comprehensive Housing Market Analysis Indianapolis-Carmel-Anderson, Indiana
U.S. Department of Housing and Urban Development, Office of Policy Development and ResearchIndianapolis-Carmel-Anderson, Indiana Comprehensive Housing Market Analysis as of October 1, 2019 Home Sales Market Conditions 16
Map 5c. Median Home Sales Price by County for Total Home Sales Map 5d. Year-Over-Year Price Change by County for Total Home Sales
in the Indianapolis HMA in the Indianapolis HMA
Notes: 12 months ending September 2019. Includes all homes sold through Indiana listing services. YoY = year-over-year.
Source: Indiana Association of REALTORS® Notes: Price change based on median sales price during the 12 months ending September 2018 and September
2019. Includes all homes sold through Indiana listing services.
Source: Indiana Association of REALTORS®
building two single-family subdivisions with the same model of home available at
the 131-lot Holston Hills subdivision in Noblesville, a suburb in Hamilton County, by expected lower job and population growth, construction is also expected to
and a 61-lot phase of the Whitmore Place subdivision in Plainfield, a suburb in be slightly below the current level. Approximately three-fourths of demand is
Hendricks County. More than one-half of the lots in each subdivision has been expected for homes priced below $400,000.
sold. The Cumberland model home is listed for sale starting at $360,000 in the
Hamilton County subdivision and $310,000 in the Hendricks County subdivision. Table 5. Demand for New Sales Units in the Indianapolis HMA
During the Forecast Period
Forecast Sales Units
Demand 19,350 Units
During the 3-year forecast period, demand is expected for an additional 19,350
Under Construction 2,500 Units
homes (Table 5). The 2,500 homes currently under construction are expected Note: The forecast period is from the current date (October 1, 2019), to October 1, 2022.
to meet a portion of demand during the first year of the forecast period. Slowed Source: Estimates by the analyst
Comprehensive Housing Market Analysis Indianapolis-Carmel-Anderson, Indiana
U.S. Department of Housing and Urban Development, Office of Policy Development and ResearchIndianapolis-Carmel-Anderson, Indiana Comprehensive Housing Market Analysis as of October 1, 2019 Rental Market Conditions 17
Rental Market Conditions The composition of renter-occupied units in 2018 was relatively similar to that
of 2010. Single-family homes accounted for 38 percent, multifamily units were
60 percent, and other types, including mobile homes, were the remaining
Market Conditions: Slightly Tight
2 percent of units in both 2010 and 2018. In the middle portion of the decade,
Apartment construction has been concentrated in areas with single-family homes accounted for a larger share of renter-occupied units,
relatively higher rent, including downtown Indianapolis and peaking at 42 percent in 2014. As the home sales market tightened and sales
suburban Hamilton County. prices increased in recent years, homes that had shifted to renter occupancy
because of economic conditions have returned to owner occupancy.
Rental Market Conditions Rental unit construction, as a portion of all homes built, is up in the current
Rental market conditions in the Indianapolis HMA are slightly tight. The overall decade compared with the 2000s. Rental units accounted for 38 percent of all
rental market vacancy rate (including single-family homes, multifamily units, residential units permitted in the HMA since 2010, compared with 19 percent
mobile homes, and apartments) is estimated at 8.5 percent, down from 12.0 during the 2000s.
percent in 2010 (Table 6) when conditions were slightly soft.
Apartment Market Conditions
Table 6. Rental and Apartment Market Quick Facts in the Indianapolis HMA Apartment market conditions are also slightly tight, with strong but steady rent
growth and a declining vacancy rate (Figure 12). The apartment vacancy rate
2010 2018
(%) (%)
Rental Vacancy Rate 12.0 8.5 Figure 12. Apartment Rents and Vacancy Rates in the Indianapolis HMA
Rental Market Occupied Rental Units by Structure Average Monthly Rent Vacancy Rate
Quick Facts Single-Family Attached & Detached 38 38
950 8.0
Multifamily (2–4 Units) 15 14
Average Monthly Rent ($)
Multifamily (5+ Units) 45 46 900 7.0
Vacancy Rate (%)
Other (Including Mobile Homes) 2 2
850 6.0
3Q 2019 YoY Change
(%)
Apartment Vacancy Rate 4.5 -0.6 800 5.0
Apartment Average Apartment Rent $922 5
Market 750 4.0
Studio $717 -4
Quick Facts One-Bedroom $827 4
700 3.0
Two-Bedroom $964 5
5
6
8
9
14
17
1
1
1
1
20
20
20
20
20
20
Three-Bedroom $1,145 5
3Q
3Q
3Q
3Q
3Q
3Q
3Q = third quarter. YoY = year-over-year.
Notes: The current date is October 1, 2019. Percentages may not add to 100 percent due to rounding. 3Q = third quarter.
Sources: 2010 and 2018 American Community Survey, 1-year data; Real Page, Inc. Source: RealPage, Inc.
Comprehensive Housing Market Analysis Indianapolis-Carmel-Anderson, Indiana
U.S. Department of Housing and Urban Development, Office of Policy Development and ResearchIndianapolis-Carmel-Anderson, Indiana Comprehensive Housing Market Analysis as of October 1, 2019 Rental Market Conditions 18
was 4.5 percent during the third quarter of 2019, down from 5.1 percent a year Figure 13. Average Annual Rental Permitting Activity in the Indianapolis HMA
earlier, continuing a period of year-over-year decline since 2015 (RealPage,
Inc.). Among the 13 RealPage, Inc.-defined market areas in the Indianapolis 4,500
HMA, the vacancy rate fell in nine areas, was unchanged in one area, and 4,000
rose in three areas. The largest decline was in the West Indianapolis market 3,500
area, which includes the neighborhoods surrounding the Indianapolis Motor 3,000
Speedway. The vacancy rate fell from 7.0 percent a year ago to 3.6 percent 2,500
during the third quarter of 2019, partially because of a decline in vacancy 2,000
in apartments built before 2000. The largest increase in vacancy was in the 1,500
Anderson market area, which includes most of Madison County. The rate rose 1,000
from 3.0 percent a year ago, to 4.4 percent during the third quarter of 2019, 500
partially because the area is relatively far from growing employment centers 0
in Hamilton and Marion Counties. 06 10 11 12 13 14 15 16 17 19
–20 –20 20 20 20 20 20 20 20 –20
Rent growth during the third quarter of 2019 continued a period of relatively 07 18
00 20 20
strong growth that began during 2016. The average rent in the HMA was $922, 20
up 5 percent from a year earlier, and it rose faster than the nation, which Notes: Includes apartments and units intended for rental occupancy. Data for 2019 are through September 2019.
increased 3 percent during the same period. Among the 13 RealPage, Inc.- Sources: U.S. Census Bureau, Building Permits Survey; 2000 through 2018—final data and estimates by the
defined market areas in the HMA, the average rent increased 6 percent or more analyst; 2019—preliminary data and estimates by the analyst
in three areas, increased 5 percent or less in nine areas, and declined in one
area. West Indianapolis, the area with the largest decline in the vacancy rate, economic conditions improved, rising by an average of 480 units annually from
also had the fastest rent growth—rising 8 percent to $777. Also, experiencing 2010 through 2015 to a high of 4,475 units in 2015. Construction has slowed
above-average rent growth were the Downtown Indianapolis and the Carmel/ since 2016 because a portion of renter households shifted to homeownership,
Hamilton County market areas, each increasing 6 percent from a year ago. reducing demand for new construction apartments which are typically higher
The two areas also have the highest rents at $1,386 and $1,130, respectively, cost rental units. From 2016 through 2018, the number of units permitted fell
partially because of proximity to employment centers and a relatively large by an average of 610 units annually to 2,650 units in 2018. During the most
share of new apartments. recent 12 months, permitting increased to 2,750 units, up from 2,550 units
during the previous 12 months (preliminary data, with adjustments by the
Rental Construction Activity analyst), in response to tightening market conditions.
Rental construction activity, as measured by the number of units permitted,
is higher in the current decade compared with the 2000s, when single-family Construction by Geography
homes and other for-sale housing accounted for a larger share of total housing Apartment construction since 2011 has been concentrated in Marion County
construction. From 2000 through 2006, permitting averaged 2,300 units a year and the southern portion of Hamilton County (Map 6). Nearly one-half of all
before falling to an average of 1,925 units annually from 2007 through 2010 units built during the past 8 years was constructed in Marion County, with
(Figure 13), when economic conditions were weaker. Construction increased as approximately 20 percent of total units in the HMA built in the Downtown
Comprehensive Housing Market Analysis Indianapolis-Carmel-Anderson, Indiana
U.S. Department of Housing and Urban Development, Office of Policy Development and ResearchIndianapolis-Carmel-Anderson, Indiana Comprehensive Housing Market Analysis as of October 1, 2019 Rental Market Conditions 19
Map 6. Completed Developments in the Indianapolis HMA since 2011 Indianapolis area. Job growth in the downtown area and expanding entertainment
Indianapolis HMA districts nearby supported demand for additional rental housing. Hamilton County,
specifically the suburbs in the southern portion of the county, was another area of
concentrated rental development, partially because of proximity to the office parks
on the Marion/Hamilton County border and local investment in suburban business
districts. Construction in Hamilton County has slowed slightly since 2016, while
Madison
construction has increased in Hendricks County, partially in response to strong job
Hamilton
§
¦
¨
65 growth in industries clustered near the Indianapolis International Airport.
Rents at apartments completed earlier in 2019 and currently in lease-up
Boone
are consistent with existing apartment market trends, with the highest rent
properties in downtown Indianapolis, and lower rent properties in Hamilton
§
¦
¨
69 and the other suburban counties. In downtown Indianapolis, the 200-unit
§
¦
¨
65 Penrose on Mass in the Mass Ave entertainment district has studio, one-, and
two-bedroom units that rent for an average of $1,260, $1,675, and $2,620,
Marion Hancock
respectively. In Fishers, a suburb in Hamilton County, the 211-unit Spark
§
¦
¨
74 Apartments is offering one-, two-, and three-bedroom units for rents averaging
§
¦
¨
70 $1,125, $1,675, and $3,000, respectively. In Avon, a suburb in Hendricks County,
the 240-unit Mosaic Apartments is offering one-, two-, and three-bedroom units
for rents averaging $1,075, $1,250, and $1,500, respectively.
Hendricks
§
¦
¨
74
Forecast
§
¦
¨
70
During the 3-year forecast period, demand is expected for an additional 10,900
§
¦
¨
65 Shelby rental units (Table 7), and the 3,800 units under construction are expected to
meet demand during the first year of the forecast period.
Apartment Properties
Morgan Built Since 2011
with 50 or More Units Table 7. Demand for New Rental Units in the Indianapolis HMA
§
¦
¨
65
Urbanized Area During the Forecast Period
Indianapolis HMA Rental Units
Johnson Project Size (units) Demand 10,900 Units
Downtown 50 - 99
Indianapolis Under Construction 3,800 Units
100 - 199
§
¦
¨70
200 or more Note: The forecast period is from the current date (October 1, 2019), to October 1, 2022.
Source: Estimates by the analyst
Source: McGraw-Hill Construction Pipeline database, with adjustments by the analyst
Comprehensive Housing Market Analysis Indianapolis-Carmel-Anderson, Indiana
U.S. Department of Housing and Urban Development, Office of Policy Development and ResearchYou can also read