Renewable Energy Financing Landscape in India - IEEFA's
←
→
Page content transcription
If your browser does not render page correctly, please read the page content below
Ankur Saboo, Project Finance Specialist                                                       1
Shantanu Srivastava, Energy Finance Analyst
February 2022

Renewable Energy Financing
Landscape in India
The Journey So Far and the Need of the Hour
Executive Summary
The Indian renewable energy sector has witnessed unprecedented growth in the
past decade, rivalling capacity additions anywhere in the world. The country has
had the highest growth in renewable energy capacity addition among all global
economies in the past seven or eight years, with capacity (including large hydro)
increasing 1.97 times and solar energy increasing nearly 18 times.1

The growth has been supported by an equally large amount of domestic and global
capital, both in the form of debt and equity, invested in Indian RE infrastructure.
Debt, the main fodder for RE projects, has come through various channels as the
industry matured and as financiers from all quarters gained a better understanding
of its risk return dynamics.

Private Non-Banking Financial Companies (NBFCs) were the first entities to test the
waters by lending to renewable projects, when capital from other conventional
sources such as banks, private or public, found it best to avoid exposure to a nascent
and evolving technology. In addition, the long duration and large debt size typical of
RE projects limited banking support, as did the banks’ over-exposure to the greater
power sector.

Figure 1: Key Players in RE Debt Financing in India

Source: IEEFA analysis.

1NewsOnAIR. India witnesses fastest rate of growth in Renewable Energy Capacity in last 7.5
years. December 2021.
Renewable Energy Financing Landscape in India                                          2

Financing has transformed significantly since then, with the entry of varied sources
of funding such as banks, bond market (domestic and global), international lenders
and development finance institutions (DFIs) vying for a piece of the growing RE
sector. Private NBFCs, the flag bearers at the start of the journey, have been
overshadowed by larger banks, primarily the State Bank of India (SBI), then HDFC
Bank, Axis Bank and, more recently, ICICI Bank – completely changing the
renewable energy competition landscape.

Domestic bonds entered the market soon after the banknote demonetisation
undertaken by the Government of India in 2016,2 helping RE companies by
providing lower rates, increasing lender competition, adding a new avenue for
funding operating projects and helping companies reduce exposures with certain
lenders where exposure norms were hit.

The biggest boon for the sector has been access to global bond markets for the
incumbent players. The international bond market has demonstrated immense
depth, proactiveness and boldness towards the sector, thanks to global
understanding of the sector, high yield offerings and buoyed by the initial success
and pedigree of large players.

After a wait-and-watch approach for most of the past decade, even foreign banks
(led by the likes of Standard Chartered Bank) have also started taking substantial
exposure in renewable energy projects.

With increasing complexity and project sizes, the meaningful presence of these
different players bodes well for continued growth of the sector. For a capital-
intensive area, a highly competitive funding landscape is arguably the biggest
growth driver.

On the equity side, by virtue of the social,
environmental and economic impact,
renewables have – since the very
beginning – evinced interest from
multiple long-term investors. Deep
investments have come from sovereign                Renewables have evinced
entities such as ENEL, CDPQ and Canada               interest from multiple
Pension Plan Investment Board (CPPIB).
Global private equity players Goldman                  long-term investors
Sachs, KKR and Global Infrastructure                  since the beginning.
Partners (GIP) joined in, as did oil and
gas majors Total SE, Shell and Petronas
and national conglomerate majors like
Adani, Tatas and most recently Reliance
Industries.3

India’s ambitious RE targets clearly suggest an upward trajectory in renewable

2   RBI. Press release. November 2016.
3   IEEFA. Capital Flows Underpinning India’s Energy Transformation. February 2021.
Renewable Energy Financing Landscape in India                                          3

energy. Momentum is accelerating, as is global investor interest, so the
opportunities are huge for India, if planned successfully.

Critical factors for sustained financing solutions for the sector include continuous
learning of the evolving renewable market by lenders, tapping the capital base of
environment focused investors, building a dedicated infrastructure finance bank in
India and careful evaluation and financial structuring of the technological shift
towards Indian modules and inverters.

For lenders, there are still untapped opportunities in green field projects, hybrid,
storage and round the clock bids, and household plus commercial and industrial
(C&I) rooftop projects.

All these and more such opportunities will lead to more innovation, more
aggression and more opportunities for all stakeholders in the sector.
Renewable Energy Financing Landscape in India                                                                                                          4

 Table of Contents
 Executive Summary .............................................................................................................................. 1
 Renewable Financing Solutions – A Retrospective View ...................................................... 5
 Domestic Debt Funding ....................................................................................................................... 9
 International Debt Funding ............................................................................................................ 11
 A Glimpse Into the Investor Base – The Equity Story .......................................................... 13
 Renewable Sector – Future Growth Potential ........................................................................ 13
 Gaps and Opportunities in the Market ....................................................................................... 16
 About the Authors .............................................................................................................................. 18

 Table of Figures
 Figure 1: Key Players in RE Debt Financing in India ............................................................... 1
 Figure 2: India Wind versus Solar Capacity (in GW)............................................................... 5
 Figure 3: Record Low Solar Auction Tariffs in India (Rs/kWh) ......................................... 6
 Figure 4: Change in Solar Module Prices...................................................................................... 7
 Figure 5: Banking Sector Gross Non-Performing Asset (NPA) Trends ........................... 8
 Figure 6: Banking Sector’s Power Sector Exposure (March 2017) ................................... 9
 Figure 7: Key Players in Renewable Energy Debt Financing in India .............................. 9
 Figure 8: Major Lenders for Indian RE Companies ............................................................... 13
 Figure 9: Interest Rate Trajectory of Developed World versus India ........................... 14
 Figure 10: Energy Storage Systems Pick Up Pace in India................................................. 15
 Figure 11: ESG Global Projected AUM by Country (In US$ tn)......................................... 15
 Figure 12: Utility Scale Solar Pipeline Capacity (in GW) .................................................... 16
 Figure 13: Tata Power Solar Rooftop Revenues (Rs mn) ................................................... 17
Renewable Energy Financing Landscape in India                                                 5

Renewable Financing Solutions – A Retrospective
View
The growth of renewable energy in India, in particular the solar sector, is possibly
one of the most inspiring stories of the past decade. It is one of the few sectors
where performance and delivery have surpassed budgets or estimates– which were
extremely ambitious to begin with. In January 2010, the National Solar Mission
(NSM) was launched with an initial target of 20 gigawatts (GW) of installed solar
power by 2022 but the revised target, having been surpassed twice, now stands at
100GW of solar PV to be installed this year.4

In the first half of the previous decade, renewable power additions in India were
dominated by wind power. In the Feed in Tariff (FiT) regime, and with abundant
high wind sites, India witnessed sharp capacity additions in the sector.

Figure 2: India Wind versus Solar Capacity (in GW)

Source: JMK Research, IEEFA analysis.

Wind, however, will come a distant second to solar power in India owing to inherent
weaknesses, such as resource availability, seasonal variability in generation and
financial health of most original equipment manufacturers (OEMs). The core
strength of solar assets – ease of construction and design, steady generation and
scalability and relatively simple technology – are not shared by wind projects and
on this basis solar has surpassed wind energy growth in the past couple of years.
Growth in the wind sector in the second wave of renewable growth will be largely in
the hybrid model, in which batteries complement and balance solar outputs.

India meaningfully started its solar journey with a 250 megawatt (MW) solar park in
Gujarat – Charanka, inaugurated in 2012.5 With base tariff of Rs15/kWh for solar

4   IEA. Jawaharlal Nehru National Solar Mission (Phase I, II and III). August 2021.
5   The Economic Times. India's first solar park at Charanka village in Gujarat. June 2013.
Renewable Energy Financing Landscape in India                                                   6

power for the first 12 years, it seemed a costly and hardly scalable experiment; the
only silver lining being that the future tariff was determined at Rs5/kWh– a healthy
figure at that time.6 Today, more than 48GW later, we have witnessed the most
aggressive bids at less than Rs2/kWh – Rs1.99/kWh (~US$0.03/kWh) to be precise
– then an unthinkable number.

Figure 3: Record Low Solar Auction Tariffs in India (Rs/kWh)

Source: Bloomberg NEF - India’s Mega PV Auction Amid Lockdown Shows Investor Faith, Mercom-
New Solar Tariff Record of Rs2/kWh, Towards a renewable energy boom in India!-TERI

Single bids often happen at mega scale nowadays, with Solar Energy Corporation of
India Limited (SECI) and NTPC coming up with multiple 2,000 MW bids at a time.
Innovative and more grid friendly bids such as Round the Clock (RTC), peak power
bids, hybrid bids and energy storage bids are gaining momentum. For a world
seeking greener power solutions and sustainable development, these are welcome
sights.

That brings us to solar financing in India, which unsurprisingly has followed a
similar narrative. When the Charanka solar project was first evaluated, the
developer faced the Herculean task of finding lenders to provide non-recourse
financing. Reluctant lenders cited all sorts of risks as the journey was in relatively
unknown territory.

Concerns ranged from technology (evolving and relatively unproven at that time) to
political, foreign exchange (as majority of project equipment was and still is
imported) to role and responsibility (managing displacement of people and people
related issues is never easy in populous democratic countries). Other doubts were
about promoters (the vast majority of projects were being executed by first-time
promoters or those with limited or no solar experience) and interest rate risks – in
2012, the Indian Renewable Energy Development Agency Limited (IREDA), the
specialist lender in renewable energy space, was charging in the range of 12.5% to
13.5% for majority of private lenders. The same stands today at 9.45%-9.7% on the
upper side, with the lowest rate at ~8%.7

Access to debt capital is one of the most important factors for the success of a
renewable energy project. Solar projects had earlier started at a cost of

6   ADB. CDM Assessment Report for the Charanka Solar Park, Gujarat, India.
7   IREDA. Interest Rate Matrix. December 2021, CERC. Statement of Objects and Reasons. 2012.
Renewable Energy Financing Landscape in India                                             7

~Rs180m/MW (US$4m/MW).8 The Charanka Solar Park, with 250MW capacity,
would have cost close to Rs45bn (US$1bn) and would have entailed debt over
Rs30bn (US$0.7bn) – a big ask at that time. Now with 100GW renewable capacity in
operation, solar is immensely attractive from a scale point of view for lenders,
particularly as it is supported by very long dated centre government power
purchase agreements (PPA). Add the opportunity to refinance an equally high
amount of debt and the sector seems poised for innovation and explosive growth.

The sector has added advantages of (mostly) positive global and government
support, ease of installation (simpler technology and significantly shorter
construction period), land availability (the sector largely makes use of barren,
uncultivable land – adding value for all stakeholders) and replicability. Owing to the
socio-economic impact, the world’s biggest investors vie for a stake in the sector,
among them multiple sovereign funds and global pension funds.9

Surprisingly though, the sector’s initial growth has been punctuated by limited
banking support, making the growth story a unique one, from finance point of view.

Reasons for Muted Participation of Banks
(i) Technology Evolution – In the initial years, solar technology was fairly costly and
evolving, with efficiencies improving year on year. It was difficult for traditional
banks to lock on to a particular asset, not knowing how the existing technology
would fare commercially and technically over time.

Figure 4: Change in Solar Module Prices

Source: Wood Mackenzie.

(ii) Tenors – In the early days, almost none of the traditional Indian banks were
accustomed to long term financing. A 10-year loan was considered long-term and

8The Economic Times. India becomes lowest-cost producer of solar power. May 2019.
9IEEFA. Global capital mobilizing for India’s $500bn renewable energy infrastructure
opportunity. February 2021.
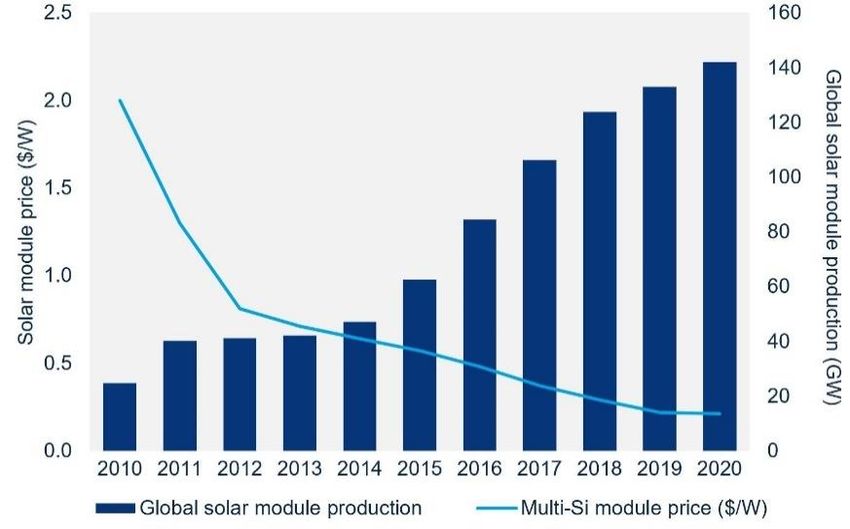
Renewable Energy Financing Landscape in India                                                   8

longer tenors were barely provided. The viability of renewable projects comes at
20-year tenors for debt, more aligned to match the revenues of 25-year PPAs. Asset
Liability Management (ALM) issues further limited banks’ ability to move
aggressively.

(iii) “High” Per MW Project Cost – Thermal projects were being implemented at
Rs50m/MW10 and offered 85-90% plant load factor (PLFs – fallacious as this has
proved in hindsight, with the thermal fleet averaging PLFs of 55-60% over the past
four to five years). For solar projects, a cost of Rs150-180m/MW (US$3.4-4m/MW)
with a PLF under 20% was not attractive for banks to consider.

(iv) Recourse vs Non-Recourse – As most of the promoters were new, banks wanted
recourse financing for the projects. Given the high project debt, providing recourse
was a difficult task for even the country’s largest players.

(v) “Sector” Issues – A lot of banks were grappling with the initial signs of stress in
the thermal power sector – and as renewable energy was not considered (and is still
not considered) a separate sector, the exposure issues of many banks came as a
clear hindrance for them to take exposure to solar.

Figure 5: Banking Sector Gross Non-Performing Asset (NPA) Trends
Gross NPA ratio (%)

Source: E&Y - Stressed assets in Power Sector - Clear and Present Danger.

10CERC. Benchmark Capital Cost (Hard cost) for Thermal Power Stations with Coal as Fuel. June
2012.
Renewable Energy Financing Landscape in India                                                          9

Figure 6: Banking Sector’s Power Sector Exposure (March 2017)
                                                                                      Gross Non-
                                                               Gross Non-
                       Gross Loans        Gross Loans                              Performing Assets
                                                            Performing Assets
      Items           and Advances       and Advances                              (GNPAs) at End of
                                                            (GNPAs) at End of
                      (in Rs crores)    (in US$ million)                             Period (in US$
                                                           Period (in Rs crores)
                                                                                        million)
 Electricity
                          471,334            72,748               31,194                4,815
 (Generation)
 Electricity
                          25,358             3,914                2,102                  324
 (Transmission)
 Electricity
                          51,386             7,931                1,008                  156
 (Distribution)
 Total                    548,078            84,593               34,304                5,295
                            th
Source: Ministry of Power 37 report of the Standing Committee on Energy.

(vi) Size – In the first stage of development, developers often won 10MW-20MW
projects at a time, with debt in the range of Rs0.5-1bn and the largest Rs2bn. Banks
chasing scale went for larger projects of Rs10bn-plus and the sector went under
their radar.

Figure 7: Key Players in Renewable Energy Debt Financing in India

Source: IEEFA analysis.

Domestic Debt Funding
Arguably, the biggest contributors to renewable energy financing for the first five
years were private non-banking financial companies (NBFCs), followed by public
sector undertaking (PSU) NBFCs. The likes of L&T Infra Finance, Infrastructure
Development Finance Company (IDFC), Aditya Birla Capital and Tata Cleantech
were among early movers into the sector and came out with the first framework for
financing renewable projects.

The private NBFCs made full use of the abstention of the banks and dominated the
sector in its initial years of growth. They were quick to spot the inherent strengths
Renewable Energy Financing Landscape in India 10
of solar/wind projects with lower construction risk, shorter construction period,
simpler design and no dependence on external fuel. Public NBFCs were not too far
behind – entities such as IREDA were focused on renewable power from the very
beginning. The likes of Power Finance Corporation (PFC) and Rural Electrification
Corporation (REC) entered with big cheques much later but provided the required
impetus as the developers felt the need to diversify lenders.
Among private banks, Indusind Bank and Yes Bank were among the few to take
large calls at various times. Yes Bank was the strategic and financial advisor to
Greenko Energies for acquiring SunEdison’s solar portfolio in India. The bank also
issued India’s first Green Infrastructure Bonds in 2015 for Rs10bn11 but
organisational difficulties resulted in a “stop-start” relationship with the sector. The
larger public and private banks worked with a select set of large corporates and old
business houses – Tata Power, Mahindra Solar, Hero Group, CESC and Emami –
often on a relationship basis rather than following a focused approach. The growth
in their renewable exposure was attributed to one-off large deals rather than a
systematic approach. In terms of depth and coverage of the space, the private NBFCs
and public NBFCs were far ahead till 2018-19.
NBFCs continued to innovate. Following
encouragement from the Reserve Bank of
India (RBI), Infrastructure Debt Funds
(IDF) appeared as a new category of Infrastructure Debt Funds,
NBFCs, to thrive in the burgeoning
renewable debt market. The tax efficiency
as tax-exempt entities,
built in by the government – the IDF bill could pass on rate
made it a tax-exempt entity – meant the benefits to borrowers.
funds were able to pass on rate benefits to
borrowers and allowed them to compete
with banks.12
Domestic bonds entered the market soon after the banknote demonetisation
undertaken by the Government of India in 2016.13 Now flush with unprecedented
funds, the Indian Mutual Funds forayed into high rated renewable bonds, helping RE
companies by providing lower rates, increasing lender competition and opening a
new avenue for funding operating projects. This also helped companies reduce
exposures with certain lenders where exposure norms were hit. Some of the largest
bond issuances include those by ReNew Power Limited at the holding company level
as well as for its subsidiaries in co-obligor structure. Additionally, there were credit
enhanced bonds with IIFCL as the credit enhancing agency for bonds of ReNew
Group. Other large bond issuers were GIC-backed Greenko and Sembcorp Group.
Then the flow came to a standstill, hit by the IL&FS14 and DHFL15 debacles when the
two NBFCs delayed and defaulted on their debt repayments to their lenders, and
11 Yes Bank. Yes Bank annual report FY2017.
12 Infradebt.in. Press Release - Infrastructure Debt Fund.
13 RBI. Press release. November 2016.
14 Business Standard. What is IL&FS Crisis.
15 Moneycontrol. DHFL crisis: A look at the story so far. June 2019.Renewable Energy Financing Landscape in India 11 later by the Franklin Templeton Fiasco, where six debt schemes of the mutual fund were frozen amid unprecedented redemptions when the COVID-19 crisis hit India.16 In the past two years, larger banks have returned life to the landscape. After a lag of seven to eight years, the State Bank of India (SBI), followed by HDFC Bank, Axis Bank and more recently ICICI Bank, have completely changed renewable energy competition. HDFC more than doubled its RE financing book in FY2020/21 from the previous year to Rs85.6bn (US$1.1bn), further swelling to Rs108.7bn (US$1.5bn) in FY2021/22.17 SBI still leads – the cumulative amount deployed in RE was upwards of Rs330bn (US$4.4bn) as of September 2021.18 Large private banks such as Axis Bank and to a lesser extent ICICI Bank (which focuses on operational projects) have largely avoided the stressed thermal power sector and done some marquee renewable energy deals. SBI has also rejigged its credit matrix to allow for more competitive funding of further renewable projects. The interest rates as a result are at an all-time low, preference is given to the sector and the coverage has improved substantially. The biggest thing that large banks bring to the table is price competitiveness, so much so that some larger NBFCs have had up to 50% book shrinkage in renewable assets over the past 12-18 months – the assets changing hands from NBFCs to banks soon after commissioning. Sustained banking interest is critical in providing competitive debt financing to boost innovation and enable growth, in turn lowering the cost of renewable power to benefit Indian consumers. International Debt Funding International banks have followed a cautious approach to investing in RE – weighing up risks, political motivation and finally the evolution of the sector over the past decade, following the sustained increase in equity investments by global pension funds. Today, large banks such as Standard Chartered Bank (SCB) and Rabo Bank have large exposures. SCB was one of the largest lenders in 2021 – among its underwritings was nearly a billion dollars for the Adani Group.19 Societe Generale and others have expanded their customer base, to be joined in time by other global majors. The story of international bond market has been starkly different. Proactive and bold, with a global understanding of renewables, bond buyers moved in early attracted by high yield offerings and buoyed by the initial success and pedigree of large players. They took large calls as early as 201420 and continued the momentum with multiple large issuances. Almost all the global and domestic big names have 16 Mint. Lessons at the Crux of Franklin Templeton Fiasco. February 2021. 17 HDFC Bank. HDFC Bank annual report FY2021. 18 SBI. SBI Analyst presentation Q2 2021. 19 Adani Green Energy Limited. Adani Green Energy Raises USD 1.35 Billion In One Of Asia’s Largest Project Financing Deals. 20 Climate Bonds Initiative. Indian clean energy player Greenko issues $550m, 5 year, high-yield (B) corporate bond. August 2014.
Renewable Energy Financing Landscape in India                                             12

explored the international bond market –
led by Government of Singapore
Investment Corporation (GIC) and Abu
Dhabi Investment Authority (ADIA)
backing Greenko, Goldman Sachs-backed          Proactive and bold, with
ReNew and International Finance
Corporation (IFC) & Caisse de dépôt et         a global understanding of
placement du Québec (CDPQ) backed              renewables, bond buyers
Azure. All of these have had multiple,              moved in early.
large international bond issuances and
even refinances. Among others are Adani,
Hero Futures and Morgan Stanley-
backed Continuum.21

The international bonds have followed a broader matrix, structuring the deals
attractively for the issuer while also protecting the investors through investment
and near investment ratings. Such has been the reliability and influence of the
positive structuring of the bond markets that, despite being instruments only for
commissioned projects, they are built into developers’ financial models at the bid
stage. The international bonds seem to be path breakers for renewable financing,
and their innovation and direction seem to be the most exciting aspects of
renewable financing.

The last significant players in the international space are the development financial
institutions (DFIs) such as Asian Development Bank (ADB), Asian Infrastructure
Investment Bank (AIIB), IFC and their consortiums. In terms of structure, they are
the only set of lenders that provide a 20 year-plus structure for renewable energy
projects with negligible interest rate fluctuation risks – providing what can really be
termed long-term money.

For pure-play “build and hold” infrastructure projects, these lenders provide the
ideal financing package. If these DFIs were to start focusing on long term refinance
of operational projects, as with domestic lenders, it could be a real game changer –
helping to build bond-friendly structures for long-term as well as attracting interest
from previously elusive provident and insurance funds.

21   Refinitiv. Bonds Guide. December 2021.
Renewable Energy Financing Landscape in India                                          13

Figure 8: Major Lenders for Indian RE Companies

Source: IEEFA analysis.

A Glimpse Into the Investor Base – The Equity Story
Simplistically speaking, the equity story of renewable energy has witnessed deeper
and more mature interest. By the virtue of its social, environmental and economic
impact, from the beginning RE has attracted interest from multiple long-term
investors. Plainly, renewable projects are best handled by patient investors.

On the list of sovereign entities are ENEL, CDPQ and Canada Pension Plan
Investment Board (CPPIB), the largest global pension fund, as are GIC, Temasek, IFC,
CDC, National Investment and Infrastructure Fund (NIIF) and, more recently,
Norfund. Major investment has come from almost all the global PE players, among
them Goldman Sachs, KKR, Global Infrastructure Partners (GIP), Actis, Morgan
Stanley, ADIA and JP Morgan. A third set of investors (some of them more recent)
includes oil and gas majors such as Total SE, Shell, Petronas and Malaysian and Thai
fossil-fuel companies for which renewables provide a sustainable hedging solution
as the world tries to go greener. Further investment has come from the national
conglomerate majors like Adani, Tata and most recently Reliance Industries.22 Such
variety and depth of investors bode well and already have driven aggressive growth.

The Nasdaq listing of ReNew Power was followed by the first power sector
infrastructure investment trust (InvIT), Indigrid, backed by KKR, then another KKR-
backed RE focussed InvIT, Virescent. These open up immense opportunities for
infrastructure investments – providing the strongest pillar as we move towards the
500GW goal for renewables.

Renewable Sector – Future Growth Potential
India’s renewable energy potential stands at more than 1 terawatt (TW), led by
solar (nearly 749GW), then wind (302GW at 100m hub heights), bioenergy (25GW)
and small hydro (21GW).23 This effectively means that once the hybrid, peak power,

22   IEEFA. Capital Flows Underpinning India’s Energy Transformation. February 2021.
23   Care Ratings. Knowledge Paper - Roads & Renewables.
Renewable Energy Financing Landscape in India 14
battery and other storage technologies evolve at utility scale, almost all of India’s
energy demand growth has the potential to be met by domestic, zero-emissions
renewable power sources.
India, having set ambitious RE targets for 2030, took a step further at the Glasgow
summit and mandated net-zero emissions by 2070. Renewable energy will bring
ongoing deflationary gains and the massive strategic opportunity to curtail India’s
dependence on fossil fuel imports.
Figure 9: Interest Rate Trajectory of Developed World versus India
10% 7.9% 14% 13%
8% 12%
6% 10%
4% 7.3% 8% 6%
1.4%
2% 6%
0% 4%
-0.1%
-2% 2%
2018
2020
1992
1993
1995
1997
1999
2001
2003
2005
2007
2009
2011
2013
2015
2016
0%
1998
1999
2001
2002
2004
2005
2007
2008
2010
2011
2013
2014
2016
2017
2019
2020
US 10 Year Benchmark Yield
Euro 10 Year Benchmark Yield Indian 10 Year Benchmark Yield
Source: Refinitiv, IEEFA analysis.
Further, for most developed world economies, interest rates have been on a
downward trajectory over the past 15-20 years. If India were to become a
developed economy, then benchmark interest rates should follow a similar course.
This in turn would lead to higher internal rate of return (IRR) for debt fuelled RE
infrastructure projects and make these more attractive from lenders’ point of view.
Putting things to perspective, near zero to 100GW renewable capacity in 10 years is
an exceptional journey so far. The challenge will be to maintain focus on the path
from 100GW to 500GW and meet its demand for both greater detail in planning and
much greater national cohesion. Momentum is accelerating, as is global investor
interest, so the opportunities are huge for India.
Critical Factors for Sustained Financing Solutions
Continuous research of the evolving renewable market – covering storage,
peak power, hybrid, battery and thermal/hydro combinations and
structuring green solutions. With multiple tenders floated by entities such as
SECI in hybrid24 and BESS technologies,25 there are opportunities galore for
lenders to study and exploit the risk-return dynamics.
24 Mercom. SECI to Tender 1.2GW of ISTS-Connected Solar Wind Hybrid Projects. April 2021.
25 EQ International. SECI invites EoI for 1GWh Battery Energy Storage System. October 2021.Renewable Energy Financing Landscape in India 15
Figure 10: Energy Storage Systems Pick Up Pace in India
SECI tender for 2,000 MWh standalone energy storage systems, the largest in
India
NTPC EoI for 1,000 MWh of grid-connected BESS on the premises of its power
projects
Rs181bn (~US$2.5bn) allocated under production-linked incentive (PLI) program
to set up battery manufacturing capacity
NREL finds Jammu and Kashmir, Gujarat, and Karnataka having more than 10GW
of battery storage capacity by 2030
Source: Mercom, IEEFA analysis.
Tapping capital base of environment focused investors, domestic and
international, to bring cost competitiveness to renewable financing by
adoption of global environmental, social and governance (ESG) frameworks
and principles. Sustainable finance bonds totalled a record US$552bn in the
first half of 2021 and sustainable lending totalled US$321bn in the same
period, more than tripling year-on-year.26 Bloomberg estimates ESG assets
may hit US$53 trillion by 2025, a third of global assets under management
(AUM).27 HSBC and SCB have a clear roadmap to stop exposure to carbon
emitting projects – HSBC in December 2021 released its new roadmap to
exit coal based and high emission projects.28
Figure 11: ESG Global Projected AUM by Country (In US$ tn)
Source: Bloomberg.
Building a dedicated infrastructure finance bank – or the National Bank for
Financing Infrastructure and Development (NBFID)29 as announced in the
26 Refinitiv. The Green Bond Guide. October 2021.
27 Bloomberg. ESG assets may hit $53 trillion by 2025, a third of global AUM. February 2021.
28 The Economic Times. HSBC says clients must have plan to exit coal by end-2023. December
2021.
29 Mint. Govt tables National Bank for Financing Infrastructure and Development Bill. March
2021.Renewable Energy Financing Landscape in India 16
budget 2021 by the finance minister. The bank could be a thought and
product leader, aiding and leading policy advocacy, deal structuring and
setting groundwork for sustained growth (including but not limited to credit
enhancements, guarantees, removing finance bottlenecks etc).
As the shift towards Indian modules and inverters takes place, it is
important to have technical upgrades via specialised lenders’ independent
engineers (LIE), SCADA-integrated automatic monitoring, bi-facial modules,
dual axis tracking and studies to carefully evaluate and financially structure
the technological shift to avoid systemic risks arising out of these changes.
Gaps and Opportunities in the Market
There are still clear gaps in cost-effective RE financing that lenders have yet to tap.
First, in the rush to acquire the debt of de-risked operational projects, greenfield
projects still receive limited interest as the majority of newer investors take a
cautious approach. Funding for most of the time-bound renewable energy projects
under development is still from relatively costlier lenders. The gap is even wider for
“non-central government” projects, i.e., state projects and third-party offtake
projects for which private banks adopt a very cautious approach.
Figure 12: Utility Scale Solar Pipeline Capacity (in GW)
1.8 Discoms
2
13.5
C&I
SECI Offtake
8.2
30.3 NTPC Offtake
Other PSUs Offtake
Source: Bridge to India.
Further, the project size and debt amounts are going to grow substantially as hybrid,
storage and round-the-clock bids increase. In SECI’s recently concluded auction for
100MW solar with 40MW battery energy storage system (BESS), the net project cost
was ~Rs92m/MW compared to Rs25-30m/MW for solar projects.30 The debt for
ReNew Power’s RTC project of 1.3GW is pegged at nearly US$1bn.31 Such projects
should ideally be funded by the country’s largest lenders but most private and large
banks are reluctant to make the first move for newer technologies and structures.
30 Mercom. SECI Seeks ₹4 Billion Term Loan to Finance its Floating Solar and Energy Storage
Projects. November 2021.
31 Business Standard. ReNew Power to invest $1.2 bn for country's 1st round-the-clock RE
project. August 2021.Renewable Energy Financing Landscape in India 17 Time is ripe for like-minded banks and FIs to join consortiums to fund these projects competitively. In parallel, with increased awareness, the “retailization” of solar projects is gaining pace. India has an ambitious (but till-now well behind schedule) target of achieving 40GW of green energy from rooftop solar by 2022. The country is already among the most cost-effective in generating rooftop solar energy.32 Household plus commercial and industrial (C&I) rooftop projects, as these also accelerate, will bring opportunities for large fintech companies to thrive. Figure 13: Tata Power Solar Rooftop Revenues (Rs mn) Source: Tata Power analyst presentation Q2 2022. All such opportunities will lead to more innovation, more aggression and more opportunities for all stakeholders. In 2010, renewables were considered a sunrise sector. In 2021, it is clear the sun – literally – will shine on this massive growth area for a long time ahead, building India’s energy security while driving both system deflation and decarbonisation. What’s not to like about that?! 32 Mint. India most cost effective globally in rooftop solar power: report. October 2021.
Renewable Energy Financing Landscape in India                                            18

       About IEEFA
       The Institute for Energy Economics and Financial Analysis (IEEFA) examines
       issues related to energy markets, trends and policies. The Institute’s mission
       is to accelerate the transition to a diverse, sustainable and profitable energy
       economy. www.ieefa.org

       About the Authors
       Ankur Saboo
       Ankur Saboo is an infrastructure finance specialist. After working at a
       leading infrastructure finance NBFC – L&T Infra – for nearly 12 years in
       various leadership roles, he joined as head, project finance and fund raise at
       Vector Green Energy Pvt Ltd, a wholly owned subsidiary of Global
       Infrastructure Partners. Ankur has worked across geographies in India,
       handling almost all infra sub-sectors, and is deeply entrenched in the
       renewable energy and road sectors in particular. He is an XLRI Alumnus and
       a mechanical engineer from BIT Mesra

       Shantanu Srivastava, CFA
       IEEFA India energy finance analyst Shantanu Srivastava has experience in
       corporate finance and strategy consulting, working with North American
       and Middle East clients. He has previously worked on transaction advisory,
       business valuation and strategy consulting projects. A CFA charter holder, he
       has an MBA in finance from IMT and an engineering degree from NMIMS
       University, Mumbai.
You can also read