Region 9 Healthcare Hazard Vulnerability Assessment - February 2018
←
→
Page content transcription
If your browser does not render page correctly, please read the page content below
Region 9 Healthcare Hazard Vulnerability Assessment
February 2018
The mission of the Washington State Region 9 Healthcare Coalition is to prepare for, respond
  to, and recover from crisis using all available resources, providing patient care at the
  appropriate level and in the most efficient manner.

  The Region 9 Healthcare Coalition (R9 HCC) strives to build emergency preparedness and
  response planning across the healthcare system to create resilient communities within the ten
  counties and three tribes of eastern Washington. The R9 HCC collaborates with healthcare
  partners on various projects and topics for regional healthcare system preparedness with the
  goal to provide quality patient care during medical surge events. The activities of the R9 HCC
  are funded under the United States Department of Health and Human Services through the
  Office of the Assistant Secretary for Preparedness & Response (ASPR) Healthcare Preparedness
  Program grant and administered through a cooperative agreement between the Washington
  State Department of Health (DOH) and the Spokane Regional Health District (SRHD).

ACKNOWLEDGEMENTS
This document was prepared by Region 9 Healthcare Coalition staff:

   •   Maren Murphy, Eastern Washington Healthcare Response Planning Coordinator
   •   Travis Nichols, Region 9 Healthcare Coalition Coordinator
   •   Tiffany Turner, Program Manager Public Health & Health Care Preparedness & Response
       Programs

Special acknowledgment goes to R9 HCC and Eastern Washington Healthcare Response and
Preparedness staff, members and partners for their participation, input, and feedback throughout the
process.

                                    Region 9 Healthcare Coalition
                             509.324.1673 | hcc@srhd.org | srhd.org/hcc

                                                                                                       i
TABLE OF CONTENTS

INTRODUCTION ............................................................................................................................................. 1
   Purpose ..................................................................................................................................................... 1
   Scope ......................................................................................................................................................... 1
   Planning Assumptions ............................................................................................................................... 1
REGIONAL HEALTHCARE HAZARDS ………………………………………………………………………………………………………….3
HAZARDS REVIEW ......................................................................................................................................... 4
METHODOLOGY & RESULTS .......................................................................................................................... 6
   Process Overview ...................................................................................................................................... 6
   Survey Results ........................................................................................................................................... 9
   Final Analysis ........................................................................................................................................... 10
REGION 9 COMMUNITY VULNERABILITY PROFILE ...................................................................................... 11
   Geography............................................................................................................................................... 11
   Disaster Declarations .............................................................................................................................. 11
   Population Characteristics ...................................................................................................................... 13
   Region 9 Social Vulnerability................................................................................................................... 14
CONCLUSION............................................................................................................................................... 16
APPENDIX .................................................................................................................................................... 17
   A.      References ...................................................................................................................................... 18
   B.      Round One Survey........................................................................................................................... 18
   C.      Round Two Survey .......................................................................................................................... 18
   D.      Community Hazard Vulnerability Assessment Tool ........................................................................ 19

                                                                                                                                                                  ii
Region 9 Healthcare Hazard Vulnerability Assessment
INTRODUCTION
Purpose
The Office of the Assistant Secretary for Preparedness & Response (ASPR) defines a hazard vulnerability
assessment (HVA) as a systematic approach to identifying hazards or risks that are most likely to have an
impact on the demand for healthcare services or the healthcare delivery system’s ability to provide
these services. A regional healthcare HVA is required in the 2017-2022 Healthcare Preparedness and
Response Capabilities. 1
This regional healthcare HVA is prepared for the Region 9 Healthcare Coalition to evaluate vulnerability
to specific hazards and address anticipated and unanticipated risks. The assessment focuses on the input
of healthcare partners as the primary stakeholder through an all hazards approach that includes
naturally-occurring events, human-related events, hazardous materials events, and technologic and
utility events. The analysis is based on the likelihood of the incident and the significance of the hazard.
The assessment focuses on the input of healthcare partners as the core group to provide a regional
healthcare outlook on hazards.
The outcome of this project is the Region 9 Healthcare Hazard Vulnerability Assessment that serves as a
baseline for future organizational and jurisdictional HVAs in planning, training, mitigation, response, and
recovery activities.
Scope
The R9 HCC consists of ten counties and three tribal areas. This HVA is based on a review of hazards
across the region that have historically occurred or have the potential to occur. The assessment
incorporates a review of existing county-based planning documents as well as internet research on
regional hazards. The review takes an all hazards approach that consists of 39 hazards that span
naturally-occurring events, human-related events, hazardous materials events, technologic events, and
utility events. It is recognized that there are incidents that can occur elsewhere in the State that might
impact the Region. This report is primarily focused on those hazards that could occur and will directly
impact the counties and tribes within Region 9.
Planning Assumptions
• While there is likely significant overlap between the HVA for the R9 HCC and the HVA for an
individual healthcare organization or jurisdiction, these are separate and distinct processes.2
• A specific vulnerability may not exist across all Coalition member organizations; however,
Coalition members will generally face many of the same hazards.
1 Office of the Assistant Secretary for Preparedness and Response (ASPR). 2017-2022 Health Care Preparedness and Response
Capabilities. Capability 1: Foundation for Health Care and Medical Readiness, Objective 2: Identify Risk and Needs, Activity 1:
Assess Hazard Vulnerabilities and Risks. November 2016. Accessed 25 Sept 2017.
https://www.phe.gov/Preparedness/planning/hpp/reports/Documents/2017-2022-healthcare-pr-capablities.pdf
2 U.S. Department of Health and Human Services. MSCC: The Healthcare Coalition in Emergency Response and Recovery.
Chapter 5, Section 5.4: Hazards Vulnerability Analysis. May 2009. Accessed 21 December 2017.
https://www.phe.gov/Preparedness/planning/mscc/healthcarecoalition/chapter5/Pages/hazards.aspx
February 2018 1Region 9 Healthcare Hazard Vulnerability Assessment
• The regional HVA is not a replacement for an organization- or facility-specific HVA, nor for a
comprehensive cross-disciplinary emergency support function regional threat/risk assessment
and vulnerability analysis.
• The analysis is based upon responses received by participants, and is not a comprehensive
assessment of all partners. Survey respondents, while invited to complete the surveys via email,
were self-selected based on interest. The data provided by these participants is influenced by
their own organizational experience and planning efforts.
• The assessment of hazards across the region are based on a combination of quantitative data
(such as the occurrence of naturally-occurring events) and qualitative estimations (such as Low-
Medium-High consequence scales).
• This assessment does not provide details regarding the unique attributes and risks for individual
counties. Threats and vulnerabilities in this assessment may appear to be more homogenous
throughout the region than they are at the local level.
• This HVA process incorporates state and local emergency management organization
assessments and other public health hazard assessments, though the primary focus of this
assessment is impact to healthcare.
February 2018 2Region 9 Healthcare Hazard Vulnerability Assessment
Regional Healthcare Hazards
February 2018
Rank Hazard Response* Occurrence Impact
1 Mass Casualty (Trauma) High Low High
2 Pandemic Influenza Moderate Low High
3 Highly/Acute Infectious Disease Outbreak Moderate Low High
4 Wildfire High High Moderate
5 Severe Blizzard/Snow Fall Moderate High High
6 Mass Electrical Failure Moderate Moderate Moderate
7 Potable Water Failure Moderate Low Moderate
8 High Winds Moderate High Moderate
Chemical, Biological, Radiological, Nuclear,
9 Moderate Low Moderate
and Explosives Events (CBRNE)
10 Water-/Foodborne Disease Outbreak Moderate Low Moderate
11 Supply Shortage Moderate Moderate Moderate
12 Ice Storm Moderate Low Moderate
13 Active Shooter Moderate Moderate Moderate
14 Seasonal Influenza Low High Moderate
15 Cyber Attack Low Moderate Moderate
16 Workplace Violence Low Moderate Moderate
17 Network Failure Low Moderate Moderate
18 Wastewater Treatment Failure Low Low Moderate
19 Communications Failure Low Moderate Moderate
20 Vaccine Preventable Disease Outbreak Low Low Moderate
*The hazards are weighted by risk response to reflect the estimated priority for a regional response. The list was
developed with input from R9 Healthcare Coalition members with an emphasis on healthcare and EMS partners. As
such, It is not a comprehensive assessment of all members or disciplines, and does not provide details regarding the
unique attributes and risks for individual counties or facilities. The regional hazard vulnerability assessment is not a
replacement for an organization- or facility-specific HVA.
February 2018 3Region 9 Healthcare Hazard Vulnerability Assessment
HAZARDS REVIEW
When looking at the hazards by event-type, hazardous materials events (chemical, biological,
radiological, nuclear, explosives) were rated as a lower probability but the highest severity of impact.
Naturally occurring events were rated as having the highest probability followed by human related
events, though the severity of these events were rated lower.
Probability and Severity of Hazards
Technologic & Utility Events
Hazardous Materials Events
Events
Human Related Events
Naturally-Occurring Events
0 0.1 0.2 0.3 0.4 0.5 0.6 0.7 0.8
Increased Probability
Severity Probability
Another way to look at the relationship between probability and impact is with a scatter diagram. The all
hazards healthcare risk matrix is helpful in understanding how the events relate to each other based on
the raw scores provided from the survey.
• Generally, as the probability of a regional response increases, the overall impact to healthcare
services also goes up.
• Mass casualty, wildfire, and severe blizzard/snow fall are the only hazards to receive two or
more ‘high’ ratings.
• Some high occurrence events, like severe thunderstorm, were rated as lower response and
lower impact to healthcare.
• Other annual events like wildfire and severe blizzard/ snowstorm were rated as higher response
and higher impact to healthcare.
• Low occurring events like mass casualty and pandemic influenza were rated as high response
and impact.
February 2018 4Region 9 Healthcare Hazard Vulnerability Assessment
Region 9 All Hazards Healthcare Risk MatrixRegion 9 Healthcare Hazard Vulnerability Assessment
METHODOLOGY & RESULTS
The R9 HCC used the Arizona Coalition for Healthcare Emergency Response’s Community Hazard
Vulnerability Assessment (CHVA) tool to prioritize and weigh hazards.3 The CHVA is based on the Kaiser
Permanente HVA tool, but has been modified based upon the work of many partners including
Children’s Hospital Colorado and a Wisconsin workgroup consisting of state and local emergency
management and public health departments, tribal health and hospital emergency planners. The CHVA
includes a review of natural, technological, and human-caused hazards as they specifically relate to
healthcare.
Process Overview
The project was divided into three phases, using email to gather information, provide feedback, and
report conclusions. The first phase focused primarily on the healthcare and emergency medical services
(EMS) professionals. The second phase expanded the audience to also include emergency management
and public health to validate the findings from the first survey with cities/counties and local health
jurisdictions.
Round One Survey
Stakeholders: Healthcare, Emergency Medical Services
Objective: Identify and prioritize general hazards
(EMS)
Round Two Survey
Objective: Review prioritized healthcare hazard list, and Audience: Healthcare, EMS, Emergency Management,
assess readiness related to emergency management Public Health
Round Three Webinar
Objective: Provide overview of findings and outcomes Audience: All Stakeholders
3
Arizona Coalition for Healthcare Emergency Response. Community-based Hazard Vulnerability Assessment. Accessed 25 Sept
2017. https://azchercentral.org/hazard-vulnerability-analysis/.
February 2018 6Region 9 Healthcare Hazard Vulnerability Assessment
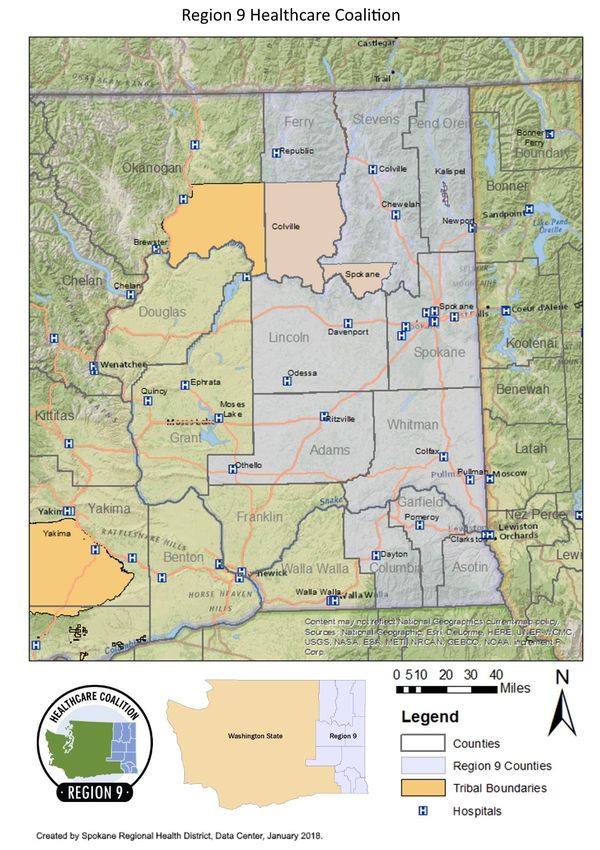
Prior to the Round One Survey, Region 9 HCC staff reviewed regional hazard mitigation plans and
previous HVAs to determine the baseline hazards. A template list from the CHVA was used as the
starting point, and then hazards that were not relevant to the region were eliminated, like hurricane and
tornado. Hazards that were not pertinent to the regional level were also eliminated, like internal fire,
HVAC failure, and indoor air quality issues.
A final list of 39 hazards were identified and grouped into the following categories. This summary was
used to prepare the list of general hazards prior to the first round of surveying.
Table 1. List of Regional Hazards4
Naturally Occurring Pandemic/Epidemic Human Related Technologic, Utility,
Events Events Events and Hazardous Events
•Dam Failure •Highly/Acute •Active Shooter •Communications
•Drought Infectious Disease •Civil Disturbance Failure
•Dust Storm Outbreak •Hostage Situation •Information Systems
•Earthquake •Pandemic Influenza •Mass Casualty Failure
•Flood/Flash Flood •Seasonal Influenza (Trauma) •Network Failure
•High Winds •Vaccine Preventable •Staffing Shortage •Cyber Attack
Disease Outbreak •Workplace Violence •Broken Water Main
•Ice Storm
•Water-/Foodborne •Supply Shortage (External)
•Landslide
Disease Outbreak •Mass Electrical
•Severe Blizzard/ •Transportation
Disruption Failure
Snow Fall
•I-90 Closure •Fuel Shortage
•Severe Thunderstorm
•Natural Gas Leak
•Temperature
Extreme (Cold) •Potable Water Failure
•Temperature •Wastewater
Extreme (Hot) Treatment Failure
•Volcanic Ash •Chemical, Biological,
Radiological, Nuclear,
•Wildfire
Explosives (CBRNE)
Participants were asked to review and rate the hazards based on the probability of the event and the
impact to healthcare services.5 Probability was calculated by two metrics: occurrence and response.
Typical HVAs assess probability with just occurrence, but this may result in higher ratings from high
frequency events. The response metric helps to offset the emphasis on occurrence, and helps raise the
standard to a higher community level.
4 To reduce emphasis on hazardous materials events, individual ratings from the chemical, biological, radiological, nuclear,
explosives events were combined to produce single averages for the occurrence, response, and impact metrics. This was
relabeled as the acronym CBRNE.
5 Standard HVAs done at the organizational level include metrics on impacts to humans, property, and business. For this
assessment, these are combined into one metric focusing on the impact to healthcare services at the regional level.
February 2018 7Region 9 Healthcare Hazard Vulnerability Assessment
Table 2. Definition of Metrics
Metric Definition Rating
Probability Occurrence: Likelihood of the 0 = Rare or N/A
incident to occur 1 = Low (Every 10-50 years)
2 = Moderate (Every 1-10 years)
3 = High (Annually)
Response: Likelihood there 0 = No regional response expected
would be a regional response 1 = Low regional response
2 = Moderate regional response
3 = High regional response
Impact Possibility of impact to regional 0 = No impact expected
healthcare services 1 = Low, causes minimal disruption; managed at daily
level
2 = Moderate, causes disruption outside of normal
means but does not threaten regional healthcare
service delivery
3 = High, causes significant disruption and threatens
regional service delivery
For naturally-occurring incidents specifically, occurrence was pre-populated in the survey based on a
review of regional hazard plans and the National Oceanic and Atmospheric Administration Storm Events
Database. For the other hazard categories, participants indicated the occurrence based on their own
organizational HVAs and professional experience.
Table 3. Historical Occurrences for Naturally-Occurring Incidents
Incident # of Regional Probability of Occurrence Round One
Occurrences 1996-20176 from 2011 R9 HVA7 Survey Rating
Dam Failure - Low 1
Drought 1 Moderate 2
Dust Storm 33 Moderate 2
Earthquake - Low 1
Flood/Flash Flood 132 High 3
High Winds 152 High 3
Ice Storm 23 Low 1
Landslide - Moderate 2
Severe Blizzard/Snow Fall 752 High 3
Severe Thunderstorm 186 High 3
Temperature Extreme (Cold) 17 Moderate 2
Temperature Extreme (Hot) 3 Low 1
Volcanic Ash8 1 Low 1
Wildfire 123 High 3
6 National Oceanic and Atmospheric Administration (NOAA). Storm Events Database. Accessed 11 October 2017.
https://www.ncdc.noaa.gov/stormevents/.
7 Washington State Homeland Security Region 9. Regional Threat/Risk Assessment and Vulnerability Analysis Report. January
2011. Prepared for Washington State Homeland Security Region 9. https://goo.gl/xb79YC
8 Mount Saint Helena eruption on May 18, 1980.
February 2018 8Region 9 Healthcare Hazard Vulnerability Assessment
Survey Results
Round One of the survey process was sent via email using the Region 9 HCC email account
(hcc@srhd.org) to the healthcare stakeholders, which consisted of 120 participants representing 50
facilities/organizations. Responses were collected from October 23 to November 3, 2017 via
SurveyMonkey.
A total of 29 responses were received. Over half of the responses came from Spokane County (17
responses), followed by Lincoln County (3 response), and Whitman County (2 responses). All other
counties had one response each. There was one response from the Kalispel Tribe. Participants
represented a variety of core member types, with over half coming from hospitals (18), followed by
outpatient (8) and behavioral health (6). Other sectors represented include public health, long-term
care, EMS, home health, primary care, and ambulatory surgery. The majority years worked was between
11-15 years and over 21 years in their field.
Participants represented the following organizations. Some organizations had multiple participants.
• Adams County Integrated Health Care • Newport Hospital & Health Services
Services • Northeast Washington Health Programs
• Columbia Surgery Center/ Columbia • Odessa Memorial Healthcare Center
Surgical Specialists • Providence Health Care
• Dayton General Hospital • Rockwood Clinic
• East Adams Rural Healthcare • Spokane Eye Surgery Center
• Eastern State Hospital • Spokane Regional Health District
• Ferry County Public Hospital District • Spokane Treatment and Recovery
• Frontier Behavioral Health Services
• Kalispel Tribe of Indians • Spokane Valley Ambulatory Surgery
• Kindred at Home Center
• Lincoln Hospital District 3 • St. Luke’s Rehabilitation Institute
• MultiCare Deaconess Hospital • Tri-State Memorial Hospital
• MultiCare Valley Hospital • Whitman Hospital and Medical Center
The Round Two survey was distributed on November 20, 2017 to December 1, 2017 via SurveyMonkey.
The second survey was sent to the same healthcare stakeholders as the first survey. The participant list
was also expanded to include public health and emergency managers as a way to verify the outputs
from the first survey and gather feedback on the ranking identified by healthcare partners. The second
survey was sent to 158 individuals and received 15 individual responses. This included 6 hospitals, 4
public health officials, and 3 each of long-term care and outpatient.
Participants in the second survey were asked to review the ranked hazards and provide any feedback on
the list. Additionally, participants were asked to rate the readiness of the region based on the four
phases of emergency management: mitigation, preparedness, response, and recovery.
• Mitigation refers to measures that reduce the chance of an emergency happening, or reduce the
damaging effects of unavoidable emergencies.
February 2018 9Region 9 Healthcare Hazard Vulnerability Assessment
• Preparedness refers to adequate regional planning in place to prepare for risk, including
planning, organizing, training, equipping, exercising, evaluating, and taking corrective action to
ensure effective coordination during incident response.
• Response refers to region’s ability to implement and take action on plans in place immediately
before, during, and after a hazard impact.
• Recovery refers to actions taken to return a regional to normal or near-normal conditions.
Round Three of the process was a webinar hosted by R9 HCC staff to review outputs of the Round One
and Two surveys, and discuss the ranked hazard list. All stakeholders were invited to the webinar, which
was hosted on Wednesday, December 13, 2017. Six people attended the webinar.
Final Analysis
Through discussion of the ranked hazards, concern was raised over how the hazards were being ranked
and whether the ranking was relevant to the organizational HVAs. In comparing the results from the two
surveys, the outputs of the Round One survey were more reliable and consistent. The Round One survey
had larger participation, including from all counties in the region, and a stronger cross-sector
representation of HCC core membership. The data was less skewed by outlier data, and better
represented both historic hazard vulnerability assessments and current and future priorities for the HCC.
Based on the results of the two surveys and the discussion in the webinar, the decision was made to
utilize the top hazard ranking from the Round One survey as the priority list for this regional healthcare
HVA.
Using the Round One data, the hazard ratings for each individual response were aggregated into a mean
and median score for each hazard and for each of the three metrics (Occurrence, Response, Impact).
Following this, the CHVA tool was then populated using the median score at the input metric. The
median was used for the CHVA because it denotes the midpoint of the frequency distribution.
Additionally, for the CHVA to work correctly, a whole number should be used for the input, which the
median produces. The output of the CHVA produced an initial hazard ranking.
February 2018 10Region 9 Healthcare Hazard Vulnerability Assessment
REGION 9 COMMUNITY VULNERABILITY PROFILE
A brief summary of the Region 9 community profile and social In the 2017-2022 Health
vulnerability indicators is included in this section. For a complete Care Preparedness and
discussion on the demographics and populations at-risk, please see the Response Capabilities,
Region 9 Healthcare Coalition Community Vulnerability Profile.9 ASPR directs that regional
healthcare hazard
vulnerability assessments
Geography
should consider
The R9 HCC area includes ten counties and three tribal areas in eastern
individuals who might
Washington. The region spans from the Canadian border in the north to
require additional help
the Columbia River in the south, and is bordered by Idaho to the east.
before, during, or after a
The area makes up 25% of the state’s total area with 16,454 square
disaster or emergency.
miles. Major geographic areas include the northern Rocky Mountains in
(ASPR 2017-2022,
northeast corner of the region; the Blue Mountains in the southeast
Capability 1, Obj. 2,
corner where Washington borders Oregon and Idaho; the
Activity 1)
Columbia/Central Basin lies in the center; and the region also contains
parts of the Snake and Columbia Rivers, along with numerous tributaries.
Eastern Washington experiences a diverse climate due to its location east of the Cascade Mountain
range. While the west half of the state is in a rainy oceanic climate, the eastern half receives little rainfall
due to the rain shadow created by the Cascade Mountains that casts a shadow of dryness east of the
mountains. Annual precipitation can range from a low of 7–9 inches in the dry areas near the junction of
the Snake and Columbia Rivers in the Columbia Basin, to a high of 75–90 inches of precipitation in the
more mountainous areas. Average seasonal temperatures can range from lows of 20s in the winter up
to high 90s in the summer.
Disaster Declarations
According to FEMA, there have been 40 natural disasters affecting the counties of Region 9 from 1953 to
2016, resulting in 129 disaster declarations at the county level.10
• Fire has received the most declarations across the region with 17 declarations, followed by flood
at 12 declarations, and severe storm at 7 declarations.
• At the county level, Spokane and Stevens counties have had the highest number of disaster
declarations in the region at 18 declarations.
• Most disasters have historically occurred in August (13 declarations), followed by July (5
declarations) and January (4 declarations).
• Some of the major disaster declarations include the drought of 1977 that affected nine of the
ten counties in the region (as well as the majority of eastern Washington); the Mount Saint
Helens eruption and resulting volcanic ash in 1980; the ice storm event in 1996 that impacted
Spokane and Pend Oreille counties; and the widespread wildfires of 2015.
9Accessible on the Region 9 Healthcare Coalition website at www.srhd.org/hcc
10Federal Emergency Management Agency (FEMA). Data Visualization: Disaster Declarations for State and Counties. Accessed
December 28, 2017. https://www.fema.gov/data-visualization-disaster-declarations-states-and-counties.
February 2018 11Region 9 Healthcare Hazard Vulnerability Assessment February 2018 12
Region 9 Healthcare Hazard Vulnerability Assessment

Population Characteristics
With 671,178 residents in 2016, the Region 9 counties make up almost 10% of Washington’s total
population.11 Spokane County is the most populated county in the region at close to 500,000 residents,
and Garfield County is the least populated county in the region (and the State) with just over 2,200
residents. Region 9 includes some of the most rural counties in the state, with Garfield, Ferry, and
Columbia counties all having less than 5 people per square mile; Garfield County is the least populated
county with 3.2 persons per square mile.

The region has about the same percent of population under 18 years as the state, but eight of the ten
counties have larger populations of 65 years and older than the state total. Adams County has the
largest percentage of young residents in the region at 35.7% of the population, while Columbia County
has the largest percentage of elderly residents at 28.3%. These age groups are considered populations at
risk and could require additional needs in the event of an emergency.

Table 4. Population Characteristics by County
 County                   Total Population          % Population           % Population           Population per
                               (2016)              Under 18 Years        65 Years and Over         Square Mile
                                                                                                  (2010 Census)
 Adams                         19,238                  35.7%                   10.5%                   9.7
 Asotin                        22,306                  20.8%                   21.7%                   34
 Columbia                       3,938                  17.8%                   28.3%                   4.7
 Ferry                          7,614                  17.4%                   25.1%                   3.4
 Garfield                       2,247                   20%                    25.7%                   3.2
 Lincoln                       10,350                  21.4%                    25%                    4.6
 Pend Oreille                  13,123                  19.2%                   24.6%                    9.3
 Spokane                       499,072                 22.2%                   15.6%                   267.2
 Stevens                       44,439                  21.9%                   22.1%                   17.6
 Whitman                       48,851                  15.3%                   10.1%                   20.7
 Region 9 HCC (total)          671,178                 21.9%                   16.2%               37.4 (average)
 Washington                   7,288,000                22.4%                   14.8%              101.2 (average)

Tribal Area Demographics
In Region 9, there are three tribal areas: Colville (which is half in Region 9 and half in Region 7), Spokane,
and Kalispel. The total population of the three tribes in Region 9 is 9,827 as reported on reservations
and off-reservations trust land in the American Community Survey.12 Three-quarters of the tribal
population in the region is part of the Colville Tribal Area. Kalispel (23.2%) and Spokane reservations
(22%) have higher percentages of population under 18 years old, while the Colville Reservation had a
higher percentage of population 65 years and over (14.9%).

11U.S. Census Bureau. Annual Estimates of the Resident Population: April 1, 2010 to July 1, 2016.
12American Community Survey. My Tribal Area. 2012-2016 American Community Survey 5-Year Estimates. Accessed 27 Nov
2017. https://www.census.gov/tribal/.

February 2018                                                                                                        13
Region 9 Healthcare Hazard Vulnerability Assessment
Table 5. Demographics by Tribal Area
People Colville Tribal Area Kalispel Tribal Area Spokane Tribal Area
Total Population 7,478 285 2,064
Population under 18 years 24% 29.8% 32.2%
Population 65 years and over 15.1% 8.4% 12.6%
Region 9 Social Vulnerability
During disasters, populations with higher levels of social vulnerability are more likely to be adversely
affected. Vulnerability to hazards is influenced by many factors, including age or income, the strength of
social networks, and neighborhood characteristics. Evidence indicates that communities that exhibit
certain social conditions, including high poverty, low percentage of vehicle access, or crowded
households, are more vulnerable at all stages—before, during, and after—of an emergency.
To help identify vulnerable populations and at-risk individuals, the Center for Disease Control developed
the Social Vulnerability Index (SVI).13 The SVI can help emergency managers better prepare for and
respond to emergency events and hazards by identifying areas with higher vulnerabilities and higher
rates of access and functional needs. The SVI provides an overall ranking for each census tract that can
be aggregated at the county level to provide a comprehensive assessment. Percentile ranking values
range from 0 to 1, with higher values indicating greater vulnerability.
SVI Outputs for Region 9 Counties:
• Adams County has the highest social vulnerability ranking in the region with a ranking of 1,
which is reserved for the most vulnerable.
• When looking at the rankings by social vulnerability theme, Adams County received the highest
ranking available in socioeconomic status, and minority status and language. When compared to
all counties across the state, Adams County is the most vulnerable according to the SVI.
• Ferry, Columbia, Pend Oreille, and Stevens counties all have higher than average social
vulnerability rankings.
• Ferry County received high ranking in socioeconomic status as well, while Asotin, Columbia,
Pend Oreille, and Stevens counties received high rankings in household composition and
disability status. Spokane and Whitman counties received high rankings in housing and
transportation.
• Lincoln County has the lowest social vulnerability with an overall ranking of 0.03, followed by
Garfield County with 0.07.
• Lincoln County is also the least vulnerable county in the region and the second to least in the
entire state, received the lowest rankings possible in minority status and language, and housing
and transportation.
• Spokane County, the most populated county in the region, has a moderate vulnerability ranking
at 0.39.
13
Agency for Toxic Substances and Disease Registry/ Geospatial Research, Analysis, and Services Program. Social Vulnerability
Index 2014 Database Washington. Centers for Disease Control and Prevention. Accessed on 22 Nov 2017.
https://svi.cdc.gov/SVIDataToolsDownload.html.
February 2018 14Region 9 Healthcare Hazard Vulnerability Assessment
Overall Social Vulnerability Index Ranking, by County
Regional Average 0.46
Lincoln 0.03
Garfield 0.08
Whitman 0.26
Asotin 0.32
County
Spokane 0.39
Pend Oreille 0.53
Stevens 0.55
Columbia 0.61
Ferry 0.84
Adams 1.00
0 0.1 0.2 0.3 0.4 0.5 0.6 0.7 0.8 0.9 1
Overall Vulnerability Ranking
(0 = low, 1 = high)
Information on the location and relative concentration of different types of social vulnerabilities can
help emergency managers locate and plan for the specific needs of their communities. Examples of
using this information include identifying areas with hard-to-reach, underserved population groups in
the region; identifying areas in need of emergency shelters; identifying communities that will need
continued support to recover after an emergency or natural disaster; and helping allocate emergency
preparedness funding based on community need.
Stakeholders noted the need to better understand and meet the unique vulnerabilities of persons at risk
in the region to improve community health and resilience. Effective emergency preparations require an
integration of individual and population level approaches to overcome barriers to locating and reaching
at-risk persons before and during an emergency. The information provided here can help emergency
managers to think critically about the identification and engagement of at-risk groups and how to best
serve them over the course of a disaster.
February 2018 15Region 9 Healthcare Hazard Vulnerability Assessment CONCLUSION This Regional Healthcare Hazard Vulnerability Assessment is the first time the Region 9 Healthcare Coalition has undertaken an analysis of potential hazards and the impact on the demand for healthcare services or the ability to provide those services across the region. The assessment focuses on the input of healthcare partners as the primary stakeholder through an all hazards approach that includes naturally-occurring events, human-related events, and technologic and utility events. The assessment offers a prioritized list of hazards that can serve as a baseline for future organizational and jurisdictional HVAs in planning, training, mitigation, response, and recovery activities. The Region 9 HCC HVA is intended to be a broad strategic planning tool that provides linkages among hazards, risks, and vulnerabilities so that healthcare partners can better plan for emergencies and disasters. The threat picture for the region is dynamic and will change over time. Future planning efforts that utilize this document to assist in prioritizing activities must weigh relative risks and vulnerabilities. Not all hazards are equal in terms of risk, and therefore all real and perceived vulnerabilities may not apply. The top regional hazards list is not absolute, and reflects the participants’ experience and expertise. Ultimately, it is local, state, and national priorities, budgets and funding, and the dynamic nature of threat and risk assessments that will drive long-range preparedness efforts for Region 9. The Region 9 HCC will review this HVA annually to ensure it is consistent with current planning priorities and to reflect any changes in emerging hazards. February 2018 16
Region 9 Healthcare Hazard Vulnerability Assessment

APPENDIX
A.   References
B.   Round One Survey
C.   Round Two Survey
D.   Community Hazard Vulnerability Assessment Tool Template

February 2018                                                  17
Region 9 Healthcare Hazard Vulnerability Assessment

A. References
Agency for Toxic Substances and Disease Registry, Geospatial Research, Analysis, and Services Program.
Social Vulnerability Index 2014 Database Washington. Centers for Disease Control and Prevention.
Accessed on 22 Nov 2017. https://svi.cdc.gov/SVIDataToolsDownload.html.

American Community Survey. My Tribal Area. 2012-2016 American Community Survey 5-Year Estimates.
Accessed 27 Nov 2017. https://www.census.gov/tribal/.

Arizona Coalition for Healthcare Emergency Response. Community-based Hazard Vulnerability
Assessment. Accessed 25 Sept 2017. https://azchercentral.org/hazard-vulnerability-analysis/

Federal Emergency Management Agency (FEMA). Data Visualization: Disaster Declarations for State and
Counties. Accessed December 28, 2017. https://www.fema.gov/data-visualization-disaster-declarations-
states-and-counties

National Oceanic and Atmospheric Administration (NOAA). Storm Events Database. Accessed 11 October
2017. https://www.ncdc.noaa.gov/stormevents/

Office of the Assistant Secretary for Preparedness and Response (ASPR). 2017-2022 Health Care
Preparedness and Response Capabilities. November 2016. Accessed 25 Sept 2017.
https://www.phe.gov/Preparedness/planning/hpp/reports/Documents/2017-2022-healthcare-pr-
capablities.pdf

U.S. Census Bureau. Annual Estimates of the Resident Population: April 1, 2010 to July 1, 2016.

U.S. Department of Health and Human Services. MSCC: The Healthcare Coalition in Emergency Response
and Recovery. Chapter 5, Section 5.4: Hazards Vulnerability Analysis. May 2009. Accessed 21 December
2017.
https://www.phe.gov/Preparedness/planning/mscc/healthcarecoalition/chapter5/Pages/hazards.aspx

Washington State Homeland Security Region 9. Regional Threat/Risk Assessment and Vulnerability
Analysis Report. January 2011. Prepared for Washington State Homeland Security Region 9.
http://docplayer.net/12032464-Washington-state-homeland-security-region-9-regional-threat-risk-
assessment-and-vulnerability-analysis-report.html

B. Round One Survey
View on Dropbox: https://goo.gl/PQEw6e

C. Round Two Survey
View on Dropbox: https://goo.gl/ZQSkVa

February 2018                                                                                       18
Region 9 Healthcare Hazard Vulnerability Assessment
D. Community Hazard Vulnerability Assessment Tool

                                                      19
You can also read