RCEP: Goods Market Access Implications for ASEAN - Boston ...
←
→
Page content transcription
If your browser does not render page correctly, please read the page content below

Global Development Policy Center                                         G E G I W O R K I N G PA P E R 0 4 5 • 0 3 / 2 0 2 1

       G L O B A L E C O N O M I C G O V E R N A N C E I N I T I AT I V E

                                     RCEP: Goods Market Access
                                     Implications for ASEAN
                                     RAS H M I BAN G A, K EVIN P. G A LLAG HER A ND PR ER N A S HA R MA

                                     ABSTRACT:

                                     Free trade agreements (FTAs) are often signed by the developing countries in the hope of
                                     increasing their market access, improving their balance of trade (BOT) and reviving their
                                     economic growth by generating additional output and employment in their countries. How-
                                     ever, if FTAs worsen the BOT or net exports, they can adversely impact Gross Domestic
Rashmi Banga is a Senior
                                     Product (GDP) growth and employment in the country. In this context, this paper under-
Economic Affairs Officer in the      takes a detailed disaggregated product-level impact analysis of tariff liberalisation under
Unit on Economic Cooperation         Regional Comprehensive Economic Partnership (RCEP) on BOT of Association of South
and Integration among Develop-
                                     East Asian Nations (ASEAN) countries. It uses World Integrated Trade Solutions (WITS)-
ing Countries (ECIDC), United
Nations Conference on Trade          SMART simulations incorporating the sensitive lists (SLs) and tariff rate quotas (TRQs)
and Development (UNCTAD).            negotiated by countries in the RCEP. Such an analysis is not possible using any other meth-
She is former Head, Trade Com-       odology, especially the computable general equilibrium (CGE) models which use aggregate
petitiveness in Commonwealth
                                     sector level data and are based on unrealistic assumptions. The results of the simulations
Secretariat, where the Division
provided policy support to more      show that tariff liberalisation under RCEP will deteriorate the existing BOT of ASEAN vis-
than 30 countries. She was a         à-vis RCEP countries by six percent per annum, while BOT will improve for some of the
former Professor in Delhi Uni-       non-ASEAN countries in the RCEP. The maximum gains in terms of improved BOT will go to
versity. She has been recipient of
two Gold Medals for her research     Japan, followed by New Zealand. Post RCEP, BOT will worsen for Cambodia, Indonesia, Lao
on globalization and develop-        PDR, Malaysia, Myanmar, Philippines, Singapore, Thailand, and Vietnam. The results show
ment from Global Development         that imports of almost all ASEAN countries increase from China, except for Lao PDR and
Network, World Bank.
                                     Vietnam. However, China’s imports increase mainly from Japan and Korea, Rep., while its

                                        GEGI@GDPCenter
         www.bu.edu/gdp
                                        Pardee School of Global Studies/Boston University
imports decline from all ASEAN countries. China also experiences a worsening of its trade
                                       balance along with Korea, Rep. Exports to RCEP countries are estimated to fall for Cambo-
                                       dia, Malaysia, Myanmar, Philippines, Singapore, and Vietnam because of trade diversion
                                       in favour of more efficient exporters within the RCEP, while it will marginally improve for
                                       Indonesia, Lao PDR and Thailand, although the increase in their exports will be less than
                                       the increase in their imports. ASEAN countries will also lose tariff revenues at a time when
                                       their industrial and trade growth have been adversely impacted due to the pandemic and
                                       domestic financial resources are needed for reviving their economies and repaying their
    Dr. Kevin P. Gallagher is a        debts.
    Professor of Global Development
    Policy at Boston University’s      Keywords: RCEP, SMART Simulations, Tariff Liberalisation Impact, Balance of Trade, Sensitive Lists
    Pardee School of Global Stud-      and Tariff Rate Quotas, Tariff Revenue Loss
    ies and Director of the Global
    Development Policy Center. Gal-
    lagher also serves on the United
    Nations’ Committee for Develop-
    ment Policy and co-chairs the
    T-20 Task Force on International
    Financial Architecture at the
    G-20.
                                       1      Introduction
                                       The pandemic-hit global economy is facing multiple crises including health, economic, financial, and
                                       environmental. While developed countries are rolling out trillions of dollars’ worth economic recov-
                                       ery packages, developing countries lack the financial resources to boost their economies. Accord-
                                       ing to United Nations Conference on Trade and Development (UNCTAD) Trade and Development
                                       Report Update (2020)1, developing countries will not only be hit harder but will also take more
                                       time to recover. For developing countries to recover faster and recover better with resilient growth,
                                       it is important for them to revisit their trade and industrial policies. International trade can be an
                                       important vehicle for delivering growth if it improves a country’s balance of trade (BOT), gener-
                                       ates additional employment by boosting net exports, generates additional tariff revenues especially
                                       from imports of luxury items and provides important inputs and raw materials needed for indus-
    Prerna Sharma is an                trial growth. To this end, trade agreements can be useful policy tools, but it is important to assess
    Australia-based Consultant         whether they are able to provide additional market access and the associated gains.
    with United Nations Confer-
                                       In this context, the paper estimates the additional market access that can be achieved by developing
    ence on Trade and Development
    (UNCTAD). She has a Masters
                                       countries through the Regional Comprehensive Economic Partnership (RCEP). RCEP is an agree-
    in Economics and previously        ment negotiated initially between the ten members of the Association of South East Asian Nations
    worked as a Consultant with        (ASEAN): Brunei-Darussalam, Cambodia, Indonesia, Laos People’s Democratic Republic, Malaysia,
    the United Nations Develop-        Myanmar, Philippines, Singapore, Thailand, and Vietnam plus the six countries with which ASEAN
    ment Programme, Deloitte and       has free trade agreements (FTAs)- Australia, China, India, Japan, South Korea, and New Zealand.
    PwC in the area of international   However, India withdrew from the RCEP negotiations in November 2019 leaving 15 member coun-
    trade and development. She has     tries of RCEP to negotiate the agreement. RCEP was signed virtually between the 15 countries in
    been associated with partners      November 2020 but has not yet been ratified by all countries. The text of RCEP has 20 chapters
    and projects across South Asia,    including trade in goods, trade in services, investment, e-commerce, intellectual property, govern-
    Africa and the Pacific.            ment procurement and competition. This paper focuses on the chapter on goods and estimates the
                                       impact of RCEP on net exports and BOT of RCEP member countries, aiming at estimating the addi-
                                       tional market access which can be generated for ASEAN countries.

                                       1
                                           https://unctad.org/system/files/official-document/gdsinf2020d4_en.pdf

                                             GEGI@GDPCenter
2            www.bu.edu/gdp                  Pardee School of Global Studies/Boston University
The paper uses SMART simulations available on World Integrated Trade Solutions (WITS) (World
Bank) to estimate the impact of tariff liberalisation under RCEP on exports and imports of RCEP
member countries. The results are reported at a disaggregated level of six-digit. The analysis under-
taken uses the sensitive lists (SLs) and tariff rate quotas (TRQs) in the schedules of each member
country of RCEP. This is the only methodology which provides results at product-level disaggrega-
tion incorporating the SLs and TRQs into the analysis.

The results show that ASEAN will be a net loser in terms of its existing BOT post RCEP since its
BOT will deteriorate by six percent per annum. Imports into ASEAN will increase much more than
its exports. Within ASEAN, BOT deteriorates for Cambodia, Indonesia, Lao PDR, Malaysia, Myan-
mar, Philippines, Singapore, Thailand, and Vietnam. However, BOT improves substantially for non-
ASEAN countries like Japan and New Zealand. The reason for deterioration of BOT of most of the
ASEAN countries is trade diversion within the RCEP group towards more efficient exporters which
adversely impacts the existing exports of ASEAN countries. This will lead to decline in intra-ASEAN
trade as ASEAN countries import from more efficient exporters like China instead of other ASEAN
countries. The paper provides results of tariff liberalisation under RCEP at the Harmonized System
(HS) six-digit product level for each country. Change in exports, imports and BOT are reported for
each country vis-à-vis other RCEP partner countries.

The paper is organised as follows: section 2 critically reviews the existing studies on impact of RCEP;
section 3 provides existing trends in trade amongst RCEP member countries in the pre RCEP period
i.e., 2019; section 4 briefly discusses the negotiated SLs and TRQs of different countries in RCEP and
their trade coverage; section 5 discusses the methodology used in the paper to estimate the impact
of RCEP on BOT of RCEP countries; section 6 provides the results of impact of RCEP on imports of
member countries; section 7 provides a detailed analysis of change in imports post RCEP both at
the country and at the product level; section 8 discusses the results of the simulations of impact of
tariff liberalisation under RCEP on exports of member countries and section 9 concludes the paper
and summarises the results.

2 Existing Studies on Economic Implications of RCEP
There is extensive literature available on RCEP including studies that estimate its economic impli-
cations for both member countries (insiders) and non-member countries (outsiders). As FTAs
are growing in number and depth, assessment of their economic impacts has become important
to inform policymakers facing a multitude of potential FTAs. However, all the studies available on
impact assessment of RCEP use computable general equilibrium (CGE) modelling. CGE models have
been heavily criticised in economic literature for their unrealistic assumptions of perfect competi-
tion, full employment, balanced government budgets and unrealistic economic conditions.

Further, CGE models do not provide results at a disaggregated product level since they undertake
simulation for broad sectors. The results therefore face the problem of “aggregation”. More impor-
tantly, these models are unable to incorporate RCEP’s actual SLs and TRQs in their analysis. Any
gains shown by CGE models in terms of changes in gross domestic products (GDPs) of member
countries and associated gains in terms of foreign direct investments are therefore overestimated
since the increase in exports of member countries may not materialise if the products are in SLs
and face TRQs of the partner countries. This section critically reviews studies which provide impact
assessments of tariff liberalisation under RCEP using CGE models.

GEGI@GDPCenter
Pardee School of Global Studies/Boston University                                                         www.bu.edu/gdp   3
The Peterson Institute for International Economics (PIIE, 2020)2 has estimated economic gains for
                     the global economy from RCEP using a CGE model. The paper shows that RCEP will raise global
                     national incomes in 2030 by an annual $186 billion. It will yield especially large benefits for China,
                     Japan and South Korea and losses for India. China, Japan, and Korea are expected to gain $85 bil-
                     lion, $48 billion, and $23 billion, respectively. Other RCEP winners will include Indonesia, Malaysia,
                     Thailand, and Vietnam. However, inclusion of India in the study renders its results meaningless now.
                     Further, according to the study, the trade war between US and China makes RCEP especially valuable
                     because it strengthens East Asian interdependence raising trade among members by $428 billion
                     and reducing trade among non-members by $48 billion. RCEP will also create sizeable new trade
                     among the plus three countries. However, it needs to be noted that ASEAN FTAs with non-ASEAN
                     member countries precede RCEP and ASEAN’s existing significant economic integration means that
                     the marginal benefit RCEP creates for trade among them would be limited.

                     Another paper by the PIIE (2017)3 applies the CGE model used by Petri and Plummer (2016) and
                     Petri, Plummer and Zhai (2012) to analyse the effects of RCEP. This study yields somewhat larger
                     effects. The paper underscores the relative weakness of RCEP provisions and highlights that RCEP
                     members are more competitive than complementary in economic structure and no single economy
                     is accepted as a natural leader. It needs to be noted that the analysis of this paper also includes India.

                     The World Bank Group’s (2019)4 policy research working paper analyses the economic impact
                     of RCEP on the largest South East Asian economy and ASEAN member- Indonesia. The analysis
                     employs the LINKAGE model which is a dynamic global CGE model. Based on trade and relative
                     prices channels, the model evaluates the impact of a reduction of tariffs and Non-Tariff Measures
                     (NTMs) in goods and services brought about by RCEP. The CGE model is then combined with the
                     Global Income Distribution Dynamics (GIDD) microsimulation tool to study the impact of RCEP
                     on poverty and shared prosperity. GIDD distributes the macro-economic effects captured by the
                     CGE analysis across households using Indonesia’s National Socio-Economic Household Survey for
                     the year 2014. According to the study, RCEP is expected to yield lower gains as members have
                     already achieved a relatively high degree of liberalization among themselves and there is little pros-
                     pect to significantly advance that level. As regards the distributional impact of RCEP, it underlines
                     that RCEP offers lower gains in terms of poverty reduction, but better distributional outcomes and
                     the growth incidence curve has a U-shape in case of RCEP. It needs to be noted that this study was
                     published before India pulled out of RCEP. Further, assigning values to NTMs can be problematic.
                     Banga (2017)5 provides a detailed critique of this methodology.

                     All the above discussed studies undertake CGE modelling that has been strongly criticized in the
                     economic literature. The CGE models (including its variations and modifications) that have been
                     adopted in these studies are based on unreasonable assumptions such as perfect competition and
                     full employment that will always show positive gains in the gross domestic product (Raza et al,
                     2014)6. According to Taylor and Arnim (2006), most of the CGE models assume (i) fixed or ‘full’

                     2
                      Petri and Michael G. Plummer (2020), East Asia Decouples from the United States: Trade War, COVID-19, and East Asia’s
                     New Trade Blocs, June 2020
                     3
                      Peter A. Petri, Michael G. Plummer, Shujiro Urata, and Fan Zhai (2017), Going It Alone in the Asia-Pacific: Regional Trade
                     Agreements Without the United States, October 2017
                     4
                        Massimiliano Calì, Maryla Maliszewska, Zoryana Olekseyuk and Israel Osorio-Rodarte (2019), Economic and Distribu-
                     tional Impacts of Free Trade Agreements: The Case of Indonesia
                     5
                       Banga R. (2017), Critique of Impact Assessment of Regional Trade Agreements Using Non-Tariff Measures, https://papers.
                     ssrn.com/sol3/papers.cfm?abstract_id=3037435
                     6
                       Raza, W., Grumiller, J, Taylor, L., Tröster, B., von Arnim, R. (2014) ‘Assess TTIP: Assessing the Claimed Benefits of the
                     Transatlantic Trade and Investment Partnership’. Vienna: Austrian Foundation for Development Research

                         GEGI@GDPCenter
4   www.bu.edu/gdp       Pardee School of Global Studies/Boston University
employment of labour and capital is maintained everywhere in the world (ii) each country’s trade
deficit (or surplus) stays constant after liberalization and (iii) completely flexible taxes on house-
holds which enable each country’s internal economy to adjust smoothly.
The assumption regarding the ‘constant trade balance’ implies that if government revenues change
due to tariff reduction or other trade policies, government expenditures must adjust endogenously
to satisfy the fixed budget deficit. However, in real world, this is never the case. The assumption
regarding completely flexible taxes on households, implies “any changes in government budget are
automatically compensated by income tax rates on households”. These assumptions mean that the
models are designed in such a way that ‘the price system’ will always respond to liberalization in a
way which leads to increases in overall well-being. Further, study from Boston University by Dutt and
Gallagher (2020)7 estimates that trade liberalization does not appear to be correlated with an auto-
matic compensation for lost tariff revenue through other taxation measures in developing countries
and tariff revenue losses due trade liberalisation are permanent in developing countries unlike in the
developed countries.
According to Panagariya and Duttagupta (2001), CGE models that show ‘gains’ for a country from
its own preferential liberalization can do so only by using internally inconsistent assumptions. The
‘Armington assumption’ used in all CGE models including Petri et al (2020) implies that there exists
‘product differentiation’ i.e., no country, howsoever small, produces something which is also pro-
duced by another country in the world. In other words, domestic and foreign products are imperfect
substitutes. For example, it is assumed that vegetable oil produced in one country is different from
the vegetable oil produced by any other country and therefore it can never be completely replaced
by competing imports.
According to Raza et al (2014), the costs of ‘regulatory changes’ are also never estimated by CGE
models. RCEP involves regulatory changes in the member countries which can have huge short-term
adjustment costs which are ignored by the CGE models. The results of CGE models with respect to
gains in terms of GDPs and foreign direct investments are therefore not reliable.
India pulled out of RCEP citing differences over tariffs and other barriers and has stated that the deal
will hurt its farmers who fear a flood of cheaper imports from countries such as China8.
Sharma et al (2020) 9 estimates the impact of tariff elimination under the RCEP on various macro-
economic variables of the RCEP member countries by using the CGE Global Trade Analysis Proj-
ect (GTAP) Static model under two scenarios: (1) India does not join the RCEP, and (2) India joins
the RCEP. Relaxing some of the unrealistic assumptions mentioned above like full employment, the
results of the model show that India’s GDP would be adversely affected in case India joins this agree-
ment, and its overall trade deficit might deteriorate after joining the RCEP, especially with respect to
ASEAN and China. The study also finds that an RCEP without India might lose its shine as the GDP
of most of the other members of the RCEP would be negatively impacted by India’s decision to stay
out. ASEAN member countries will be adversely impacted by the agreement in terms of their trade
balance whether or not India joins the RCEP. Finally, the study concludes that it may not be favour-
able for India to re-join this mega FTA.
7
https://www.bu.edu/gdp/files/2020/07/GEGI_WorkingPaper_040_Final.pdf
8
https://www.indiatoday.in/news-analysis/story/5-reasons-why-pm-modi-pulled-out-rcep-in-bangkok-1615825-2019
-11-05
9
Sachin Kumar Sharma, G Badri Narayanan, Adeet Dobhal and Raihan Akhter (2020), A Quantitative Assessment of
India’s Withdrawal from RCEP: Issues and Concerns CEP, TWN Third World Network
GEGI@GDPCenter
Pardee School of Global Studies/Boston University www.bu.edu/gdp 53 Existing Trade Trends Pre RCEP
This section examines the existing trade trends among RCEP countries in the pre RCEP period i.e.,
in 2019.
3.1 Share in total trade in 2019
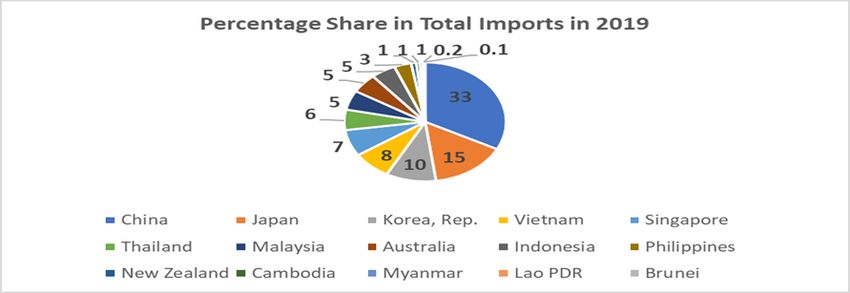
Examining the existing trade trends amongst the RCEP member countries in 2019, it is seen that
ASEAN countries share was around 36 percent in total imports within RCEP and 34 percent in total
exports. Figure 1 shows that in 2019, China was the biggest exporter in the group with a share of
30 percent followed by Japan (14 percent), Korea, Rep. (12 percent) and Singapore (10 percent). In
terms of imports, China again emerges as the biggest importer with a share of 33 percent followed
by Japan (15 percent) and Korea, Rep. (10 percent).
Figure 1: Share in Total Imports and Exports of RCEP Member Countries
Source: UN COMTRADE, WITS (World Bank and UNCTAD), 2019.
3.2 Composition of RCEP trade in 2019
Pre RCEP trends in imports amongst RCEP member countries show that in 2019 maximum trade
within RCEP comprised of chapter 85 (electrical machinery and equipment) with a share of 26 per-
cent, followed by chapter 84 (machinery and mechanical appliances) with a share of 12 percent.
Mineral oils and ores comprised 11 percent of total trade followed by plastic articles and motor vehi-
cles with a share of four percent each (Table 1).
Table 1: Composition of Imports in RCEP in 2019
HS Codes Description Percentage share in total
trade between RCEP
member countries
85 Electrical machinery and equipment and parts thereof; sound 26
recorders and reproducers, television image and sound record-
ers and reproducers, and parts and accessories of such articles
84 Nuclear reactors, boilers, machinery, and mechanical appli- 12
ances; parts
27 Mineral fuels, mineral oils and products of their distillation; 11
bituminous substances; mineral waxes
26 Ores, slag and ash 4
GEGI@GDPCenter
6 www.bu.edu/gdp Pardee School of Global Studies/Boston UniversityHS Codes Description Percentage share in total
trade between RCEP
member countries
39 Plastics and articles thereof 4
87 Vehicles other than railway or tramway rolling stock, and parts 4
and acc
90 Optical, photographic, cinematographic, measuring, checking, 3
precision, medical or surgical instruments and apparatus; parts
and accessories thereof
72 Iron and steel 3
29 Organic chemicals 2
71 Natural or cultured pearls, precious or semi-precious stones, 2
precious metals, metals clad with precious metal, and articles
thereof; imitation jewellery;
73 Articles of iron or steel 2
38 Miscellaneous chemical products 1
40 Rubber and articles thereof 1
74 Copper and articles thereof 1
62 Articles of apparel and clothing accessories, not knitted or 1
crocheted
61 Articles of apparel and clothing accessories, knitted or crocheted 1
Others 22
Total 100
Source: UN COMTRADE, WITS (World Bank and UNCTAD), 2019. Note: HS 2012 Nomenclature is used. Available: http://
www.wcoomd.org/en/topics/nomenclature/instrument-and-tools/hs_nomenclature_previous_editions.aspx.
4 Sensitive Lists and Tariff Rate Quotas with their Trade Coverage
The 15 RCEP member countries already have or are negotiating existing FTAs amongst themselves.
In addition to its internal FTA, ASEAN already has existing FTAs with the other five non-ASEAN
members i.e., Australia, China, Japan, New Zealand and Korea, Rep. Non-ASEAN countries also
either have an existing FTA among themselves or are negotiating such FTAs in addition to RCEP.
Any additional market access for ASEAN can therefore be gained from RCEP only if deeper tariff
liberalisation is undertaken which cuts through the existing sensitive lists of the member countries.
This section undertakes an analysis of the SLs and TRQs negotiated under RCEP by each country.
SL analysis in this paper covers all tariff lines which are identified by the countries either as no lib-
eralisation or limited liberalisation after a period of time or any product which has a tariff rate quota
attached to it. It also includes products which are selectively liberalised i.e., not fully liberalised fror
some partners. The sensitive list of a country therefore includes all tariff lines where the country has
decided not to reduce tariffs or gradually reduce tariffs over time but not to zero or have used TRQs10.
In this respect the analysis undertaken for SL is an underestimation of the impact of RCEP on trade
of the member countries as limited liberalisation is considered as no liberalisation for the purposes
of this analysis.
10
TRQs are defined as ‘quantities inside a quota are charged lower import duty rates, than those outside (which can be
high)’ See- https://www.wto.org/english/thewto_e/glossary_e/glossary_e.htm.
GEGI@GDPCenter
Pardee School of Global Studies/Boston University www.bu.edu/gdp 7Table 2 presents the results of the SL analysis at the HS six-digit level. The results show that devel-
oped countries like Japan and New Zealand have been able to protect 21 and 28 percent respectively
of their pre RCEP imports by value under their SLs and TRQs, while ASEAN has protected only on an
average 19 percent of its pre RCEP imports by value. Countries like Cambodia, Lao PDR and Myanmar
have protected much more than 20 percent of their pre RCEP imports under SL with Cambodia pro-
tecting 51 percent of its imports. In terms of the number of HS six-digit tariff lines under SL and TRQs,
the greatest number of tariff lines have been protected by Japan (1324) followed by Korea, Rep. (912).
The objective of SLs in a trade agreement is to provide some protection against import surges for
countries with developmental challenges post tariff liberalisation. However, RCEP SL analysis reveals
that it is the developed countries which have been able to negotiate higher protection against imports
as compared to ASEAN countries or even least developed countries within ASEAN.
Table 2: Imports and Number of Tariff Lines in Sensitive Lists of RCEP Members
Total imports in SL Total imports Number of tariff Imports under
and with TRQs pre Pre RCEP lines at six-digit SL and TRQs as
RCEP (1000 USD) (1000 USD) level in SL and percent of total
TRQs imports pre RCEP
Australia 1,539,216 101,725,789 90 2
Brunei 35,892 2,220,565 81 2
Cambodia 8,816,518 17,205,925 856 51
China 119,228,211 727,465,195 832 16
Indonesia 18,857,087 100,593,547 672 19
Japan 71,386,772 336,268,616 1324 21
Korea, Rep. 39,337,496 232,889,278 912 17
Lao PDR 1,216,431 4,438,236 487 27
Malaysia 15,693,318 122,922,465 450 13
Myanmar 2,936,687 11,819,114 445 25
New Zealand 5,905,134 20,935,159 474 28
Philippines 14,613,245 70,378,783 223 21
Singapore 0 141,488,408 0 0
Thailand 17,764,992 129,503,199 358 14
Vietnam 23,873,323 170,660,170 618 14
ASEAN 103,807,493 771,230,411 4,190 Avg-19
Total 341,204,322 2,961,744,860 7,822 Avg-18
Source: UN COMTRADE, SMART simulations, WITS (World Bank and UNCTAD), 2019. https://www.dfat.gov.au/trade/
agreements/not-yet-in-force/rcep/rcep-text-and-associated-documents.
5 RCEP: Impact on Trade Balance of ASEAN Countries
To estimate the impact of tariff liberalisation under RCEP on the market access of ASEAN countries,
both in terms of changes in exports as well as imports, tariff simulations have been undertaken. The
tariff lines under SL and those with TRQs have been included in the simulation analysis. The meth-
odology as well as the results are presented below.
GEGI@GDPCenter
8 www.bu.edu/gdp Pardee School of Global Studies/Boston University5.1 Methodology
To estimate the impact of RCEP on goods market access and BOT in goods in the member countries
of RCEP, we use SMART simulations which are available in WITS (World Bank and UNCTAD)11.
One of the advantages of this approach is that it allows estimation of the impact of tariff reduction
at a very disaggregated level, for example, the implications of removing tariffs on broken rice (at
HS six-digit disaggregation). Such a disaggregated product-level estimations of the impact of tariff
reductions are not possible in any other model. HS-Combined nomenclature is used by SMART
simulations12. The concordance matrices between HS Combined and HS 2012 have been used since
many RCEP countries provide their schedules using HS 2012.
SMART simulations are appropriate to use for RCEP analysis as it enables estimation of impact
of removal of tariffs of a member’s countries on exports and imports vis-à-vis all other member
countries. Both product-level as well as country-level disaggregated results are arrived at. This also
resolves several “aggregation biases” which are present in methodologies like CGE models which
use broad sector-level data as opposed to product-level data.
For estimating the impact of removal of tariffs on the trade of member countries, two scenarios are
considered, i.e., 100 percent trade liberalisation in all countries which RCEP aims at; and limited tariff
liberalisation incorporating the actual SLs and TRQs as identified by the member countries in their
RCEP schedules. All products which have limited liberalisation (i.e., tariffs do not go down to zero
and/or have tariff quotas) have been removed from the impact analysis of the countries. The results
of the analysis are provided using HS Combined nomenclature with concordance with HS 2012. The
reported changes in imports, exports and BOT are per annum changes. All the results provided in the
study for post RCEP incorporate SLs and TRQs.
5.2 Results of SMART Simulations: Impact of RCEP Agreement on Balance of
Trade in Goods
To undertake SMART simulations, the data used for RCEP member countries is for the year 2019
which is the latest available year in the model. For some countries, the latest data available in the
SMART Model is an earlier year, for example Cambodia (2016), Malaysia (2016), Thailand (2015)
and Korea, Rep. (2018). However, the data has been updated to 2019 in all these countries from UN-
COMTRADE and the results are presented for the updated years.
The pre RCEP figures for imports and exports are for the year 2019. The results of the SMART simu-
lation are presented in Table 3. Column 3 provides the results of 100 percent trade liberalisation in
RCEP member countries i.e., assuming all tariffs are brought down to zero. While column 5 presents
the results of limited liberalisation filtering in the sensitive lists and TRQs in the RCEP schedules of
all the member countries. As discussed above, if any tariff line has been selected for gradual liber-
alisation but does not go down to zero or has a TRQ, then that tariff line is removed from the impact
analysis assuming that there is no liberalisation under that tariff line. To this extent, the results may
be an underestimation of the actual impact on imports.
The results presented in Table 3 show that in terms of BOT post RCEP with 100 percent liberalisation,
the major gainer is Japan followed by Australia and New Zealand while BOT improves marginally
for Brunei. It needs to be noted that these results are with respect to tariff liberalisation using 2019
11
https://wits.worldbank.org/default.aspx
12
http://wits.worldbank.org/WITS/WITS/Support%20Materials/CMTNomenclatureandConcordancesList.aspx?Page=P
roductNomenclatureandConcordances
GEGI@GDPCenter
Pardee School of Global Studies/Boston University www.bu.edu/gdp 9applied tariffs, therefore any market access gains that countries like Australia may have from FTAs
preceding RCEP like the CPTPP are not taken into account.
The results show that the BOT deteriorates for all other ASEAN countries. Even when SLs and TRQs
in their schedules are considered, ASEAN countries’ BOT still deteriorates by around six percent,
i.e., ASEAN countries together will lose around USD 8.5 billion per annum post RCEP in their goods
trade balance. Of this, Malaysia will lose USD 4 billion per annum post RCEP, followed by Cambodia
with a loss of USD 2.3 billion per annum. Thailand, Vietnam, and Myanmar will lose around half a
million USD per annum post RCEP. Philippines and Indonesia will lose around USD 260 million and
USD 150 million, respectively.
Japan will experience the highest increase in its BOT which increases from USD 12.1 billion to USD
24 billion which is almost a 99 percent improvement. The BOT improves for New Zealand by around
six percent. While RCEP causes the BOT to worsen by 36 percent for Malaysia; more than 20 per-
cent for Myanmar and Thailand; and 17 percent for Cambodia. Although exports of China to RCEP
member countries increase post RCEP, its imports rise more than its exports making the net BOT of
China more negative.
Table 3: Impact of RCEP on Balance of Trade of RCEP Member Countries
Reporter BOT Before RCEP in Post RCEP BOT with Post RCEP BOT with Change in BOT Percentage Change
USD Million 100 percent liberali- limited liberalisa- pre and post RCEP in BOT Pre and Post
sation in USD Million tion including SL and including SL and RCEP with SL and
TRQs in USD Million TRQs in USD Million TRQ
Australia 93,453 96,388 94,429 976 1.0
Brunei 3,654 3,662 3,658 4 0.1
Cambodia -13,360 -17,932 -15,678 -2,318 -17.3
China -139,684 -141,061 -144,536 -4,851 -3.5
Indonesia -9,628 -10,006 -9,781 -152 -1.6
Japan 12,162 28,944 24,157 11,995 98.6
Korea, Rep. 36,073 29,793 33,169 -2,904 -8.0
Lao PDR -607 -361 -623 -16 -2.6
Malaysia 11,218 3,638 7,122 -4,095 -36.5
Myanmar -1,728 -2,078 -2,206 -479 -27.7
New Zealand 4,726 5,416 4,989 263 5.6
Philippines -23,359 -24,264 -23,623 -264 -1.1
Singapore -50,987 -50,467 -51,067 -80 -0.2
Thailand -2,983 -3,061 -3,654 -671 -22.5
Vietnam -52,133 -56,433 -52,635 -502 -1.0
ASEAN -139,912 -157,301 -148,487 -8,572 -6.1
Source: UN COMTRADE, SMART Simulations, WITS (World Bank and UNCTAD), 2019.
GEGI@GDPCenter
10 www.bu.edu/gdp Pardee School of Global Studies/Boston University6 Impact on Imports: Results of SMART Simulations
6.1 Change in total imports post RCEP
The results of the import analysis using SMART simulations show that imports into ASEAN will
increase by USD 7.8 billion with all RCEP countries experiencing an increase in their imports post
RCEP, even with their SLs and TRQs in place. The greatest increase in imports in absolute terms
amongst ASEAN countries is estimated for Malaysia, i.e., USD 3.7 billion per annum followed by
Cambodia (USD 2.3 billion) and Thailand (USD 876 million). Imports in non-ASEAN countries also
increase with the maximum change estimated is for China (USD 11.4 billion) followed by Korea, Rep.
(USD 6.3 billion) and Japan (USD 2.2 billion).
Table 4 : Change in Imports Post RCEP with Sensitive Lists and TRQs
Reporter Imports Pre RCEP Imports post RCEP with SL Change in imports post Percentage change in
(1000 USD) and TRQ (1000 USD) RCEP (1000 USD) imports post RCEP
Australia 101,725,789 101,739,013 13,224 0.0
Brunei 2,220,565 2,220,768 203 0.0
Cambodia 17,205,925 19,514,843 2,308,918 13.4
China 727,465,195 738,866,701 11,401,506 1.6
Indonesia 100,593,547 100,908,478 314,931 0.3
Japan 336,268,616 338,555,772 2,287,156 0.7
Korea, Rep.. 232,889,278 239,279,902 6,390,624 2.7
Lao PDR 4,438,236 4,489,601 51,326 1.1
Malaysia 122,922,465 126,682,161 3,759,696 3.1
Myanmar 11,819,114 11,990,688 171,574 1.5
New Zealand 20,935,159 20,941,855 6,696 0.0
Philippines 70,378,783 70,526,879 148,096 0.2
Singapore 141,488,408 141,488,408 0 0.0
Thailand 129,503,199 130,379,922 876,723 0.7
Vietnam 170,660,170 170,849,538 189,368 0.1
ASEAN 771,230,412 779,051,286 7,820,874 1.0
Source: Results of SMART Simulations, WITS (World Bank and UNCTAD), 2019.
6.2 Change in imports from other countries in RCEP
Table 5 provides results of the estimated change in imports of ASEAN and non-ASEAN countries
from their partner RCEP member countries post RCEP taking account of SLs and TRQs. The results
show that imports of almost all ASEAN countries increase from China, except for Lao PDR and Viet-
nam. Most of the increase in Cambodia’s imports i.e., 79 percent of rise in imports will be from China
while 71 percent of the increase in Indonesia’s imports will be from China. Around half of the increase
in imports of Malaysia, Myanmar and Philippines post RCEP will be from China.
GEGI@GDPCenter
Pardee School of Global Studies/Boston University www.bu.edu/gdp 11However, China’s imports increase mainly from Japan and Korea, Rep., while its imports decline from
all ASEAN countries. This shows that China will experience trade diversion post RCEP from ASEAN
countries in favour of Japan and Korea PDR. Vietnam and Philippines, experience maximum increase
in their imports from Korea, Rep.
Table 5 : Change in Imports from RCEP Partner Countries Post RCEP
Partner Change in Change in Change Change in Change in Change in Change in Change in Change
Name Cambodia’s Indonesia’s in Lao’s Malaysia’s Myanmar’s Philippines Thailand’s Vietnam’s in China’s
imports imports imports imports imports imports imports imports imports
post RCEP post RCEP post RCEP post RCEP post RCEP post RCEP post RCEP post RCEP post RCEP
(1000 (1000 (1000 (1000 (1000 (1000 (1000 (1000 (1000
USD) USD) USD) USD) USD) USD) USD) USD) USD)
Australia 27,698 49,012 5,814 62,383 14,423 1,065 39,264 3,077 197,788
Brunei 0 0 0 4,535 3 0 -3 0 -10
Cambodia 0 -722 -4 731 5 -48 30,181 -635 -11,914
China 1,834,800 225,578 -1,174 1,806,903 88,303 72,108 226,073 -95,287 0
Indonesia 8,994 0 -186 318,474 2,885 -3,192 -26,888 -5,886 -91,957
Japan 49,095 31,313 11,008 515,153 26,349 -7,558 300,795 68,891 9,558,544
Korea, Rep.. 26,007 23,357 403 156,063 4,976 102,009 77,860 264,708 3,159,647
Lao PDR 17 -3 0 233 -1 0 45,688 -100 -707
Malaysia 1,707 -2,757 -102 0 11,455 -3,531 -34,712 -8,751 -366,448
Myanmar 4,940 3,638 0 2,793 0 -39 178,113 -58 -5,430
New Zealand 802 12,019 49 10,789 2,020 -2 79,523 1,590 -55,420
Philippines 1,202 6,045 -1 28,956 1,138 0 -5,149 -1,893 -108,068
Singapore 11,593 -5,120 -65 264,772 1,615 -2,569 -15,197 -2,963 -243,187
Thailand 149,733 -13,846 35,810 469,815 10,821 -5,437 0 -33,328 -350,668
Vietnam 192,330 -13,582 -225 118,095 7,582 -4,710 -18,823 0 -280,665
Total Change 2,308,918 314,931 51,326 3,759,696 171,575 148,096 876,724 189,367 11,401,506
in Imports
Source: Results of SMART Simulations, WITS (World Bank and UNCTAD), 2019.
6.3 Total imports post RCEP
Table 6 shows the five products where imports values increased the most for ASEAN countries
post RCEP. The results show that imports of textiles and clothing are products with the greatest
increase in imports for Brunei, Cambodia, and Indonesia, while vehicles are products with the largest
increases in imports due to RCEP for Malaysia, Myanmar, and Vietnam. Electrical machinery and
mechanical appliances are also products with large increases in imports for Cambodia, Lao PDR,
Philippines, Malaysia, and Vietnam. While imports of certain agricultural products increase the most
for Thailand due to RCEP.
GEGI@GDPCenter
12 www.bu.edu/gdp Pardee School of Global Studies/Boston UniversityTable 6: Top Five Imports of ASEAN Countries Post RCEP
Country Two-digit product codes and description Absolute change in Percentage share in
imports (1000 USD) total change in imports
Brunei 94 furniture: bedding, mattresses, mattress supports, cushions and 166 82
similar stuffed furnishings; lamps and lighting fittings, not else-
where specified or included; illuminated signs, illuminated name-
plates and the like; prefabricated buildings
63 other made-up textile articles; sets; worn clothing and worn textile 23 11
articles; rags
64 footwear, gaiters, and the like; parts of such articles 14 7
Cambodia 60 knitted or crocheted fabrics 881,067 44
55 man-made staple fibres 249,200 13
84 nuclear reactors, boilers, machinery, and mechanical appliances; 157,783 8
parts thereof
52 cotton 83,232 4
87 vehicles other than railway or tramway rolling stock, and parts and 62,238 3
accessories thereof
Indonesia 61 articles of apparel and clothing accessories, knitted or crocheted 69,959 22
62 articles of apparel and clothing accessories, not knitted or 58,702 19
crocheted
73 articles of iron or steel 29,067 9
02 meat and edible meat offal 24,864 8
74 copper and articles thereof 21,926 7
Lao PDR 01 live animals 37,122 72
55 man-made staple fibres 3,605 7
84 nuclear reactors, boilers, machinery, and mechanical appliances; 1,647 3
parts thereof
85 electrical machinery and equipment and parts thereof; sound 1,071 2
recorders and reproducers, television image and sound recorders
and reproducers, and parts and accessories of such articles
05 products of animal origin, not elsewhere specified or included 949 2
Malaysia 87 vehicles other than railway or tramway rolling stock, and parts and 717,131 21
accessories thereof
84 nuclear reactors, boilers, machinery, and mechanical appliances; 451,799 14
parts thereof
85 electrical machinery and equipment and parts thereof; sound 299,553 9
recorders and reproducers, television image and sound recorders
and reproducers, and parts and accessories of such articles
48 paper and paperboard; articles of paper pulp, of paper or of 40,973 7
paperboard
73 articles of iron or steel 187,863 6
Myanmar 87 vehicles other than railway or tramway rolling stock, and parts and 58,802 34
accessories thereof
73 articles of iron or steel 12,768 7
10 cereals 12,767 7
GEGI@GDPCenter
Pardee School of Global Studies/Boston University www.bu.edu/gdp 13Country Two-digit product codes and description Absolute change in Percentage share in
imports (1000 USD) total change in imports
39 plastics and articles thereof 12,688 7
11 products of the milling industry; malt; starches; inulin; wheat gluten 10,925 6
Philippines 93 arms and ammunition; parts and accessories thereof 76,048 51
39 plastics and articles thereof 19,472 13
85 electrical machinery and equipment and parts thereof; sound 8,721 6
recorders and reproducers, television image and sound recorders
and reproducers, and parts and accessories of such articles
62 articles of apparel and clothing accessories, not knitted or 7,675 5
crocheted
84 nuclear reactors, boilers, machinery, and mechanical appliances; 7,602 5
parts thereof
Singapore Not applicable as it does not have SL and/or TRQ tariff lines
Thailand 07 edible vegetables and certain roots and tubers 339,345 39
10 cereals 147,590 17
73 articles of iron or steel 119,237 14
04 dairy produce; birds’ eggs; natural honey; edible products of animal 109,263 12
origin, not elsewhere specified or included
09 coffee, tea, maté and spices 82,686 9
Vietnam 35 albuminoidal substances; modified starches; glues; enzymes 86,489 46
85 electrical machinery and equipment and parts thereof; sound 77,444 41
recorders and reproducers, television image and sound recorders
and reproducers, and parts and accessories of such articles
87 vehicles other than railway or tramway rolling stock, and parts and 45,948 24
accessories thereof
73 articles of iron or steel 9,839 5
96 miscellaneous manufactured articles 9,522 5
Source: Results of SMART Simulations, WITS (World Bank and UNCTAD), 2019.
7 Detailed Analysis of Change in Imports Post RCEP: Country/
Product-Wise
The results of SMART simulations provide detailed analysis of which product will be imported by
the RCEP countries and from which RCEP country. This section highlights some of the key results of
import analysis for each of the ASEAN countries at the disaggregated HS six-digit level.
7.1 Detailed analysis of change in imports of Cambodia
Table 7 reports the results of detailed analysis of change in imports of Cambodia. The results show
that Cambodia’s imports increase mostly from China, i.e., 79 percent of its import increase will be
from China, followed by Vietnam and Thailand. Further, analysis at the product level reveal that
the top 20 imports of Cambodia post RCEP will be mainly in textiles and clothing and mechanical
appliances from China, parts of footwear from Vietnam and machinery and mechanical appliances
from China.
GEGI@GDPCenter
14 www.bu.edu/gdp Pardee School of Global Studies/Boston UniversityTable 7: Change in Cambodia’s Imports Post RCEP: Product/Country Analysis
Partner Name HS six-digit code with description Change in Imports post
RCEP in USD 1000
China 600690 - Other knitted or crocheted fabrics. 669,831
China 551599—Other woven fabrics of synthetic staple fibers 191,126
Malaysia 600690—Other knitted or crocheted fabrics. Other. 75,981
China 520929—Woven fabrics of cotton, containing 85 % or more by weight of cotton, 69,070
weighing more than 200 g/m2. Other fabrics
China 600490—Knitted or crocheted fabrics of a width exceeding 30 cm, containing by 50,931
weight 5 % or more of elastomeric yarn or rubber thread, other than those of heading
60.01. Other
Vietnam 600490—Knitted or crocheted fabrics of a width exceeding 30 cm, containing by 28,954
weight 5 % or more of elastomeric yarn or rubber thread, other than those of heading
60.01—Other
China 870540—Special purpose motor vehicles, other than those principally designed for the 28,889
transport of persons or goods (for example, breakdown lorries, crane lorries, fire fight-
ing vehicles, concrete- mixer lorries, road sweeper lorries, spraying lorries
China 843041—Other moving, grading, levelling, scraping, excavating, tamping, compacting, 25,881
extracting or boring machinerfor earth, minerals or ores; pile-drivers and pile-extrac-
tors; snow-ploughs and snow- blowers—Self-propelled
Vietnam 640620—Outer soles and heels, of rubber or plastics 25,190
Thailand 252310—Cement clinkers 25,153
Australia 010229—Live bovine animals—Other 23,967
China 551529—Other woven fabrics of synthetic staple fibers. Other 21,945
Thailand 600690—Other knitted or crocheted fabrics.- Other 18,724
China 761490—Stranded wire, cables, plaited bands and the like, of aluminum, not electrically 17,299
insulated—Other
China 611790—Other made up clothing accessories, knitted or crocheted; knitted or cro- 15,821
cheted Parts
China 640620—Outer soles and heels, of rubber or plastics 3,899
Vietnam 721410—Other bars and rods of iron or non-alloy steel, not further worked than forged, 12,758
hot-rolled, hot-drawn or hot-extruded, but including those twisted after rolling. Forged
China 721610—Further worked than hot-rolled, hot-drawn or extruded, of a height of less than 11,246
80 mm
Vietnam 410799—Leather further prepared after tanning or crusting, including parchment- 10,631
dressed leather, of bovine (including buffalo) or equine animals, without hair on,
whether or not split, other than leather—Other
China 845229—Sewing machines, other than book-sewing machines of heading 84.40; 9,651
furniture, bases and covers specially designed for sewing machines; sewing machine
needles—Other
Total of top 20 imports 1,346,947
Source: Results of SMART Simulations, WITS (World Bank and UNCTAD), 2019.
GEGI@GDPCenter
Pardee School of Global Studies/Boston University www.bu.edu/gdp 157.2 Detailed analysis of change in imports of Indonesia
Most of the increase in Indonesia’s imports will be from China. The share of HS chapters 61 and 62
i.e., articles of apparels and clothing will be highest constituting around 51 percent of total increase
in imports from China. This is followed by parts and accessories of vehicles and unmanufactured
tobacco and tobacco refuse, particularly of tobacco, partly or wholly stemmed/stripped (240120)
and tobacco, not stemmed/stripped (240110).
Table 8: Change in Indonesia’s Imports from China Post RCEP: Product/Country Analysis
Product code Change in Indonesia’s Percentage share
imports from China of products in total
post RCEP (1000 USD) imports from China
61 Articles of apparel and clothing accessories, 71,409 32
knitted or crocheted
62 Articles of apparel and clothing accessories, 59,571 26
not knitted or crocheted
87 Vehicles other than railway or tramway rolling 40,395 18
stock, and parts and accessories thereof
24 Tobacco and manufactured tobacco 20,522 9
substitutes
84 Nuclear reactors, boilers, machinery and 15,559 7
mechanical appliances; parts thereof
39 Plastics and articles thereof 13,336 6
Total of above 220,792 98
Total Change in Imports 225,578
Source: Results of SMART Simulations, WITS (World Bank and UNCTAD), 2019.
7.3 Detailed analysis of change in imports of Lao PDR
Table 9 reports the detailed analysis of change in imports for Lao PDR. Post RCEP the results show
that Lao PDR’s imports increase mainly from Australia, Japan and Thailand. the greatest increase
in Lao PDR’s imports from RCEP members will be in HS Chapter 0102 which is live bovine animals
(010239) from Thailand. This will be followed by an increase in imports of woven fabrics from Japan
(5514) and flours and meals from Australia.
Table 9: Change in Lao PDR’s Imports Post RCEP: Product/Country Analysis
Partner Name Product Codes (six-digit) Change post RCEP (in Percentage share in
1000 USD) the Change in Imports
Thailand 010239—Live bovine animals—Other 37,146 71
Japan 551430—Woven fabrics of synthetic staple fibres, containing less 1,615 3
than 85 percent by weight of such fibres, mixed mainly or solely
with cotton, of a weight exceeding 170 g/m²—Of yarns of different
colours
Japan 551219—Woven fabrics of synthetic staple fibres, containing 85 1,337 3
percent or more by weight of synthetic staple fibres—Other
GEGI@GDPCenter
16 www.bu.edu/gdp Pardee School of Global Studies/Boston UniversityPartner Name Product Codes (six-digit) Change post RCEP (in Percentage share in
1000 USD) the Change in Imports
Japan 050100—Human hair, unworked, whether or not washed or 971 2
scoured; waste of human hair
Australia 230110—Flours, meals and pellets, of meat or meat offal; greaves 905 2
Japan 551411—Woven fabrics of synthetic staple fibres, containing less 880 2
than 85 percent by weight of such fibreOf polyester staple fibres,
plain weave
Australia 847490—Machinery for sorting, screening, separating, washing, 803 2
crushing, grinding—Parts
Source: Results of SMART Simulations, WITS (World Bank and UNCTAD), 2019.
7.4 Detailed analysis of change in imports of Malaysia
The results show that post RCEP, the greatest increase in imports of Malaysia will be from China
which is around 48 percent of its total increase in imports followed by Japan. Table 10 reports the
imports greater than USD 20 million from China. Imports of HS chapter 3506 which is prepared
glues and other adhesive will increase by around USD 76 million. Of this, 350691 which is adhesives
based on polymers will experience the greatest increase. This is followed by Chapter 8708 which is
parts and accessories of motor vehicles and 8414 which is air or vacuum pumps.
Table 10: Change in Malaysia’s Imports from China Post RCEP: Product/Country Analysis
HS four-Digit Description Change in imports post Percentage share in total
Product Code RCEP in USD 1000 change in imports post RCEP
3506 Prepared glues and other prepared adhesives, 76,711 4
8708 Parts and accessories of the motor vehicles of headings 87.01 71,106 4
to 87.05.
8414 Air or vacuum pumps, air or other gas compressors and fans; 62,356 3
ventilating or recycling hoods incorporating a fan, whether or
not fitted with filters.
4819 Cartons, boxes, cases, bags and other packing containers, of 50,460 3
paper, paperboard, etc
8536 Electrical apparatus for switching or protecting electrical 48,036 3
circuits, or for making connections
8302 Base metal mountings, fittings and similar articles suitable for 35,275 2
furniture, doors, staircases, windows, blinds, coachwork, sad-
dlery, trunks, chests, caskets or the like;
4418 Builders’ joinery and carpentry of wood, including cellular 34,568 2
wood panels, assembled flooring panels, shingles and shakes.
8481 Taps, cocks, valves and similar appliances for pipes, boiler 32,663 2
shells, tanks, vats or the like, including pressure-reducing
valves and thermostatically controlled valves.
8716 Trailers and semi-trailers; other vehicles, not mechanically 27,958 2
propelled; parts thereof.
8702 Motor vehicles for the transport of ten or more persons, 26,568 1
including the driver.
GEGI@GDPCenter
Pardee School of Global Studies/Boston University www.bu.edu/gdp 17HS four-Digit Description Change in imports post Percentage share in total
Product Code RCEP in USD 1000 change in imports post RCEP
7228 Other bars and rods of other alloy steel; angles, shapes and 24,479 1
sections, of other alloy steel; hollow drill bars and rods, of
alloy or non-alloy steel.
9405 Lamps and lighting fittings including searchlights and spot- 23,185 1
lights and parts thereof,
8537 Boards, panels, consoles, desks, cabinets and other bases, 22,366 1
equipped with two or more apparatus of heading 85.35 or
85.36,
8704 Motor vehicles for the transport of goods. 21,572 1
7326 Other articles of iron or steel. 20,266 1
8712 Bicycles and other cycles (including delivery tricycles), not 20,032 1
motorised.
Total of above 597,601 33
Total 1,806,903
Source: Results of SMART Simulations, WITS (World Bank and UNCTAD), 2019.
Table 11 reports the results of Malaysia’s increase in imports from Japan. The maximum increase in
imports into Malaysia from Japan post RCEP will be of parts and accessories of motor vehicles, fol-
lowed by dust and powder of natural or synthetic precious and semi-precious stones (711590) and
motor vehicles of weight between 5 to 20 tons.
Table 11: Change in Malaysia’s Imports from Japan Post RCEP: Product/Country Analysis
Product Codes (six-digit) Change in imports post Percentage share in the
RCEP (in 1000 USD) change in total imports
870829—Parts and accessories of the motor vehicles of headings 87.01 to 51,939 10
87.05. Other
711590—Dust and powder of natural or synthetic precious or semi- precious
stones.
Other 39,848 8
870899—Parts and accessories of the motor vehicles of headings 87.01 to 30,576 6
87.05. Other
870324—Motor cars and other motor vehicles principally designed for the 24,075 5
transport of persons including station wagons and racing cars—Of a cylinder
capacity exceeding 3000 cm³
350691—Prepared glues and other prepared adhesives—Adhesives based 22,369 4
on polymers of headings 3901 to 3913 or on rubber
870840—Parts and accessories of the motor vehicles of headings 87.01 to 17,864 3
87.05. Gear boxes and parts thereof
870210—Motor vehicles for the transport of ten or more persons, including 12,054 2
the driver. With only compression-ignition internal combustion piston engine
(diesel or semi-diesel)
870830—Brakes and servo-brakes; parts thereof 10,386 2
GEGI@GDPCenter
18 www.bu.edu/gdp Pardee School of Global Studies/Boston UniversityProduct Codes (six-digit) Change in imports post Percentage share in the
RCEP (in 1000 USD) change in total imports
840991—Suitable for use solely or principally with spark-ignition internal 10,021 2
combustion piston engines
Total of above 246,487 48
Total Imports from Japan 515,153
Source: Results of SMART Simulations, WITS (World Bank and UNCTAD), 2019.
7.5 Detailed analysis of change in imports of Myanmar
The detailed results of the SMART simulations on imports of Myanmar are reported in Table 12. The
results show that the maximum increase in Myanmar’s imports post RCEP will be from Australia,
China and Japan. Imports of motor vehicles, woven fabrics and plastic articles increase from China
and Japan while imports of wheat and meslin (100199) increase from Australia.
Table 12: Change in Myanmar’s Imports Post RCEP: Product/Country Analysis
Partner Name Product Codes (six-digit) Change in imports post Percentage share in
RCEP (in 1000 USD) the change in imports
China 870410—Motor vehicles for the transport of goods -Dumpers 28,957 17
designed for off-highway use
China 871110—Motorcycles (including mopeds) and cycles fitted with an 18,827 11
auxiliary motor, with or without side-cars; side-cars. With recipro-
cating internal combustion piston engine of a cylinder capacity not
exceeding 50 cm³
Australia 100199—Wheat and meslin—Other 12,768 7
China 540761—Woven fabrics of synthetic filament yarn, including woven 5,232 3
fabrics obtained from materials of heading 54.04. Containing 85 per-
cent or more by weight of non-textured polyester filaments
China 730661—(2007-) Other tubes, pipes and hollow profiles—Of square 4,821 3
or rectangular cross-section
China 392690—Other articles of plastics and articles of other materials 1,972 1
Other
China 292242—Glutamic acid and its salts 1,744 1
China 392310—Boxes, cases, crates and similar articles 1,435 1
China 841810—Combined refrigerator-freezers, fitted with separate exter- 1,376 1
nal doors
Japan 852110—Video recording or reproducing apparatus, - Magnetic 1,310 1
tape-type
China 730300—Tubes, pipes and hollow profiles, of cast iron 1,297 1
China 721070—Flat-rolled products of iron or non-alloy steel, of a width of 1,273 1
600 mm or more, clad, plated or coated-Painted, varnished or coated
with plastics
China 620520—Men’s or boy’s shirts. Of cotton 1,140 1
China 721633—Angles, shapes and sections of iron or non-alloy 1,096 1
steel-H sections
GEGI@GDPCenter
Pardee School of Global Studies/Boston University www.bu.edu/gdp 19Partner Name Product Codes (six-digit) Change in imports post Percentage share in
RCEP (in 1000 USD) the change in imports
Japan 870410—Motor vehicles for the transport of goods -Dumpers 1,077 1
designed for off-highway use
Japan 551219—Woven fabrics of synthetic staple fibres, containing 85 1,051 1
percent or more by weight of synthetic staple fibers—Other
Total of above 85,376 50
Total Imports 171,575
Source: Results of SMART Simulations, WITS (World Bank and UNCTAD), 2019.
7.6 Detailed analysis of change in imports of Philippines
Table 13 reports the results of detailed analysis of imports of Philippines post RCEP. The simula-
tion results show that Philippines experiences a fall in imports from all ASEAN countries but a rise
in imports from China and Korea, Rep.. The products where the rise in imports from Korea, Rep.
occur are HS Chapters 93 (arms and ammunition), 85 (electrical machinery and equipment) and 39
(plastics and articles thereof ) and from China imports increase in chapters 39 (plastics and articles
thereof), 40 (rubber and articles thereof), 61 and 63 (articles of apparel and clothing and other made-
up textile articles), 64 (footwear, gaiters and the like; parts of such articles), 70 (glass and glassware),
84 (machinery and mechanical appliances) and 85 (electrical machinery and equipment) .
Table 13: Change in Philippines Imports Post RCEP: Product/Country Analysis
Partner Name Product Codes (six-digit) Change in imports post Percentage share in the
RCEP (in 1000 USD) change in total imports
Korea, Rep. 930690—Bombs, grenades, torpedoes, mines, missiles and 54,120 37
similar munitions of war Other
Korea, Rep. 930190 - Military weapons, other than revolvers, pistols and the 9,438 6
arms of heading 93.07—Other
Korea, Rep. 854430—Ignition wiring sets and other wiring 7,200 5
Korea, Rep. 391990—Self-adhesive plates, sheets, film, foil, tape, etc—Other 6,620 4
China 620322—Men’s or boy’s suits, ensembles, jackets, blazers, trou- 6,529 4
sers, bib—Of cotton
Korea, Rep. 930110—Military weapons -Artillery weapons 5,966 4
China 848180—Taps, cocks, valves and similar appliances for pipes, etc 5,847 4
- Other appliances
Korea, Rep. 930120—Military weapons, other than revolvers, pistols and the 5,619 4
arms of heading 93.07.- Rocket launchers; flame-throwers;
China 401120—New pneumatic tyres, of rubber—Of a kind used on 5,094 3
buses or lorries
China 630222—Bed linen, table linen, toilet linen and kitchen linen—Of 3,098 2
man-made fibres
Total of above 109,531 74
Total Imports 148,096
Source: Results of SMART Simulations, WITS (World Bank and UNCTAD), 2019.
GEGI@GDPCenter
20 www.bu.edu/gdp Pardee School of Global Studies/Boston UniversityYou can also read