R 587 - Firms' leverage across business cycles by Antonio De Socio - Questioni di ...
←
→
Page content transcription
If your browser does not render page correctly, please read the page content below
Questioni di Economia e Finanza
 (Occasional Papers)

 Firms’ leverage across business cycles

 by Antonio De Socio
December 2020

 587
 Number
Questioni di Economia e Finanza
(Occasional Papers)

Firms’ leverage across business cycles

by Antonio De Socio

Number 587 – December 2020
The series Occasional Papers presents studies and documents on issues pertaining to
the institutional tasks of the Bank of Italy and the Eurosystem. The Occasional Papers appear
alongside the Working Papers series which are specifically aimed at providing original contributions
to economic research.

 The Occasional Papers include studies conducted within the Bank of Italy, sometimes
in cooperation with the Eurosystem or other institutions. The views expressed in the studies are those of
the authors and do not involve the responsibility of the institutions to which they belong.

 The series is available online at www.bancaditalia.it .

ISSN 1972-6627 (print)
ISSN 1972-6643 (online)

Printed by the Printing and Publishing Division of the Bank of Italy
FIRMS’ LEVERAGE ACROSS BUSINESS CYCLES
 Antonio De Socio*

 Abstract

 Based on a large sample of mostly unlisted non-financial companies, this paper studies
the relationship between business cycles and firms’ leverage, disentangling the relative
contributions of debt and equity and assessing the role of firm size in explaining cross-sectional
heterogeneity. I find that aggregate leverage initially increases during busts, as debt growth
remains steady, while the counterbalancing contribution of equity is smaller; after one year, as
debt slows down, leverage decreases. Moreover, firm size matters, also after controlling for
other proxies of financial frictions (age, risk, profitability, debt structure): leverage increases
more at the beginning of busts for both very large and smaller firms; after one year, leverage
decreases less for the latter, mainly due to persistently lower profits.

JEL Classification: E32, G01, G32.
Keywords: debt, equity, firm size, business cycles, crises.
DOI: 10.32057/0.QEF.2020.587

 Contents

1. Introduction ............................................................................................................................ 5
2. Data and methodology ........................................................................................................... 7
 2.1 Firms accounting data and identification of the business cycles .................................. 7
 2.2 Methodology ................................................................................................................. 8
3. Leverage and business cycle: descriptive analysis ............................................................... 10
 3.1 Dynamics of the entire sample .................................................................................... 10
 3.2 Correlations by size, age, profitability, riskiness, and debt structure ......................... 13
4. Leverage and business cycle: regression analysis ................................................................ 15
 4.1 Results on the entire sample ........................................................................................ 16
 4.2 Results by groups of firms (size, age, profitability, riskiness, debt structure) ............ 17
 4.3 The role of size controlling for other characteristics .................................................. 18
 4.4 A deeper evaluation of the role of profits ................................................................... 19
5. Discussion of main findings and future developments ........................................................ 21
References ................................................................................................................................ 23
Appendix .................................................................................................................................. 24

* Bank of Italy, Directorate General for Economics, Statistics and Research.
1. Introduction *
 The financial structure of firms reflects their needs of sources of funding. Access to external
resources is especially important to support investments, as internal funding is usually sufficient to
sustain only ordinary activity. The study of leverage dynamics is especially important during the
negative phases of the cycle, as firms’ financial structure, self-financing capacity, and access to
external funding interact with both business activity (investments and employment) and financial
stability (solvency risks for investors).
 This paper aims at shedding light on the relation between business cycles and leverage of non-
financial corporations. A consensus in the empirical corporate finance literature on this issue is
lacking, also due to the heterogeneity of data used. Studies based both on macro and micro data find
that debt is procyclical, while results about equity are mixed, also because aggregate results are often
driven by a small number of very large firms.
 Jermann and Quadrini (2012) rely on US flow of funds and find that equity (debt) financing is
countercyclical (procyclical), suggesting that busts lead to a rebalancing of firms financial structure.
Studies relying on micro data of listed firms that distinguish by size classes confirm that debt is
procyclical, but do not agree about the cyclicality of equity. According to Covas and Den Haan (2011)
equity is acyclical or countercyclical if all firms are included, while it is procyclical once very large
companies (top 1 per cent) are excluded. The results depend also on the definition of equity. They
prefer two measures of “net amount of equity raised” (with or without dividends) derived as the
change of the book value of equity because: 1) in Compustat accumulated retained earnings are
excluded, thus including only funding from shareholders; 2) other measures like the “gross sale of
stock” or the “net sale of stock” (gross sale of stock minus repurchases) include also issuances related
to warrants, stock options or mergers. Karabounis, Macnamara, and McCord (2014) and Begenau and
Salomao (2018) find instead that procyclicality of equity is limited to smaller size classes (excluding
the top 25 instead of the top 1 per cent). In particular, Begenau and Salomao (2018) rely on
“shareholders’ equity net of retained earnings” to include only external funding and claim that Covas
and Den Haan (2011) incorrectly state that book value of equity excludes accumulated retained
earnings; in turn, this refinement explains the different findings on low cyclicality of equity and size.
Moreover, they also find that equity is procyclical (anticyclical) for smaller less profitable (larger
more profitable) companies, suggesting that dimension does not capture all heterogeneity
 The contribution to the literature relies on the use of individual data of 165,000 Italian firms
between 1982 and 2018. Since nearly all of them are unlisted, the results of this study are more general
than previous analyses limited to public companies. The availability of data on smaller firms provides
not only wider heterogeneity of firms’ characteristics, but also information on firms that are more
likely to experience financial frictions during downturns.
 Unlike previous works that analyse separately changes of debt and of equity, this paper studies
them jointly deriving a decomposition of the change of leverage in these two components.1 As debt

* I wish to thank Alessio Ciarlone, Davide Fantino, Andrea Nobili, Paolo Piselli, Andrea Silvestrini and Giordano Zevi
for their suggestions and the participants to internal seminars at the Bank of Italy for their helpful comments. The views
expressed in this paper are those of the author and do not necessarily reflect those of the Bank of Italy.
1
 The analysis is based on the change of leverage because it is less affected by the econometric issues of estimations based
on the level of leverage. As discussed in Murray and Shen (2019), estimation of the time variation of the level of leverage
should take into account the speed of adjustment towards a target level that is possibly time-varying or even a theoretical
value beyond the scope of firm managers.

 5
and equity usually drive leverage in opposite directions, their combined effect could be ambiguous,
especially during busts: leverage could increase because debt grows faster than equity or because a
decrease of debt is offset by a larger decline of equity due to losses. In this respect, this study also
assess the role of profits, a key driver of equity. Moreover, firm heterogeneity is not restricted to size
(as in the existing literature), but takes into account also age, profitability, riskiness, and debt
structure. Indeed these characteristics are important for leverage dynamics, particularly for unlisted
firms2 and during slumps, as they proxy heterogeneous exposure to financial frictions.
 The main finding of the previous literature, i.e. that the aggregate dynamics of leverage depends
on a minority of very large firms, is confirmed. During the long booms preceding the 1992-93 and
2001-03 downturns, leverage increased more persistently compared to the shorter expansion before
the global financial crisis. The contemporaneous correlation between busts and leverage is positive,
while the lagged one is negative. The decomposition developed in the paper explains the second
finding: as both debt and equity are procyclical, they drive the financial structure in opposite
directions and their combined effects depend on the different behaviours during busts. Leverage goes
initially up because debt growth remains somehow steady, while the counterbalancing effect of equity
becomes smaller; after one year leverage decreases, as debt slows down. Importantly, the dynamics
of equity during busts depends on procyclical profits, which dwarfs the contribution of shareholders’
funds or distributed dividends.
 A novel result is that leverage dynamics differ across size classes, and this finding persists also
when including other firms’ characteristics.3 The initial increase of leverage during busts is more
pronounced for both smaller (I-III decile by assets) and very large companies (X decile by assets)
compared to mid-size firms. The underlying forces are however different: smaller firms are more
affected by the negative effects of business cycles on equity caused by lower profits or even losses;
the largest have lower financial frictions and their debt slowdown is more subdued. These results also
imply that for the majority of firms (mid-size, IV-IX deciles) the relative contributions of debt and
equity imply a more balanced leverage dynamics. One year after the busts begin, smaller firms tend
to improve less their financial structure, mainly due to persistent low or negative profits, suggesting
that their problems are not short-lived.
 Overall, the results provide a guidance to assess which companies benefit more from policy
measures aimed at rebalancing financial structures during crises, an issue that has become more
important due to the effects of the Covid-19 pandemic.
 The paper is structured as follows. Section 2 summarises data on firm-level variables and business
cycles in Italy and describes the methodological features of the analysis. Sections 3 and 4 show the
results of correlation and regression analyses, respectively. Section 5 summarises the main findings,
discusses their relevance for the current pandemic crisis, and presents possible future developments.

2
 Dinlersoz et al. (2018) report extensive heterogeneity in leverage by firm age and size, especially that small (young)
unlisted firms are the least (more) leveraged. Frank and Goyal (2009) find that profitability is an important driver of
equity, especially for smaller firms. Farre-Mensa and Ljungqvist (2016) evaluate different measures of financial
constraints, finding they are more relevant for private companies; I include riskiness, the share of short-term or bank debt
to proxy respectively for the probability of bankruptcy, the refinancing risk and the exposure to lenders’ problems.
3
 The importance of size during business cycles shares some similarities with Crouzet and Mehrotra (2018), who analyse
the cyclicality of sales growth by size classes of a sample of mostly unlisted US manufacturing firms finding that
dimension matters also controlling for proxies of financial strength (leverage, liquidity, bank-dependence).

 6
2. Data and methodology
2.1 Firms accounting data and identification of the business cycles
 This paper combines detailed firm-level data of around 165.000 Italian non-financial corporations
and information on business cycles starting from 1982, a time span that encompasses two severe
downturns: the European monetary system crisis in the early Nineties and the more recent global
financial and euro area sovereign debt crises.
 The source of firms accounting data is Centrale dei Bilanci (CeBi), the only provider of yearly
balance sheet information whose database covers the two main crises. Its data refer to limited liability
companies and include nearly all the medium and large firms and around half of the small ones (see
Appendix A1 for further details). A more comprehensive database of the Italian corporate sector that
includes also micro firms is Cerved, whose data are however available only from 1993 and therefore
cannot be used to properly analyse the crisis in the early Nineties.
 CeBi data are used to derive the main variable of interest, leverage, calculated as the ratio between
financial debt (bonds, bank loans and other loans, also from shareholders) and its sum with equity at
book value. The main analyses of the paper focus on the yearly change of leverage in a 2-year closed
sample, subtracting from equity the value of reserves due to asset revaluations. This choice tackles
three issues discussed in Appendix A2 (the accounting effect of revaluations of assets on the value of
equity, the influence of firms’ demography and the impact of inflation).
 Differently from previous works that focus separately on changes of debt and equity, I disentangle
their relative contribution to financial structure over time. As discussed more in detail in Appendix
A2, the change of leverage is decomposed into the sums of debt and equity as follows:
 E ∗ D
(a) contribution of debt = (D
 + )∗(D −1 + −1 )

 D ∗ E
(b) contribution of equity =− (D
 + )∗(D −1 + −1 )

in order to precisely quantify how much the dynamic of leverage is due to the changes of debt, D ,
and of equity, E . This information is important as they drive leverage in opposite directions
(positive and negative, respectively) and their combined effect is therefore ambiguous.
 I also include in the analysis a specific assessment of equity, with the main aim of evaluating the
relevance of self-financing (profits net of distributed dividends) compared to external funding
(shareholders’ funds). As equity (E) is the sum of shareholders’ funds (SF), reserves (RES), profits
(PR) minus dividends (DIV), the percentage change of equity between t and t+1 is the following:
 E SF RES DIV
(c) = + + −
 −1 −1 −1 −1 −1

 The other firm characteristics derived from CeBi and employed in this paper to evaluate the
heterogeneity of the relation between leverage and business cycles are the following: size (based on
total assets), age, profitability (equal to the ratio EBITDA/assets), riskiness (based on Cerved Score
4), and the shares of bank or short term financial debt.
 The source of information on the Italian business cycles, in particular with respect to the
identification of booms (trough to peak) and busts (peak to trough), are Istat (2011) and Bank of Italy
(2018). Similarly to the classification of the National Bureau of Economic Research (NBER) for the

 7
US, the two phases of the cycle are based on a composite indicator relying on monthly and quarterly data and therefore some years can include both. I cope with the different time frequency of macroeconomic information and firm-level data as follows (additional information are presented in Appendix A3). Busts are identified from the official classification if a specific year includes at least three quarters going from peak to trough, which happens in most cases (1992, 1993, 1996, 2001, 2002, 2008, 2012). Four years (2003, 2009, 2011, 2013) are ambiguous, as they include two quarters of booms and busts; all of them are classified as contractionary based on quarterly GDP growth rates. The time span under analysis can be divided as follows: after a 3-year long bust (1980-1982), between 1983 and 2018 there have been 11 contractionary years (1992-93, 1996, 2001-3, 2008-09 and 2011-13) and 25 expansionary years. Based on this division, a dummy equal to one during the latter is used as the key variable to analyse the relationship between leverage and the two phases of the business cycle. A quantitative definition, based on yearly averages of quarterly GDP growth rates, is also used as an alternative to assess the main descriptive results found with the dummy variable. 2.2 Methodology In order to assess the relations between business cycles and leverage, this study relies on two complementary approaches: the first one uses graphical analyses and correlations, and the second is based on a regression analysis. While both evaluate the role of firms size and other characteristics (age, profitability, riskiness, debt structure), the second innovates compared to the extant literature as it specifically tests if size continues to matter controlling for other possible confounding factors. In both approaches, two dummy variables are created in order to identify both the contemporaneous and the lagged relation between business cycles and leverage: i) “BUST”, which is equal to one during slumps (1992-93, 1996, 2001-03, 2008-09, 2011-13); ii) “BUST+1Y”, which is the same dummy shifted one year ahead. The first approach links the different phases of a business cycle with three variables, the change of leverage ( ) and its two components (i.e. the contribution of debt and equity to the variation of leverage), according to the following equation E ∗ D D ∗ E (d) = (D − (D + )∗(D −1 + −1 ) + )∗(D −1 + −1 ) where debt and equity are summed across all the firms belonging to a specific group level “Gt”, which in turn is based upon specific firm characteristics. More precisely, 22 different groups have been defined each year according to: size: 10 deciles (based on assets distribution); age: 3 classes (young: first quartile by age; median: second and third quartile; old: last quartile); profitability: 2 classes (based on a dummy=1 if EBITDA is positive); riskiness: 3 classes (based on Cerved Z-score); debt duration: 2 classes (using a dummy=1 if the share of short-term debt is equal to 1); reliance on bank debt: 2 classes (using a dummy=1 if the share of bank debt is equal to 1). 8
The second approach relies upon three sets of panel regressions with firm fixed effects and firm-
clustered standard errors; each set includes six regressions that combine three dependent variables
and two cycle-related dummies. The three dependent variables, all winsorized each year at the 1st and
99th percentile, are the change of leverage (DLEVit), the contribution of debt (DFit) and that of equity
(EQit). A first specification includes the dummy BUST and a second one the dummy BUST+1Y. The
coefficients of these two dummies measure, for each dependent variable, the difference of its mean
between slumps (or one year later) and the remaining reference years.
 First set of regressions: include the entire sample of firms as follows
 (1) DLEVit=ai1 +β1BUST+e1it
 (2) DFit=ai2 +β2BUST+e2it
 (3) EQit=ai3+β3BUST+e3it
 (4) DLEVit=ai4+β4BUST+1Y+e4it
 (5) DFit=ai5+β5BUST+1Y+e5it
 (6) EQit=ai6+β6BUST+1Y+e6it
 Since algebraically the change of leverage is the sum of the contributions of debt and equity, the
role of the two components can be disentangled, both during slumps (BUST) and with a lag
(BUST+1Y) because β1≈β2+β3 and β4≈β5+β6.4
 Second set of regressions: based on regressions (1-6) for each of the 22 groups. Its aim is to
evaluate the existence of firms heterogeneity upon the phenomenon at stake, i.e. whether the change
of leverage and the relative contribution of debt and equity during slumps differ according to these
firm characteristics.
 Third set of regressions: extends the previous one, by taking contemporaneously into account all
firm characteristics. I run regressions (1-6) including again the entire sample (instead of firms
belonging to a specific group separately) and interacting first each size decile with busts or with a lag
(see A1 and A2) and then both size deciles and all other variables with busts or with a lag (see B1
and B2). More specifically the specifications are the following:
 (A1) Yit=aSI(SIZE)it +βSI(SIZE)it*BUST+eit
 (A2) Yit=aSI(SIZE)it +βSI(SIZE)it*BUST+1Y +eit
 (B1) Yit=aSI(SIZE)it +βSI(SIZE)it*BUST+aDI(DUMMIES)it +βDI(DUMMIES)it*BUST+eit
 (B2) Yit=aSI(SIZE)it+βSI(SIZE)it* BUST+1Y+aDI(DUMMIES)it +βDI(DUMMIES)it*BUST+1Y +eit
 where
 Yit=DLEVit or DFit or EQit (as in equations 1-4 or 2-5 or 3-6)
 I(SIZE) are 10 dummies, one for each size decile
 I(DUMMIES) are 7 dummies (2 for age classes, 2 for risk classes, 1 for profitability, share of bank
or short-term debt)

4
 The equalities β1=β2+β3 and β4=β5+β6 do not hold because the winsorization considers the distribution of each
dependent variable separately.

 9
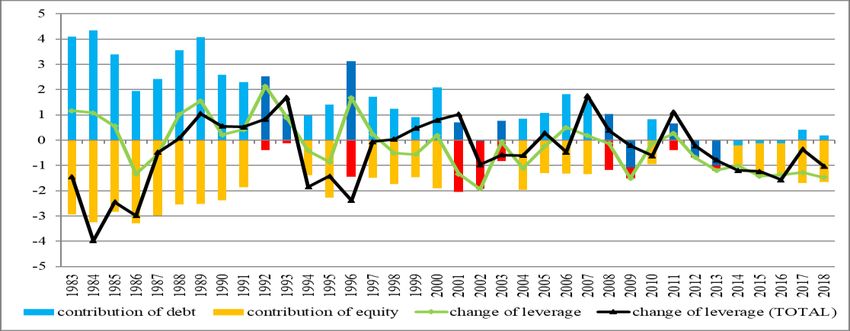
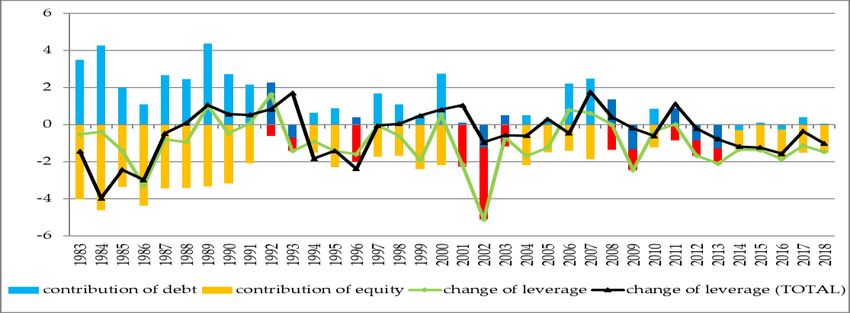
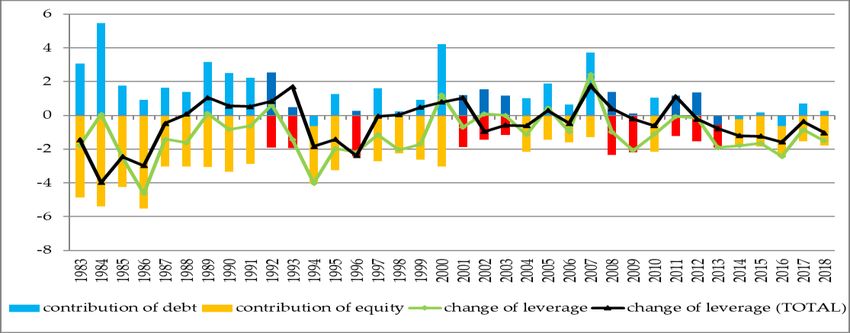
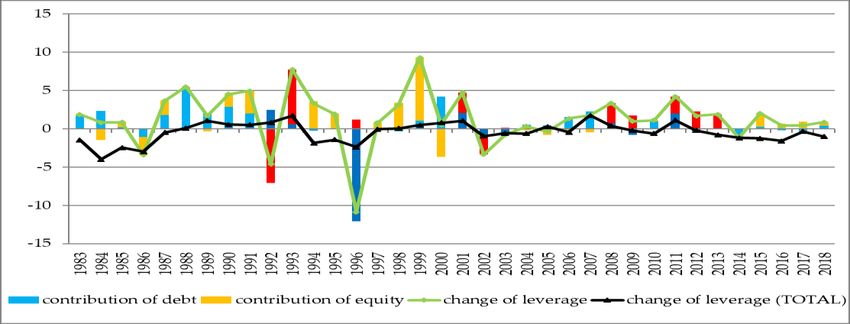
The coefficients of interest are the βS, which represent, for each size class, the average change of
leverage (or the contribution of debt and equity) during a slump (A1 and A2) or one year later (B1
and B2) compared with the remaining reference years. While specifications A1 and A2 are similar to
those presented in the second set of regressions, specifications B1 and B2 are the main object of
interest of the analysis as all other firm characteristics are controlled for.
 Regressions on equity components: I conclude the regression analysis with a specific assessment
of equity, replicating the first set of regressions and the third one (limiting to A1 and B1) as follows:
 (1e-5e) Yit=ai +βYBUST+eit
 (6e-10e) Yit=ai +βYBUST+1Y+eit
 (A1e) Yit=aSI(SIZE)it +βSI(SIZE)it*BUST+eit
 (B1e) Yit=aSI(SIZE)it +βSI(SIZE)it*BUST+aDI(DUMMIES)it +βDI(DUMMIES)it*BUST+eit
 where the five dependent variables Y are the equity growth rate (1e and 6e) and its four
components: i) shareholders’ funds (2e and 7e); ii) reserves (3e and 8e); iii) profits (4e and 9e); and iv)
dividends (5e and 10e). By construction, the estimated value βY in equations 1e and 6e are nearly equal
to the sum of the values of (2e to 5e) and (7e to 10e), respectively.

3. Leverage and business cycle: descriptive analysis
3.1 Dynamics of the entire sample
 Figure 1 shows the time series between 1983 and 2018 of the three variables of interest: the change
of leverage, and the contributions of debt and equity; contractionary years are shown in blue and red
for debt and equity, respectively.
 This evidence shows some differences in leverage dynamics during the two phases of business
cycles. During slumps, the contemporaneous and lagged relations between economic activity and
firms’ financial structure are reversed: leverage typically goes up in the first year of busts (1992,
2001, 2008, 2011) while it decreases immediately afterwards (except for 1993). The different role of
debt and equity explains leverage dynamics during slumps. In the first year of a bust the increase of
leverage is driven by a somehow steady growth of debt that overwhelms the smaller counterbalancing
contribution of equity; instead, after one year leverage decreases as debt slows down.
 During the positive phases of the cycle, leverage increased persistently in the years preceding both
the crisis of the European monetary system (1992-93) and the dot-com bust (2001-03), while there is
no clear leveraging pattern before the double-dip busts following the great financial crisis (2008-09
and 2011-13). These differences can be explained by the different length of economic expansions:
1983-1991 and 1994-2000 (albeit with a mild downturn in 1996) compared to 2004-07.
 Figure 2 confirms these relations using a quantitative measure of the business cycle. Leverage
tends to increase during busts (panel a, left) as the lower contribution of debt (panel b, left) is larger
than that of equity (panel c, left). The positive correlation between busts and debt is higher with a lag
(panel b), while the contemporaneous and lagged cyclicality of equity is similar (panel c).

 10
Figure 1 - Change of leverage and contribution of debt and equity (percentage points)

 Figure 2 – GDP, change of leverage and contribution of debt and equity (percentage points)
 a) change of leverage

 b) contribution of debt

 c) contribution of equity

Note: The X-axis shows the yearly average of the four quarterly GDP growth rates and the change of leverage (panel a),
the contribution of debt (panel b) and that of equity (panel c); the contemporaneous relationships are shown on the left
(slumps are identified by red circles) and lagged ones on the right.

 11
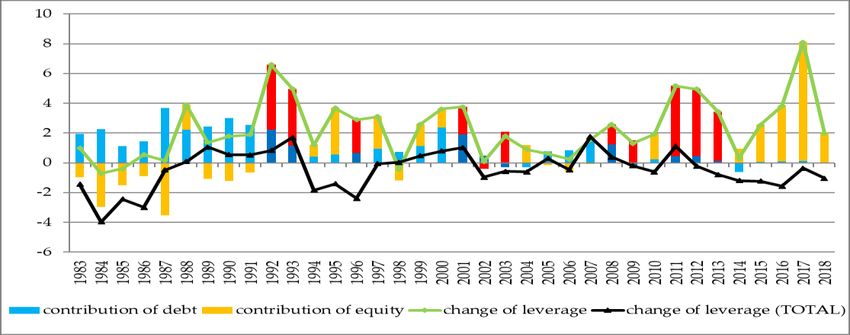
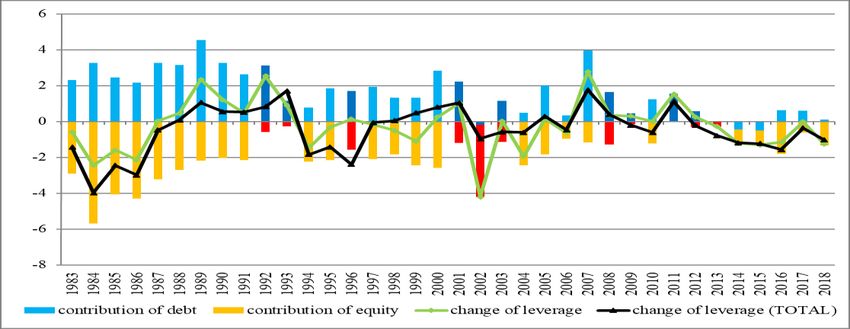
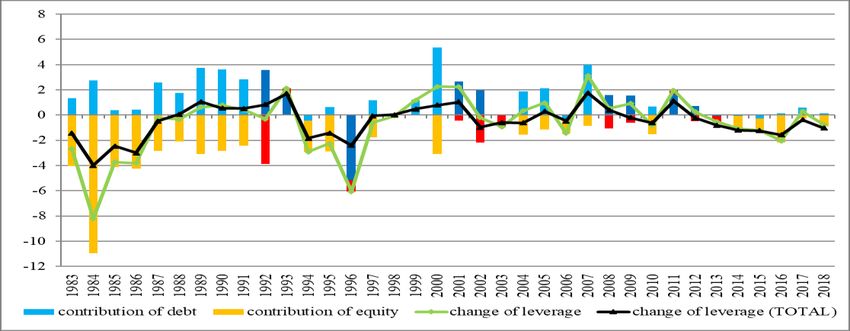
The existence of deleveraging patterns after each bust (1980-1982, 1992-93, 2001-3 and 2008-
09/2011-13), especially after the second and the fourth, is also linked to some specific dynamics of
equity.
 Figure 3 shows the yearly deflated percentage change of equity and its four components, with the
main aim of evaluating the relevance of retained earnings.5 It is clear that most of the variation over
time is not due to change of shareholders’ funds or reserves (apart in some specific years like 1983,
1984, 1992, 1999, 2000), but to large and volatile profits only partially compensated by small and
more stable dividends. Profits are positive and somehow increasing before busts and declining
thereafter (they are even negative in 1983 and in 1992-93), while dividends are a relatively stable
share of equity. The pay-out ratio (dividend/profits) is countercyclical: indeed, retained earnings are
negative in 1983, 1991-94, 2001-02, 2009 and 2011-13.
 After busts, the recovery of profits, combined with a persistent lower level of dividends and a
relatively stagnant contribution of debt, drives the rebalancing of firms financial structure. This
pattern is particularly clear after the European monetary system and the global/euro area crises: the
ratio of dividends to lagged capital was on average around 5 per cent between 1984-1990 and 2004-
08, while it went down to 2.5 and 3.5 per cent between 1992-97 and 2009-18, respectively.

 Figure 3 - Contributions to the rate of change of deflated equity (percentage points)

5
 See equation (c). All values are expressed in real 2003 euro.

 12
3.2 Correlations by size, age, profitability, riskiness, and debt structure
 The previous literature on the relation between leverage and the business cycle highlighted the role
of few very large firms when aggregate dynamics are evaluated. This finding is confirmed in Italy,
also because very large companies (the top centile of the size distribution by assets, consisting of
around 200-700 companies depending on the year) had a peculiar financial structure compared to
other firms. They were highly leveraged at the beginning of the ‘80s (Banca d’Italia, 1981),
strengthened their financial structure in the first years of that decade (Banca d’Italia, 1985) and also
in the second part of the Nineties (Varetto, 2005) so that their leverage nearly halved between 1982
and 1997 (for more details see Appendix A4).
 A preliminary assessment of the role of size follows the previous literature by creating 10 classes,
based on assets deciles calculated every year. Table 1A shows the unconditional correlations between
the change of leverage and the contributions of debt and equity with the business cycle both
contemporaneously (BUST) and after one year (BUST+1Y); aggregate correlations for the whole
sample of firms (first row) are then exploded distinguishing by size classes. The change of leverage
or the contribution of debt (equity) is procyclical if the correlation is negative (positive).
 Interestingly, there appear to be more similarities among smaller (I-III decile) and very large firms
(X decile) than those belonging to central classes (IV-IX decile). More specifically, the main features
are the following:
 1) Overall leverage tends to increase during busts (the contemporaneous correlation is 0.23, while
the lagged one is negligible), but heterogeneity across size classes is large. While the
contemporaneous correlation is quite low for smallest firms (I decile), it turns out being slightly
positive for the other extremes of the size distribution, i.e. for small and very large firms (II, III and
X decile), and negligible for the others. The lagged correlation is instead close to zero for all extreme
classes and negative for the central ones (IV-IX decile). These findings imply that leverage dynamics
during busts for the majority of firms (7 classes out of 10) are entirely different from the aggregate
one.
 2) The correlation with debt is procyclical and is higher with a lag. Values are lower for the extreme
classes (I-III and X decile) and quite high (around or above 50 per cent) for the central size classes
one year after the beginning of the slump.
 3) Equity is procyclical as well; differently from debt, the correlation is higher contemporaneously
and remains quite high with a lag; similarly to debt, correlations are lower for the I and X decile, but
larger for all the other classes.
 Summing up, these findings suggest that for central classes (IV-IX decile) the contributions of
debt and equity cancel out during busts (therefore the correlation is negligible), while after one year
the former overwhelms the latter so that leverage goes down. For the other size classes, the
correlations are lower and the picture is more mixed; the contemporaneous increase of leverage for
smaller firms (II-III decile) can be ascribed to the higher procyclicality of equity compared to that of
debt.

 13
Table 1A - Correlation between busts and change of leverage, debt and equity (by size)
 change of leverage contribution of debt (a) contribution of equity (b)
 BUST BUST1Y BUST BUST1Y BUST BUST1Y
TOTAL 0.23 -0.04 -0.27 -0.41 0.45 0.34
Size (deciles) I 0.00 -0.15 -0.20 -0.12 0.29 -0.06
 II 0.10 -0.10 -0.17 -0.29 0.56 0.34
 III 0.21 -0.07 -0.20 -0.35 0.73 0.47
 IV -0.12 -0.34 -0.36 -0.49 0.71 0.55
 V 0.03 -0.22 -0.30 -0.52 0.61 0.54
 VI -0.02 -0.31 -0.37 -0.55 0.58 0.51
 VII 0.05 -0.21 -0.37 -0.51 0.62 0.51
 VIII 0.03 -0.24 -0.32 -0.48 0.55 0.48
 IX -0.03 -0.28 -0.37 -0.49 0.53 0.48
 X 0.22 0.03 -0.19 -0.29 0.40 0.29
 I-IX 0.02 -0.27 -0.36 -0.52 0.59 0.51
 TOP 1 0.18 0.07 -0.14 -0.18 0.33 0.24
Note: The first, third and fifth column show the contemporaneous correlation between a dummy (BUST) identifying
contractionary years (1992-93, 1996, 2001-03, 2008-09, 2011-13) and the change of leverage or the contribution of debt
or equity; the second, fourth and sixth column show the lagged correlation, shifting the dummy one year ahead (BUST+1Y).
Values in red are higher than the average value (TOTAL) by more than 10 percentage points.
(a) A negative correlation means that debt is procyclical: during busts the positive contribution of debt to leverage is
lower (i.e. the growth of debt is lower with respect to expansionary years) or even negative. - (b) A positive correlation
means that equity is procyclical: during busts the negative contribution of equity to leverage is lower (i.e. the growth of
equity is lower with respect to expansionary years) or even positive.

 The heterogeneity of the relation between leverage and the business cycle depend also on other
firms’ characteristics that may affect differently the reaction of equity or debt during busts. This issue
is quite relevant, because size could proxy for other variables: for instance, smaller firms could be
younger, less profitable, riskier and more dependent on short-term or bank debt. The heterogeneity
of the relation between leverage and business cycles due to these variables can be summarised as
follows (Table 1B; more details are presented in Appendix A4):
 1) the leverage of old companies tends to increase during busts, mainly due to equity
contribution, while young firms are characterized by more erratic changes that are lowly correlated
with the business cycle;
 2) the leverage of firms with negative EBITDA is positively correlated with busts, especially
contemporaneously;
 3) leverage dynamics of sound firms are similar but less pronounced than the aggregate, while
risky ones show one of the highest positive correlation with busts, driven by equity contribution
contemporaneously and debt influence with a lag;
 4) the leverage of companies relying only on short term funding is negatively correlated with
busts with a lag, as the lower contribution of debt is one of the highest;
 5) firms relying only on bank funding have different cyclicality compared to less dependent
firms: the relation with busts is negative, driven by a stronger decline of debt.
 Summing up, there is a particularly high positive contemporaneous relation between leverage and
busts for old and unprofitable firms; the negative lagged correlation is higher for companies entirely
dependent on bank-debt. For risky firms and those depending on short-term debt the correlations

 14
remain instead positive and negative, respectively. Overall, such dynamics are more related to equity
(age and profitability), debt (share of short-term or bank funding) or both (riskiness).

 Table 1B - Correlation between busts and change of leverage, debt and equity (other
 characteristics)
 change of leverage contribution of debt (a) contribution of equity (b)
 BUST BUST1Y BUST BUST1Y BUST BUST1Y
TOTAL 0.23 -0.04 -0.27 -0.41 0.45 0.34
Age Young -0.19 -0.06 -0.32 -0.23 0.19 0.24
 Median 0.21 -0.24 -0.22 -0.52 0.45 0.24
 Old 0.40 0.01 -0.20 -0.39 0.54 0.31
EBITDA >0 -0.19 -0.05 -0.31 -0.18 0.06 0.11
Figure 4 - Change of leverage: mean and distribution by year (percentage points)

 Table 2 summarises the contemporaneous and lagged relation between business cycles and firms’
financial structure examined in the subsequent regression analyses. The yearly change of leverage
and of its two components during busts (BUST=1) or one year after its beginning (BUST+1Y=1) is
compared to the respective remaining reference years, confirming that the increase of leverage is
markedly higher during busts (1.02 versus 0.31 percentage points) but lower with a lag (0.42 versus
0.64 percentage points). A direct comparison between the contemporaneous and lagged means (1.02
and 0.42 percentage points) confirms that the difference is due more to the lower contribution of debt
(from 0.95 to 0.64 percentage points) than that of equity (-0.07 and -0.35 percentage points).

 Table 2 - Mean change of leverage and its components (percentage points)
 change of leverage contribution of debt contribution of equity
 1983-2016 0.56 1.29 -0.90

 BUST=1 1.02 0.95 -0.07
 BUST=0 0.31 1.48 -1.35

 BUST+1Y=1 0.42 0.64 -0.35
 BUST+1Y=0 0.64 1.66 -1.20

4.1 Results on the entire sample
 Table 3 reports the results of regressions (1-6), which confirm the dynamics derived from the
correlation analysis: compared with booms, leverage increases more during busts and less with a lag,
mainly reflecting the delayed dynamic of debt6.
 The values of the Constant represent the means of the three dependent variables during booms
(the reference period). The change of leverage is slightly positive (0.29 percentage points; col. 1), as
the positive contribution of debt (1.43 percentage points; col.2) is larger than the negative contribution
of equity (-1.32 percentage points; col. 3). The dummies BUST measure the deviation from such
means, i.e. the difference between busts and booms. The signs confirm that leverage increases more
during slumps (0.77 percentage points; col. 1) because the contribution of debt is lower (-0.40

6
 Results are confirmed using a different set of regressions that distinguish booming years into those closer to a through
and those closer to a peak (see Appendix A5).

 16
percentage points; col. 2), but is overwhelmed by the change of the contribution of equity (1.20
percentage points; col. 3). A comparison between the signs and point estimates of the dummies
BUST and BUST+1Y confirms that leverage grows slightly less with a lag (col. 4:-0.12 versus col.
1:0.77), because the markedly lower contribution of debt (col. 5:-0.93 versus col. 2:-0.40) more than
compensates a closer contribution of equity (col. 6:0.86 versus col. 3:1.20).

 Table 3 – Business cycles and leverage, debt and equity
 (1) (2) (3) (4) (5) (6)
 VARIABLES DLEV DF EQ DLEV DF EQ

 BUST 0.765*** -0.399*** 1.196***
 (0.0301) (0.0255) (0.0180)
 BUST+1Y -0.115*** -0.928*** 0.861***
 (0.0293) (0.0249) (0.0174)
 Constant 0.289*** 1.431*** -1.321*** 0.602*** 1.624*** -1.207***
 (0.0107) (0.00904) (0.00637) (0.0105) (0.00896) (0.00624)

 Observations 1665896 1665896 1665896 1665896 1665896 1665896
 R-squared 0.000 0.000 0.003 0.000 0.001 0.002
 Number of firms 165813 165813 165813 165813 165813 165813

4.2 Results by groups of firms (size, age, profitability, riskiness, debt structure)
 Figure 5 shows for each group of firms the results of regressions (1-6), i.e. the estimated
coefficients for the relations during slumps contemporaneously (i.e. β1≈β2+β3) with a lag (i.e.
β4≈β5+β6) or during booms (i.e. a1≈a2+a3). The main results are confirmed but heterogeneity is large.7
 During years of slump leverage has a U-shaped relation with size (Figure 5.a): the smaller and the
largest companies (I-III and X decile) tend to increase their leverage more than other firms, but the
underlying forces differ. For the smaller companies the reduction of equity is more important (green
histograms are higher compared to other deciles), while for the largest group the smaller decrease of
debt is relevant (compared to closest deciles, green histograms are similar but red histograms are
smaller), suggesting that the latter continue to access the credit or bond markets more than other
companies. The second main finding is that leverage increase more for risky and unprofitable firms,
due to lower profitability.
 The negative lagged relation between busts and leverage depends on contribution of debt that
mostly overwhelms that of equity in all groups and especially for larger firms (IV-X decile); leverage
remains stable for smaller firms (I-III decile), decreases more for young firms, while continues to
increase for riskier and unprofitable companies (Figure 5.b).
 During expansionary years leverage has an inverted U-shaped relation with size, so that the
middle-sized companies (IV-IX decile) increase their debt and leverage slightly more (Figure 5.c).
Two other firm characteristics stand out: the leverage of unprofitable and risky firms goes up the
most, as equity declines for both; however for the latter debt increases, suggesting that financial
frictions are lower for marginal borrowers during booms.

7
 Appendix A5 shows results by sector of economic activity.

 17
Figure 5 – Estimates of change of leverage and of its components (percentage points)
 a) contractionary years (dummy BUST)

 b) contractionary years one year later (dummy BUST+1Y)

 c) out of busts (Constant)

4.3 The role of size controlling for other characteristics
 The previous set of regressions show that size and other firms characteristics separately influence
the contemporaneous and lagged dynamics of leverage during slumps.
 Figure 6 summarises the main results of specifications A1/A2 and B1/B2, which include
contemporaneously all firms and variables. For each size class “s”, the estimated coefficients βS is
shown, i.e. the interaction terms between size deciles and slumps (contemporaneously or one year
ahead) with and without controls; the point estimates are not perfectly comparable among
specifications because the reference class is different,8 but they are remarkably similar.

8
 The reference class in regressions A1 (A2) is the first decile by size if BUST (BUST+1Y) is equal to 0. The reference
class in regressions B1 and B2 includes as additional conditions firms being young, safe, unprofitable and with shares of
bank and short term debt lower than 100 per cent.

 18
The two main results regarding size classes remain in both specifications: during a bust there is a
U-shaped relation as leverage increases more for smaller (I-III decile) and largest companies (X
decile; figure 6.A); financial structure of smaller firms improves less with a lag (Figure 6.B).
 Moreover, the differences of the estimated coefficients with respect to the I decile (which has the
extreme behaviour in all specifications) are similar, with one relevant exception: the contribution of
equity during a bust. The estimated coefficients become indeed similar when other variables are
included in the estimations (green histograms in Figure 6.A2 versus Figure 6.A1), meaning that the
heterogeneity by size classes is in part due to other firms characteristics.

 Figure 6 - Change of leverage and of its components by size classes (percentage points)
 A1) bust&without controls A2) bust&controls

 B1) lagged bust&without controls B2) lagged bust&controls

4.4 A deeper evaluation of the role of profits
 The analyses presented so far show that equity provides an important and persistent contribution
to leverage dynamics; on the base of the descriptive analyses of Section 3.1, profits represent a key
determinant of equity and it is therefore interesting to evaluate more in details the relations among
the different components of equity and the business cycle.
 Table 4 summarises the estimations of regressions 1e to 10e. The three main results are the
following. First, profits are the key driver of the change in equity growth during slumps (dummy
BUST in column 4E is similar to 1E), booms (Constant in column 4E is similar to 1E) and after a
bust (dummy BUST+1Y in column 9E is similar to 6E). Second, the estimated values of BUST and
BUST+1Y are close for all the dependent variables, suggesting that the negative effect of a slump on
equity is somehow persistent. Third, the reduction in the growth rate of equity in a slump due to lower
profits (-5.4 percentage points; column 4) overwhelms the somehow higher contribution coming from
dividends (+0.3 percentage points; column 5), confirming that the fall of profitability during a bust
cannot be compensated by lower dividends.

 19
Table 4 – Business cycles and equity components
 (1E) (2E) (3E) (4E) (5E) (6E) (7E) (8E) (9E) (10E)
 Equity Shareholders Reserves Profits Dividends Equity Shareholders Reserves Profits Dividends
VARIABLES growth funds growth funds

BUST -4.148*** -0.386*** 1.151*** -5.391*** 0.342***
 (0.0636) (0.0188) (0.0269) (0.0536) (0.00415)
BUST+1Y -3.111*** 0.178*** 0.513*** -4.120*** 0.348***
 (0.0625) (0.0187) (0.0267) (0.0514) (0.00411)
Constant 11.52*** 3.333*** -2.038*** 11.14*** -0.844*** 11.17*** 3.132*** -1.814*** 10.72*** -0.848***
 (0.0226) (0.00666) (0.00955) (0.0190) (0.00147) (0.0225) (0.00674) (0.00959) (0.0185) (0.00148)

Observations 1665482 1665482 1665482 1665482 1665482 1665482 1665482 1665482 1665482 1665482
R-squared 0.003 0.000 0.001 0.009 0.005 0.002 0.000 0.000 0.005 0.005
Number of firms 165790 165790 165790 165790 165790 165790 165790 165790 165790 165790

 Figure 7 presents the core evidence from regressions A1e and B1e, which aim to assess the
importance of profits as drivers of equity dynamics distinguishing by size classes without and with
other control variables, respectively. The three main results are the following. First, without control
variables the real changes of equity during busts with respect to booms (black circles in fig. 7A) are
lower for all size classes, especially for smaller firms (I-III decile). Second, the cross-size differences
becomes smaller but persists when other control variables are included in the regressions (black
circles in Fig. 8.B). Third, these dynamics are driven by profits, which decrease more for smaller
firms with respect to larger ones during busts (red squares in Fig. 8.A), also controlling for other
variables (red squares in Fig. 8.B).9

 Figure 7 – Rate of change of equity and profits by size classes (percentage points)
 A) bust&without controls B) bust&controls

9
 I report the estimated coefficients of the real percentage change of equity and the contribution of profits because other
contributions are negligible.

 20
5. Discussion of main findings and future developments
 This paper examines the relationship between business cycles and leverage in Italy focusing on
the role of size and other firm characteristics related to financial frictions such as age, risk,
profitability and debt structure. The analysis is mainly based on unlisted SMEs and therefore the
conclusions about the cyclical dynamics of debt and equity are more general compared to the previous
literature.
 The study disentangles the relative contributions of debt and equity to the changes of leverage,
both at the aggregate level and for specific groups of firms, relying on a descriptive analysis (based
on weighted means) and a regression analysis (based on simple means). Reassuringly the results of
the two approaches are similar, even if the change of leverage over the entire time span is slightly
negative (positive) when weighted (simple) means are considered.
 Both analyses based on the entire sample (Sections 3.1 and 4.1) find that leverage tends to increase
during busts mainly due to lower equity growth, and to decrease after one year as debt growth goes
down or becomes even negative. The influence of equity dynamics on leverage during busts is more
persistent, as it depends on the overwhelming contribution of procyclical profits, while the role of
shareholders’ funds is limited.
 The role of size is clear when the extreme classes are considered (Sections 3.2 and 4.2): weighted
averages show that very large firms (top 1 percent) drive the aggregate results, and the X decile
determines the dynamics of leverage. Correlation and regression analyses find some new results: the
relation between busts and leverage is more similar for smaller and largest firms (I-III and X decile)
compared to median ones (IV-IX decile), even if the financial structure of the I decile is less correlated
with business cycle.
 During expansionary periods the change of leverage is close to zero for the smaller and largest
firms (I-III and X decile). During busts these deciles show a larger increase of leverage with respect
to central ones though for different sources: equity for smaller firms (due to lower or negative profits)
and debt for largest firms (due to easier access to credit). Results on lagged relation are quantitatively
weaker, but it is clear that for smaller firms leverage continues to increase also after a bust.
 Section 4.4 shows the key innovative analysis of the paper: the role of size controlling for other
possible confounding factors.10 Reassuringly, the results found among size classes (the U-shaped
relations between leverage and busts driven by equity for the smaller firms and debt for the largest
companies) remain. However, the cross-size heterogeneity due to equity goes down. Section 4.5
shows that the introduction of control variables decreases the cross-deciles differences in profits,
which in turn drive equity dynamics.
 Overall, these findings provide some implications about the relationships between leverage,
economic growth and financial stability. Since smaller firms tend to increase leverage more than other
companies during busts and show no lagged reduction, they are more likely to experience higher
difficulties to invest or to access credit also during recoveries (e. g. Eramo et al., 2018). The evidence
related to the leveraging phases is less clear-cut, but the dynamics of riskier firms is interesting, as

10
 The main findings related to other characteristics can be summarized as follows. Young firms display more volatile
dynamics and, based on regression analysis, they tend to deleverage more with a lag; leverage of unprofitable and risky
firms tends to grow also during booms; the influence of debt structure is mixed, as the cyclicality of leverage for firms
relying only on short-term or bank funding is stronger than the others based on correlations, but similar using regressions.

 21
during expansions they tend to increase debt more than equity. Since these companies are more likely
to suffer losses also during booms, lenders should ensure companies’ shareholders increase equity in
good times to avoid an excessive unbalancing of the financial structure.
 The findings of this paper, based on a very long time span that includes three crises, can provide
guidance also in the light of the recent Covid-19 pandemic. Although its economic and financial
effects are difficult to forecast (as there is huge uncertainty about the evolution of the virus, the
development of treatments, and the results of the extraordinary policy measures taken to support the
economy), findings about firms’ leverage dynamics observed in previous historical episodes can be
useful to guide possible medium-term policy responses to the shock caused by the Covid-19
pandemic. Indeed, with respect to previous shocks, the combination of a (possible long-term) decline
of firms’ revenues and of a higher reliance on debit are likely to cause a larger increase of their
leverage, as debt slows down less and losses are larger. While initial policy measures were
fundamental to avoid widespread bankruptcies, a key issue to address in the medium term is the
rebalancing of firms’ debt with an increase of equity, especially in the case of smaller firms.

 The main findings of this paper can be extended along two main related dimensions, which would
also provide further information about the evolution during the pandemic crisis.11 First, including in
the analysis also firms cash holdings. This development is related to a strand of literature that started
after the financial crisis following the higher liquidity of firms (e.g. Acharya et al., 2007 and 2014;
Sufi, 2009). As cash is negative debt, firms can rebalance their financial structure by reducing
leverage and contemporaneously increasing liquidity; there is indeed some evidence that in Italy this
happened after all the main busts (early 80s, early 90s and the more recent crises; see Appendix A5
for details and Dottori and Micucci, 2018).
 The second extension would integrate the current evidence based on groups of companies and
dummy variables by evaluating financial flexibility at firm level, similarly to DeAngelo et al. (2018).
They study the deleveraging of US listed firms from their historical peak, finding that many
companies coupled leverage reduction and increasing liquidity. The underlying motivation is that
companies extensively increase their leverage when investment opportunities arise and rebuild their
financial flexibility thereafter, unless they go bankrupt. Interestingly, they also report that less than
half of these deleveraging processes occur during busts. This development would evaluate the
existence of firm-leverage cycles, with a specific interest on deleveraging phases, which are more
evident than leveraging ones on the base of the current analyses. Such study would complement the
current results by assessing the relevance of both business cycles and firm-specific features for
individual leverage dynamics. Its significance is supported by the preliminary evidence that also in
Italy the change of leverage is very idiosyncratic: its median is around zero also during busts, as
shown in Figure 4.12

11
 A third one, well beyond the scope of this paper, would be a more precise consideration of the supply side based also
on historical time series of banks accounting data (supervisory reports) and lending relations (credit register).
12
 This extension requires a new dataset including firms with “long enough time span” data. DeAngelo et al. (2018) start
with 14.000 firms, but then rely on less than 10.000 (with data for at least one year after their historical leverage peak)
and 4.500 (which have five or more years of post-peak evidence).

 22
References
 Acharya V. V., Almeida H., Campello M. (2007) “Is cash negative debt? A hedging perspective
on corporate financial policies”, Journal of Financial Intermediation 16, 515–554
 Acharya V. V., Almeida H., Campello M. (2014), “Aggregate Risk and the Choice between Cash
and Lines of Credit”, Journal of Finance, Vol. 58, pp. 2059-2116
 Altissimo F., Marchetti D.J., Oneto G.P. (2000), “The Italian business cycle: coincident and
leading indicators and some stylized facts”, Bank of Italy Working Paper 377
 Banca d’Italia (1981), Considerazioni finali del Governatore sul 1980, pag. 18
 Banca d’Italia (1985), Considerazioni finali del Governatore sul 1984, pag. 18
 Bank of Italy (2018), Annual Report for 2017
 Begenau J., Salomao J. (2018), “Firm Financing over the Business Cycle”, The Review of
Financial Studies, vol. 32, no. 4, pp. 1235–1274
 Covas F., Den Haan W. J. (2011), “The Cyclical Behavior of Debt and Equity Finance”, American
Economic Review, vol. 101, no. 2, pp. 877-99
 Crouzet N., Mehrotra N. R. (2018), “Small and Large Firms Over the Business Cycle”, mimeo
 DeAngelo H., Gonçalves A. S., Stulz R. M. (2018), “Corporate Deleveraging and Financial
Flexibility”, The Review of Financial Studies, v. 31, n. 8, pp. 3122–3174
 Dinlersoz E., Kalemli-Ozcan S., Hyatt H., Penciakova V. (2018), “Leverage over the Life Cycle
and Implications for Firm Growth and Shock Responsiveness”, NBER Working Paper No. 25226
 Dottori D., Micucci G. (2018), “Corporate liquidity in Italy and its increase in the long recession”,
Bank of Italy Occasional Paper 420
 Eramo G., Felici R., Finaldi Russo P., Signoretti F. M. (2018), “How slow is the recovery of loans
to firms in Italy?”, Bank of Italy Occasional Paper 469
 Farre-Mensa J., Ljungqvist A. (2016), “Do Measures of Financial Constraints Measure Financial
Constraints?”, The Review of Financial Studies, v. 29, n. 8, pp. 271–308
 Istat (2011), Rapporto annuale: La situazione del paese nel 2010
 Frank, M. Z., Goyal, V. K. (2009), “Profits and Capital Structure”, AFA 2009 San Francisco
Meetings Paper
 Karabounis M., Macnamara P., McCord R. (2014), “A Business Cycle Analysis of Debt and
Equity Financing”, Economic Quarterly, vol. 100, n. 1, pp. 51-85
 Jermann U., Quadrini V. (2012), “Macroeconomic effects of financial shocks”, American
Economic Review, vol. 102, pp. 238–271
 Murray Z. F., Shen T. (2019), “Corporate Capital Structure Actions”, Journal of Banking and
Finance, vol. 196, pp. 384-402
 Sufi, A. (2009), “Bank lines of credit in corporate finance: An empirical analysis”, Review of
Financial Studies, Vol. 22, pp. 1057-1088
Varetto F. (2005), “Vent’anni di bilanci dell’industria italiana”, Global competition, vol. 1, pp. 27-32

 23
Appendix
Appendix A1 – The construction of the dataset starting from Centrale dei Bilanci
 Centrale dei Bilanci (CeBi) includes detailed accounting information of Italian limited liability
companies, starting from 1982. A more comprehensive database on balance sheet data of Italian
companies is Cerved, which is however available only from 1993, thus without full information about
the bust of the early Nineties.
 The dataset used in this paper starts from CeBi data and includes two main filters. First, firms have
to be active, meaning that their turnover and assets has to be strictly positive. The second filter is
related to leverage, equal to the ratio between financial debt (bonds, bank loans and other loans, also
from shareholders) and its sum with equity: the dataset includes only firms whose financial debt is
clearly identified and whose leverage is not negative.13
 The evolution over time of the number of firms by the main sectors of economic activity is reported
in Figure A1. There are three main changes. First, an increase between 1993-4, which is possibly due
to the introduction of Cerved. Second, another increase in 2002 (which is even larger in Cerved) and
it is possibly due to the larger number of firms whose financial debts are clearly identified. Third, a
decrease in 2013, which reflects a lower number of active firms and a possible lower reliance of the
financial system on CeBi data. Nearly all firms belong to the manufacturing or the service sector.

 Figure A1 - Number of firms by economic activity in CeBi

13
 A firm could have zero financial debt in CeBi and Cerved due to missing information. Such companies are included in
the dataset with zero financial debt only in two cases: a) if they compile an ordinary balance sheet (Bilancio ordinario);
b) if they report a simplified balance sheet (Bilancio semplificato) which includes information on trade and tributary
debts. Finally, the condition on negative leverage implies that very distressed firms (those with negative equity whose
absolute value is larger than debt) are excluded; on average these companies represent around 1.5 per cent of total assets.

 24
You can also read