Quasi-tropical cyclone caused anomalous autumn coccolithophore bloom in the Black Sea
←
→
Page content transcription
If your browser does not render page correctly, please read the page content below
Biogeosciences, 18, 3173–3188, 2021
https://doi.org/10.5194/bg-18-3173-2021
© Author(s) 2021. This work is distributed under
the Creative Commons Attribution 4.0 License.

Quasi-tropical cyclone caused anomalous autumn
coccolithophore bloom in the Black Sea
Sergey V. Stanichny, Elena A. Kubryakova, and Arseny A. Kubryakov
Marine Hydrophysical Institute, Russian Academy of Sciences, Sevastopol, Russian Federation

Correspondence: Elena A. Kubryakova (elena_kubryakova@mail.ru)

Received: 9 May 2020 – Discussion started: 18 May 2020
Revised: 30 March 2021 – Accepted: 8 April 2021 – Published: 26 May 2021

Abstract. A quasi-tropical cyclone (QTC) observed over the        2006; Morozov et al., 2015; Tsuchiya et al., 2013). An impor-
Black Sea on 25–29 September 2005 caused an exception-            tant tracer of such changes is the chlorophyll a concentration
ally strong anomalous autumn coccolithophore bloom that           (Chl), which can be determined from satellite measurements.
lasted for more than 1.5 months. The QTC induced intense          Intense nutrient entrainment leads to the rapid rise in Chl,
upwelling, causing a decrease in sea surface temperature of       which can be observed several months after the action of the
15 ◦ C and an acceleration of the cyclonic Rim Current up to      storm in various ocean areas (for example, Shi et al., 2007;
extreme values of 0.75 m s−1 . The Rim Current transported        Wu et al., 2008), including the Black Sea (Kubryakov et al.,
nutrient-rich Danube plume waters from the northwestern           2019c). In some cases, the action of atmospheric cyclones
shelf to the zone of the cyclone action. Baroclinic instabili-    causes the growth of specific groups of phytoplankton. For
ties of the plume boundary caused intense submesoscale pro-       example, Zhu et al. (2014) showed that the storm action in
cesses, accompanied by mixing of the shelf and upwelling          Lake Taihu led to the intensive growth of potentially toxic
of the waters. These processes triggered the initial growth       cyanobacteria.
of remote sensing reflectance (Rrs ) on the offshore front of        At the same time, there is almost no information on the im-
the plume, indicating the beginning of the coccolithophore        pact of atmospheric cyclones on the development of coccol-
bloom. Furthermore, the bloom shifted to the zone of the          ithophores. Coccolithophores are one of the dominant phyto-
strongest upwelling in the western cyclonic gyre. Intense         plankton groups in the ocean. Their specific feature is the
vertical entrainment of nutrients in this area caused the in-     ability to form calcified plates – coccoliths – which play
crease in chlorophyll a concentration (Chl), which was then       a significant role in the ocean carbon pump (Balch et al.,
followed by a strong bloom of coccolithophores. Advection         2011; Rigual Hernández et al., 2018, 2020; Krumhardt et
by the Rim Current spread the bloom over the entire south-        al., 2017; Rost and Riebesell, 2004) and the formation of
ern part of the Black Sea, more than 1000 km from its ini-        calcareous sediment layers (Coolen, 2011; Hay et al., 1990;
tial source. A month after the QTC action, Rrs in these areas     Honjo, 1976). Coccolithophores cause significant light scat-
reached a value of 0.018 sr−1 , corresponding to an estimate      tering and increase the reflectance of the water, which makes
of a coccolithophore concentration of 107 cells per liter.        it possible to study them using satellite data (Balch et al.,
                                                                  1996; Cokacar et al., 2001, 2004; Holligan et al., 1983; Hop-
                                                                  kins et al., 2015; Krumhardt et al., 2017; Moore et al., 2012;
                                                                  Shutler et al., 2013).
1   Introduction                                                     Of the strongest coccolithophore blooms in the world
                                                                  ocean, one is observed in the Black Sea (Tyrell and Merico,
Vertical mixing and upwelling caused by the action of tropi-      2004) in the early summer period (May–June; Cokacar et
cal cyclones uplift nutrients to the euphotic layer and induce    al., 2001, 2004; Mikaelyan et al., 2005, 2011, 2015; Kopele-
intense, sporadic phytoplankton blooms in the world ocean         vich et al., 2014). Coccoliths protect cells from photoin-
(for example, Babin et al., 2004; Chacko, 2017; Han et al.,       hibition, giving them an advantage that enables them to
2012; Kubryakov et al., 2019c; Lin et al., 2003; Miller et al.,

Published by Copernicus Publications on behalf of the European Geosciences Union.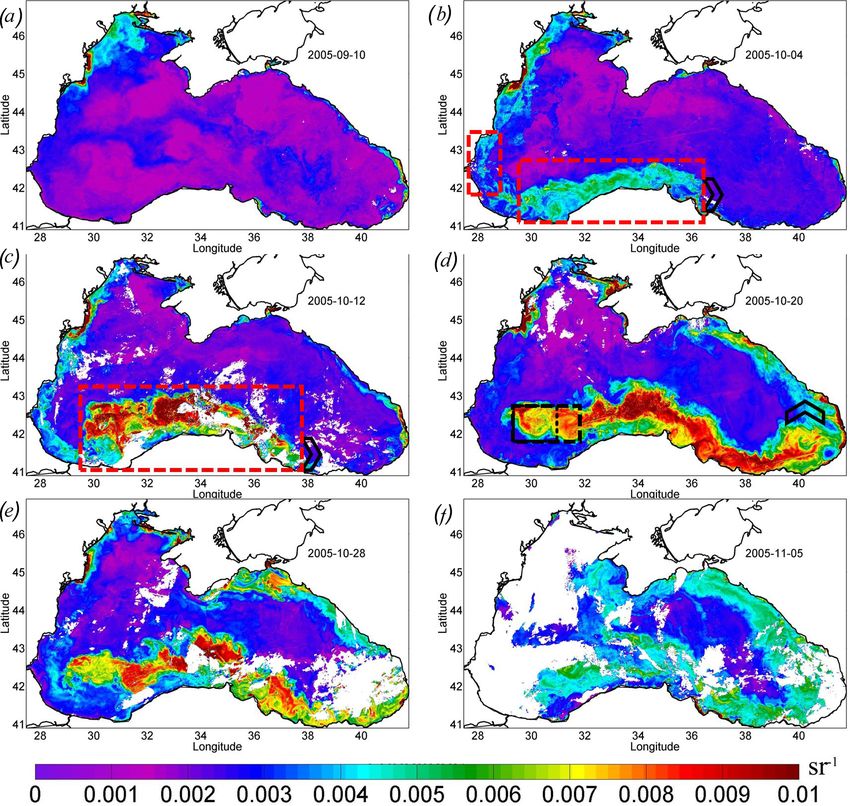
3174                       S. V. Stanichny et al.: Quasi-tropical cyclone caused anomalous autumn coccolithophore bloom

grow in summer during high insolation and at a low mixed             of 1 d, were used. High Rrs values are caused by increased
layer depth (Tyrell and Merico, 2004). Usually, the cell con-        backscattering on particles. In the deep part of the Black Sea,
centration (N ) during summer blooms in the Black Sea is             the rapid growth of Rrs is mainly caused by scattering on
∼ 2–6 × 10⁶ cells per liter (Mikaelyan et al., 2005, 2011,           coccoliths during the coccolithophore bloom (Cokacar et al.,
2015; Pautova et al., 2007), but in certain years, it can            2001, 2004; Kopelevich et al., 2014). Another strong source
reach very high values, where N = 10–30 × 106 cells per              of backscattering and the reflectance increase in the enclosed
liter (Korchemkina et al., 2014; Mihnea, 1997; Yasakova              Black Sea is lithogenic particles originating from river dis-
and Stanichny, 2012). Weaker blooms are detected in the              charge due to coastal erosion from the resuspension of bot-
winter period (Hay et al., 1990; Kubryakov et al., 2019c,            tom sediments. These processes mainly occur in the shelf
2021; Mikaelyan et al., 2020; Sorokin, 1983; Stelmakh                area of the basin (see more details in Sect. 3.3).
et al., 2009; Stelmakh, 2013; Sukhanova, 1995; Türkoğlu,               In the areas of coccolithophore bloom, their cell concen-
2010; Yasakova et al., 2017). Recent biogeochemical Argo             tration (N , cells per liter) can be estimated on the basis of
(BGC-ARGO; Kubryakov et al., 2019c) and satellite studies            backscattering or Rrs data (see Gordon and Balch, 1999). In
(Kubryakova et al., 2021) showed that winter blooms usu-             this paper, we use the following equation:
ally start in December, with a peak in January, and are ob-
served almost every year. N is usually lower in winter than          N = 0.8 × 10⁹ × bbp (700)1.21 ,                              (1)
in summer (N = 0.5–2 × 10⁶ cells per liter; Kubryakov et al.,
2019c; Stelmakh et al., 2009; Stelmakh, 2013).                       and the linear relationship between Rrs (555) and backscatter-
   In autumn 2005, satellite data detected a very strong bloom       ing coefficient (bbp , m−1 ) bbp (700) – Rrs = 0.7 × bbp (700) –
of coccolithophores, anomalous both by its intensity and tim-        to give an estimate of the coccolithophores concentration on
ing. This bloom was observed after an action of a very intense       the basis of satellite data. It should be noted that this formula
quasi-tropical cyclone (QTC) observed over the Black Sea in          is very approximate and gives only rough estimates of N.
September 2005 (Efimov et al., 2008; Yarovaya et al., 2008).         The backscattering during coccolithophore bloom represents
Tropical cyclones (or typhoons) are usually originated at lat-       a mixture of the signals from the plated coccolithophores
itudes less than 30◦ (see the review in Emanuel, 2003). How-         and detached coccoliths. The number of coccoliths per cell
ever, an anomalous atmospheric cyclone that formed over              can vary strongly. In this paper, we use an average value
the Black Sea basin at 40◦ E on 25–29 September (Fig. 1a)            of 30 coccoliths per cell. However, this value can change
had all the characteristic features of the tropical cyclones. It     from 10 (Balch et al., 1991) to more than 50 (Mikaelyan et
had spiral cloud bands, a warm core, a pronounced eye of             al., 2005). In the coastal areas, Rrs represents the mixture
the cyclone, and high wind velocity reaching 25 m s−1 (Efi-          of signals from riverine particles and coccoliths (Kopelevich
mov et al., 2007, 2008). Similar cyclones were documented            et al., 2014). These signals can be separated using a two-
(albeit rarely) in the Mediterranean Sea (Pytharoulis et al.,        parametric model (Kopelevich et al., 2014), which is based
1995; Homar et al., 2003) but never before over the Black            on the data on the absorption coefficient of yellow substance
Sea. Later, a detailed statistical study of the characteristics of   (ag ) and Rrs . In our study, we used a more simple approach
the atmospheric cyclones over the Black Sea (Efimov et al.,          (Eq. 1) to give only approximate estimates of the maximum
2009) showed that cyclones with such large intensity were            observed N and the area of a bloom. The phytoplankton
detected over the Black Sea only three times during a 30-            bloom is usually subjectively defined as the conditions when
year period. A unique characteristic of the QTC in September         N exceeds 106 cells per liter. According to Eq. (1), it corre-
2005 was its quasi-stationarity. It acted on the Black Sea for       sponds to the value of Rrs = 0.005 sr−1 . The area of the coc-
more than 4 d, which led to significant changes in the Black         colithophore bloom was estimated as a total area, with values
Sea dynamics and ecosystem.                                          of Rrs ≥ 0.005 sr−1 . To exclude the impact of lithogenic par-
   This paper documents, for the first time, the impact of such      ticles on the shelf, we used only pixels located in the deep
an anomalous quasi-tropical atmospheric cyclone on the de-           part of the basin (depths of more than 500 m).
velopment and evolution of autumn coccolithophore bloom                 We used the daily level 2B array of QuikSCAT wind
in the Black Sea on the basis of satellite optical, infrared,        data provided on a nonuniform grid within the swath at
and altimetric data.                                                 12.5 km pixel resolution for September–November 2005.
                                                                     Data were downloaded from https://podaac.jpl.nasa.gov/
                                                                     dataset/QSCAT_LEVEL_2B_OWV_COMP_12 (last access:
                                                                                                                                −→
2   Data and methods                                                 11 May 2021). The Ekman pumping was defined as Wek =
                                                                       1                                     −3 is the water density,
                                                                     ρw ·f rot(τ ), where ρw = 1000 kg m
For the analysis of the coccolithophore bloom in the Black           τ = cd ρa ·|v|·v is the wind stress, cd = 1.3 × 10⁻³ is the drag
Sea, level 2 MODIS (Moderate Resolution Imaging Spectro-             coefficient, ρa = 1.3 kg m−3 is the air density, and v is the
radiometer) Aqua daily maps of remote sensing reflectance            wind velocity.
at a wavelength of 555 nm (Rrs ) and Chl for September–                 A regional data set on altimetry-derived daily
November 2005, with a spatial resolution of 1 km and a time          mapped sea level anomalies with 1/8◦ resolu-

Biogeosciences, 18, 3173–3188, 2021                                                     https://doi.org/10.5194/bg-18-3173-2021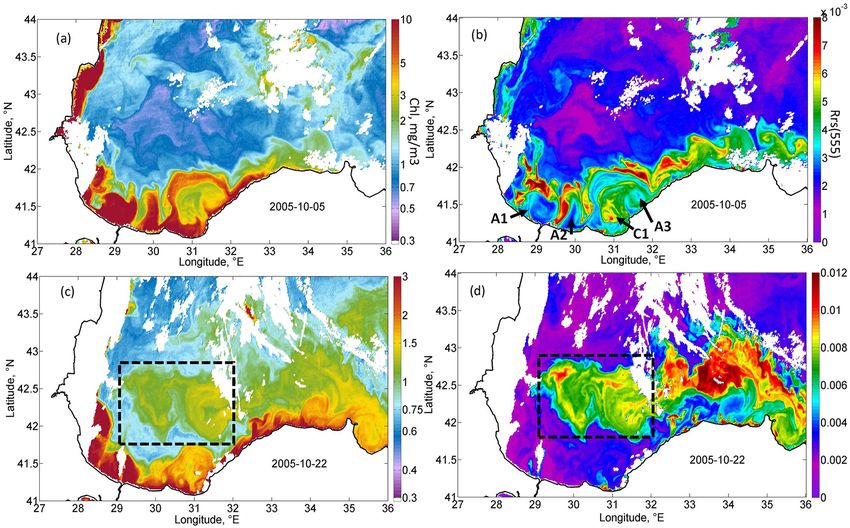
S. V. Stanichny et al.: Quasi-tropical cyclone caused anomalous autumn coccolithophore bloom                                 3175

tion produced by Aviso+. The satellite altimeter                  which was 13–15 ◦ C lower than the surrounding water SST
data (product identifier: SEALEVEL_BS_PHY_L4_                     (23–25 ◦ C). In the Black Sea, the isotherm 10 ◦ C in Septem-
REP_OBSERVATIONS_008_042) is made freely available                ber is located under the seasonal thermocline at depths of 30–
by the Copernicus Marine Environmental Monitoring                 40 m. Thus, the action of the QTC led to the rise of isopyc-
Service     (https://resources.marine.copernicus.eu/?option=      nic surfaces by 30–40 m and the outcropping of deep isopyc-
com_csw&view=details&product_id=SEALEVEL_BS_                      nal layers into the sea surface. Taking into account the active
PHY_L4_REP_OBSERVATIONS_008_042, last access:                     thermal mixing of waters due to the action of the cyclone and
11 May 2021). Mapped sea level anomalies were added to            intense solar heating in this period of the year, it can be as-
the mean dynamic topography (Kubryakov and Stanichny,             sumed that the waters were uplifted from even larger depths.
2011) to compute surface geostrophic velocities in the               The Black Sea nutricline is relatively shallow, and its up-
sea. The obtained data set was validated by Kubryakov et          per border is located at a depth of 50–60 m (Konovalov and
al. (2016) with drifters and hydrological data. The analysis      Murray, 2001; Tuğrul et al., 2015). The euphotic zone in the
of the sea surface temperature (SST) was carried out using        Black Sea in September is about 40–50 m (Kubryakov et al.,
measurements of AVHRR (Advanced Very High-Resolution              2020). Thus, the impact of QTC caused an uplift of the nu-
Radiometer) radiometers with a spatial resolution of 1 km.        tricline from 30–40 m to the euphotic zone, accompanied by
                                                                  its erosion driven by strong wind mechanical mixing.
                                                                     The action of the Ekman transport pushed the waters from
3     Results and discussion                                      the central part of the basin to its periphery, strongly increas-
                                                                  ing the sea level gradients over the Black Sea continental
3.1    Impact of a quasi-tropical cyclone on physical             slope. In particular, the sea level on the western shelf of the
       processes in the Black Sea                                 basin rose by 20 cm from 0.2 to 0.4 cm (Fig. 2a, c). At the
                                                                  same time, in the western central part of the basin, the sea
From 25–29 September 2005, an anomalous intense QTC               level dropped by 20 cm (Fig. 2a, c). The rise in sea level gra-
was observed in the atmosphere over the Black Sea on satel-       dients caused a strong intensification of the large-scale cy-
lite imagery (Fig. 1a). It had a cloud-free eye and distinct      clonic circulation of the Black Sea, i.e., the Rim Current.
spiral cloud bands and was no more than 300 km in diameter.       Its velocity over the continental slope increased, on aver-
Wind velocity in the cyclone reaches 20–25 m s−1 , according      age, twofold from the values of 0.25 to 0.45 m s−1 (Fig. 2b,
to the QuikSCAT satellite data (Fig. 1c). Its development oc-     d). The highest values of geostrophic velocity were recorded
curred after weak wind conditions and was associated with         in the southwestern part of the sea, where they reached ex-
the overheating of the sea surface, which caused increased        tremely high values for the Black Sea, exceeding 0.6 m s−1 ,
moisture fluxes over the western part of the Black Sea. Im-       with a maximum of 0.75 m s−1 (Fig. 2d).
portantly, QTC was observed over the western part of the             The maximum intensity of the geostrophic velocity was
Black Sea for more than 4 d. A detailed analysis of the dy-       observed about 2 weeks after the action of the cyclone on
namics of QTC, and the reasons for its formation, was carried     6–10 October (Fig. 3; black line). This delay is related to
out in Efimov et al. (2007) and Yarovaya et al. (2008).           the time needed for the sea level to adjust to the changes in
   Cyclonic wind vorticity led to Ekman transport directed        Ekman transport. This time, as estimated from altimetry data,
from the QTC and Ekman pumping. Particularly, Ekman               is 1–2 weeks (Grayek et al., 2010; Kubryakov et al., 2016),
pumping on 26 September in the zone of QTC action ex-             which is in close agreement with the time lag observed in
ceeded 4 × 10⁻⁵ m s−1 (Fig. 1d). Efimov et al. (2008) docu-       the present case. As horizontal and vertical circulation are
mented the absolute maximum as reaching 20 × 10−5 m s−1 .         coupled, the same delay would be observed between the time
QTC was situated over the western cyclonic gyre of the Black      of the cyclone action and the maximum upwelling. Thus, we
Sea circulation. The center of the western cyclonic gyre was      might suggest that the vertical entrainment of nutrient-rich
observed in altimetry maps as being an area of a decreased        waters from deep layers also reaches its maximum 2 weeks
sea level reflecting the uplift of isopycnals (Fig. 2a). On av-   after the QTC action.
erage, in the Black Sea, the pycnocline and nutricline in the
centers of the western cyclonic gyre are elevated by 20–30 m      3.2   Impact of quasi-tropical cyclone on Chl
relative to the periphery of the sea (Ivanov and Belokopytov,
2013). Ekman pumping caused additional intense upwelling          Satellite measurements show that such changes in the basin
in this area, which was accompanied by strong wind mechan-        dynamics significantly affected the bio-optical characteris-
ical mixing. As a result, according to the AVHRR radiometer       tics of the Black Sea. Before the passage of the atmospheric
data, on 29 September the SST in the western central part         cyclone, the values of Chl in the central part of the basin were
decreased by more than 10 ◦ C (Fig. 1b), reaching an excep-       relatively low – less than 0.7–0.8 mg m−3 (see Figs. 3, 4).
tionally low value for September of 10 ◦ C. The maximum           High values of Chl exceeding 3 mg m−3 at this time were ob-
cooling was observed in the center of the cyclonic gyre in        served in the northwestern shelf of the basin (red rectangle in
the southwestern part of the sea, where the SST fell to 10 ◦ C,   Fig. 4a). The increase in Chl in this area is related to the dis-

https://doi.org/10.5194/bg-18-3173-2021                                                  Biogeosciences, 18, 3173–3188, 2021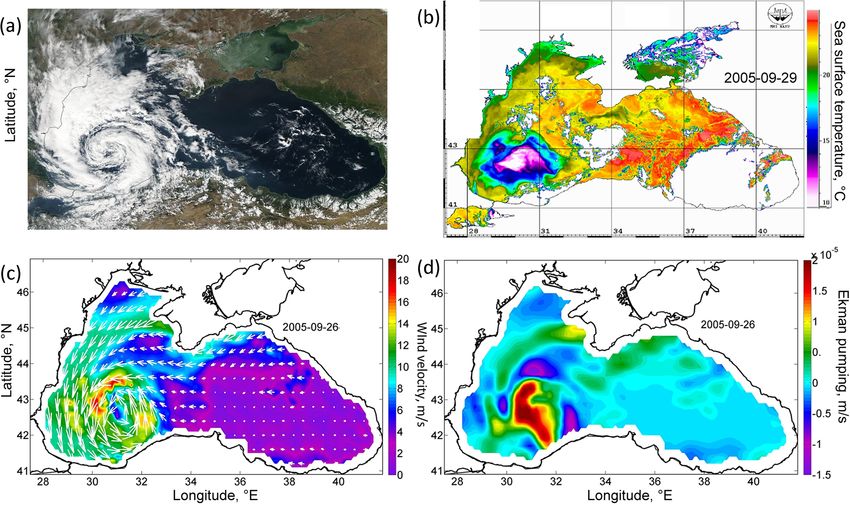
3176                      S. V. Stanichny et al.: Quasi-tropical cyclone caused anomalous autumn coccolithophore bloom

Figure 1. (a) Satellite image of MODIS Aqua in the visible range for 27 September 2005 (data obtained from the Worldview por-
tal). (b) AVHRR SST (in degrees Celsius) for 29 September 2005. (c) Wind velocity (meters per second) of the scatterometer SeaWinds
of the satellite QuikSCAT on 26 September 2005. (d) Ekman pumping velocity (meters per second) on 26 September 2005, calculated from
QuikSCAT data (positive values indicate that the velocity is directed upwards).

charge of several rivers, with the major impact of the Danube          QTC also significantly impacted on the propagation of the
plume (Yankovsky et al., 2004; Karageorgis et al., 2014). It        Danube plume waters. The intensified Rim Current trans-
should be noted that the Danube plume and shelf waters of           ported the plume in the cyclonic direction from the south-
the Black Sea correspond to turbid case 2 waters. The deter-        western part to the southern central coast (marked with the
mination of the Chl in case 2 waters is a difficult task, and       black arrow in Fig. 4b). On 5 October (Fig. 4b), the zone
it is likely overestimated mainly due to the presence of col-       with high Chl (> 3 mg m−3 ) reached 34◦ E. At this time, this
ored dissolved organic matter. Therefore, for the description       zone looked like an alongshore band of high Chl values, with
of the time variability of Chl in Fig. 3, we used only data         about 50 km width extending from the Danube mouth to the
in the central part of the basin. At the same time, increased       southern central coast of the Black Sea. Similar action from
values of Chl can be successfully used as a tracer of plume         the Rim Current transport on the transfer of Danube plume to
waters (see, for example, Sur et al., 1994, 1996; Kubryakov         the southern part of the basin was documented in several pre-
et al., 2018). At the beginning of September 2005, Danube           vious studies (see, e.g., Özsoy and Ünlüata, 1997; Yankovsky
waters with high satellite Chl occupied the northwestern part       et al., 2004; Kubryakov et al., 2018).
of the basin. The southern border of the plume was located             Significant intensification of the Rim Current in the south-
in the southwestern part of the basin near 42◦ N.                   western Black Sea, up to extreme values of 0.75 m s−1 ,
    Immediately after the action of QTC in late September,          caused its baroclinic instability related to strong horizontal
Chl increased significantly in the western central part of the      shear. The offshore boundary of the front of the turbid wa-
sea (red ellipse in Fig. 4b). Here, on 4 October, Chl reached       ters was characterized by several mesoscale features, i.e., ed-
relatively high values (1.3 mg m−3 ; green line in Fig. 3).         dies and filaments (see magnified MODIS map in Fig. 5a).
However, in the next MODIS 8 d map (Fig. 4c), Chl in this           These processes intensified the horizontal exchange in this
zone decreased to the prestorm values. A possible reason for        part of the basin. As a result, on 12 October 2005, the area
such rise in Chl is the entrainment of phytoplankton from           of the high Chl values in the southeastern part of the sea
its summer subsurface maximum, which causes its rapid, but          significantly widened and reached a width of 100–150 km
short-term, increase in the surface layers (Babin et al., 2004;     (red dashed rectangle in Fig. 4c). The difference between the
Kubryakov et al., 2019c).                                           Chl maps in Fig. 4b and c shows that, near the coast (in the

Biogeosciences, 18, 3173–3188, 2021                                                    https://doi.org/10.5194/bg-18-3173-2021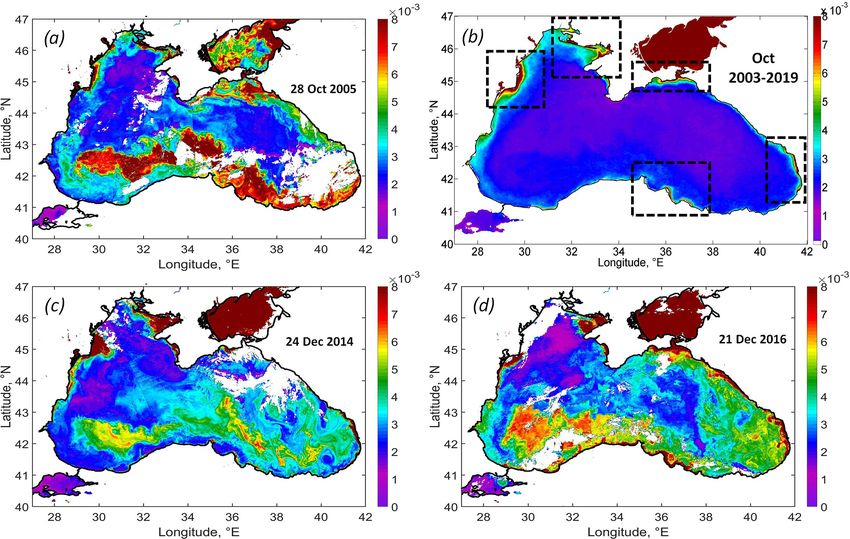
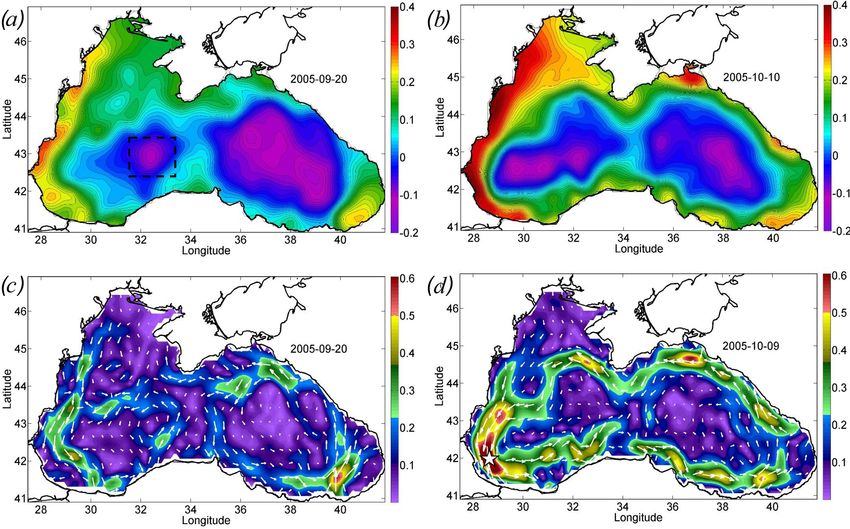
S. V. Stanichny et al.: Quasi-tropical cyclone caused anomalous autumn coccolithophore bloom                                              3177

Figure 2. Altimetry-derived map of sea level and geostrophic velocity before (a, c) and after (b, d) the action of the cyclone. Sea level
(meters) on (a) 20 September 2005 and (b) 10 October 2005. Geostrophic velocity (meters per second) on (c) 20 September 2005 and
(d) 9 October 2005. The black rectangle in panel (a) shows the position of the western cyclonic gyre. Velocity magnitude (c, d) is shown by
color scale.

Figure 3. Temporal evolution of SST (degrees Celsius; blue line), Rrs (per steradian; purple line), and Chl (milligrams per cubic meter; green
line) averaged in the western central part of the basin (see black rectangles in Fig. 5c, d), which is the area of coccolithophore bloom (square
kilometers; red line) as computed only. Geostrophic velocity (meters per second; black dashed line) over the Black Sea continental slope is
shown at the point 41.9375◦ N and 28.4375◦ E; see the white star in Fig. 2d.

area of the red dashed rectangle), Chl decreased, while it in-            later, during 16–24 October, this wide zone of increased Chl
creased to the north. It evidences the dilution of the plume              (Chl > 1.5 mg m−3 ) disappeared, and the width of the plume
due to its horizontal mixing with offshore waters with rel-               decreased significantly (see Fig. 4d).
atively low values of Chl (Chl < 0.75 mg m−3 ). Such a dis-                  At this time, high values of Chl appeared in the western
tribution indicates that a significant part of the brackish and           central part of the sea (Figs. 4d, 5c). The highest values of
nutrient-rich plume water moved across the isobaths and pen-              Chl (black circle in Fig. 4d; black rectangle in Fig. 5c) were
etrated in the southwestern central part of the sea. A week               located in the area of maximum upwelling in the western cy-

https://doi.org/10.5194/bg-18-3173-2021                                                             Biogeosciences, 18, 3173–3188, 2021
3178 S. V. Stanichny et al.: Quasi-tropical cyclone caused anomalous autumn coccolithophore bloom
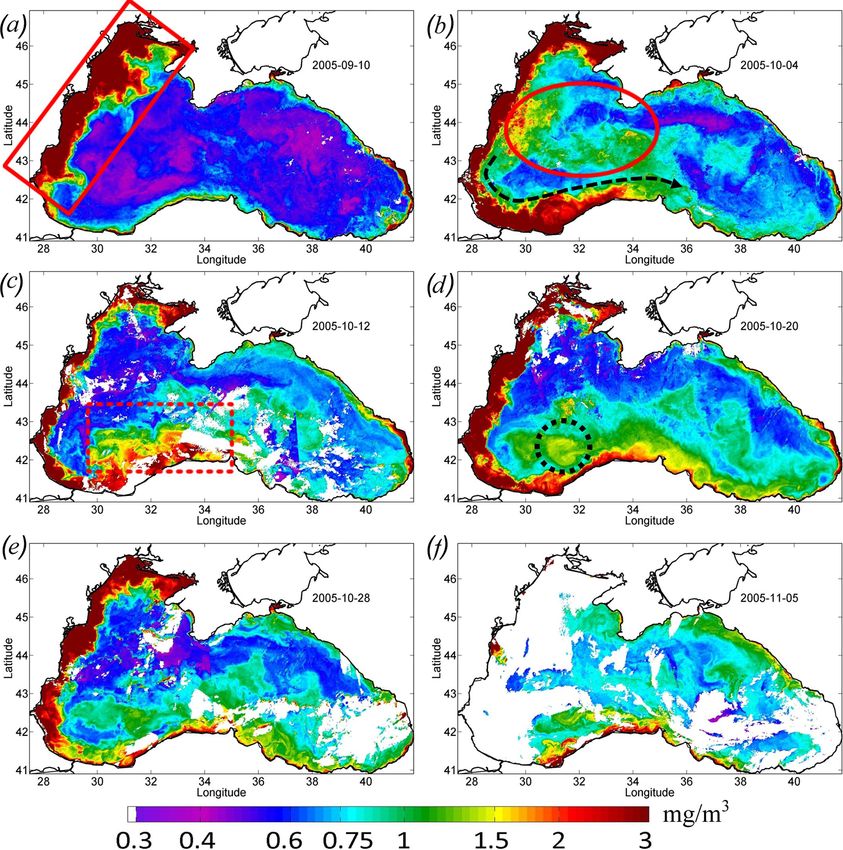
Figure 4. Maps of Chl concentration, in milligrams per cubic meter, over 8 d. (a) 10 September 2005 – the red rectangle (solid line) shows
the position of the Danube plume. (b) 4 October 2005 – the red oval shows the zone of the rapid increase in Chl in the western central part of
the basin. (c) 12 October 2005 – the red dashed rectangle shows the position of the cross-shelf mixing area. (d) 20 October 2005 – the black
dashed circle shows the maximum Chl in the western cyclonic gyre. (e) 28 October 2005. (f) 5 November 2005.
clonic gyre, corresponding to the zone of minimal SST in 3.3 Impact of quasi-tropical cyclone on
Fig. 1b. Furthermore, waters with high Chl values were trans- coccolithophores bloom
ported from this area by an intense Rim Current to the east.
As a result, the region with high values of the Chl extended The strongest impact of the cyclone was observed in the
eastward along the continental slope up to the eastern coast of field of Rrs . An exceptionally high rise in Rrs was observed
the basin to 41.5◦ E (Fig. 4d, e). In these areas, Chl increased in the western cyclonic gyre and southern deep part of the
to a value of 1–1.3 mg m−3 , which was 2 times higher than basin (Fig. 6a). The comparison of the Rrs map on 28 Octo-
in early September (Fig. 4d). At the end of October, Chl in ber 2005 with the climatic-averaged map for October 2003–
the areas affected by the QTC began to decrease. It fell about 2019 (Fig. 6a, b) demonstrates this anomalous event. Under
twofold to the values of 0.75 mg m−3 (Fig. 4e). normal conditions, Rrs in the Black Sea in October does not
At the beginning of November, Chl in the whole cen- exceed 0.001 sr−1 , except in the area located near Danube
tral part of the Black Sea rose again to 1 mg m−3 (Fig. 4f). mouth, the Kerch Strait, the most coastal area near the Cau-
This rise probably indicates the beginning of the late autumn casian rivers, and shallow northwestern shelf (see black rect-
phytoplankton bloom, which is associated with the deepen- angles in Fig. 6b). These areas are the source of lithogenic
ing of a mixed layer to the upper border of the nutricline particles in the Black Sea caused by the riverine or Sea of
(Mikaelyan et al., 2018; Kubryakov et al., 2020). Azov inflow, resuspension of bottom sediments, and coastal
erosion (see Constantin et al., 2017; Aleskerovà et al., 2017,
2019; Kubryakov et al., 2019a).
Biogeosciences, 18, 3173–3188, 2021 https://doi.org/10.5194/bg-18-3173-2021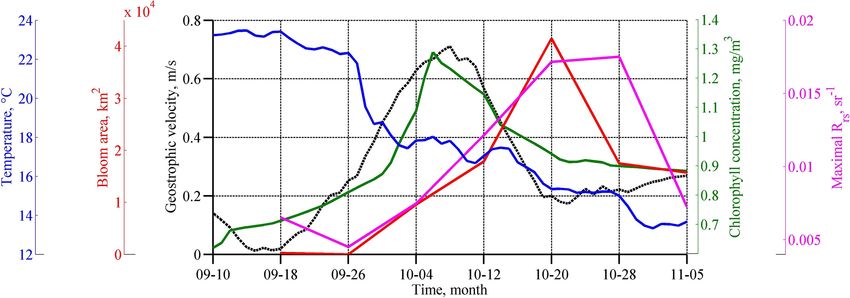
S. V. Stanichny et al.: Quasi-tropical cyclone caused anomalous autumn coccolithophore bloom                                          3179

Figure 5. Magnified daily MODIS maps demonstrating the two stages of coccolithophore blooms development. MODIS daily map of
Chl (a) and Rrs (b) on 5 October 2005, demonstrating the initial rise in Rrs on the offshore periphery of the Danube plume. MODIS daily
map of Chl (c) and Rrs (d) on 22 October 2005, demonstrating the rise in Rrs in the western gyre of the Black Sea (black dashed rectangles).

   A significantly different spatial distribution of Rrs was ob-        concentration of particles that cause backscattering. The ex-
served after the action of QTC. Rrs was highest – not near              ception was the shallow northwestern shelf affected by the
the coast or river mouths but in the deep western part of               discharge of the major rivers.
the basin, with depths of more than 1500 m over the south-                 In the western central part, Rrs was low until the action of
ern continental slope. In this area, Rrs reached more than              the QTC (see the purple line in Fig. 3). At the beginning of
0.010 sr−1 , which is 10 times higher than the climatological           October 2005, the rise in Rrs was first observed in the south-
values.                                                                 western part of the sea (red rectangles in Fig. 7b). In this
   In the southern part of the basin, there are several small           place, it increased to the values of 5–6 × 10⁻³ sr−1 , corre-
rivers, but their plumes usually do not extend more than                sponding to the level of the coccolithophore bloom. The ini-
10 km from their mouths (Kostianoy et al., 2019). In the con-           tial rise in Rrs was detected in a limited area located over the
sidered cases (Fig. 6a), the width of high Rrs values near              southern continental slope of the basin to the south and west
the southern part of the basin was about 100 km. They were              of the area of the QTC action. This increase was only ob-
not located near a specific river mouth but extended over the           served on the shelf and/or slope boundary in the intermediate
whole periphery of the basin.                                           zone between the shelf and the central part (see red rectan-
   Therefore, the observed rise in Rrs should have a biolog-            gles in Fig. 7b).
ical origin. In the Black Sea, such a rise in Rrs is often ob-             A detailed daily map of Rrs for 5 October 2005 (Fig. 5b)
served during coccolithophore blooms (Cokacar et al., 2001).            shows that the maximum Rrs was observed in the thin zone
The above arguments suggest that, in the presented case, we             on the offshore periphery of the Danube plume. At the same
observe unusual coccolithophore blooms in October in the                time, near the coast and in the western central part in the
Black Sea.                                                              epicenter of QTC action, high values of Rrs were absent at
   The detailed evolution of Rrs in September–October 2005              this time. This frontal zone is a subject of the intense hori-
is demonstrated in Fig. 7. Before the passage of the atmo-              zontal mixing between brackish, nutrient-rich plume waters
spheric cyclone, Rrs in the Black Sea was less than 0.004 sr−1          and the saline waters of the central part, which may be one
(Fig. 7a). This value is typical for this season and indicates          of the possible triggers of the phytoplankton bloom. High
that the surface layer of the sea’s central part contains a low         Rrs values were located mainly in the frontal instabilities that

https://doi.org/10.5194/bg-18-3173-2021                                                          Biogeosciences, 18, 3173–3188, 2021
3180                       S. V. Stanichny et al.: Quasi-tropical cyclone caused anomalous autumn coccolithophore bloom

Figure 6. (a) MODIS Rrs map on 28 October 2005, showing the intense coccolithophore bloom developed after the action of the QTC.
(b) Climatic Rrs map for October 2003–2019 (black rectangles show the main sources of the lithogenous articles in the Black Sea), similar
to the case of the October 2005 coccolithophore blooms observed in the maps of Rrs on 24 December 2014 (c) and 21 December 2016 (d).

formed on the boundary of the plume. Such instabilities were              A week later, during 8–15 October, Rrs rapidly increased
possibly formed due to the impact of strong horizontal shear           (Fig. 7c) and the bloom area doubled (Fig. 3; red line). We
on the periphery of the intensified Rim Current. Mixing be-            note that the bloom area was estimated using only pixels
tween the plume and saline waters additionally intensified             in the deep part of the basin (depth of more than 500 m)
buoyancy gradients and baroclinic submesoscale instabilities           to exclude the impact of the lithogenic particles. The max-
observed in Fig. 5a and b. Submesoscale motions can in-                imum Rrs increased to 0.012 sr−1 , which corresponded to
duce very strong vertical velocities, reaching more than 10–           N = 5.8 × 10⁶ cells per liter. The area of the most intense
100 cm s−1 (Mahadevan, 2016), which can provide intense                bloom was observed over the continental slope south of the
upward nutrient fluxes. In the center of anticyclones (see, for        western gyre and the regions to the west of it (see the red
example, anticyclones A1 and A2 in Fig. 5b), where verti-              rectangle in Fig. 7c). This distribution was very similar to
cal motions were directed downward, Rrs was low. At the                the one observed in Chl (Fig. 4c, d).
same time, on their periphery, where vertical velocities are              In the next week (from 16 to 23 October), the bloom posi-
directed upward, a strong rise in Rrs was observed. Another            tion shifted from the coast offshore to the center of the west-
prominent feature in Fig. 5b is the mushroom structure con-            ern gyre (Figs. 5d, 7d). The position of this gyre can be ob-
sisting of cyclone C1 and anticyclone A3. The cyclonic part            served as an area of decreased SST (Fig. 1b) and low sea level
of this structure had significantly higher Rrs than its anticy-        (Fig. 2b) in satellite measurements. This area corresponded
clonic part. These observations suggest the important impact           to the zone of maximal vertical mixing and intense vertical
of submesoscale vertical fluxes in cyclonic structures on the          entrainment of nutrients from deep isopycnals layers. Here,
initial rise in Rrs . Analysis of MODIS daily maps showed              a stable bloom area with a diameter of about 100 km devel-
that, in this area from 5 to 7 October 2005, the Rrs valued al-        oped (see black rectangles in Figs. 5d, 7d). At the same time,
most doubled. At the same time, Rrs was lower near the coast,          Rrs values in the southeastern coastal zone decreased to the
which indicates that its rise was not related to the lithogenic        background values.
particles caused by river discharge or storm-driven coastal               Furthermore, the advection by the Rim Current transported
erosion.                                                               both raised nutrients and already formed phytoplankton cells
                                                                       from the western central gyre to the east. The region of high

Biogeosciences, 18, 3173–3188, 2021                                                       https://doi.org/10.5194/bg-18-3173-2021
S. V. Stanichny et al.: Quasi-tropical cyclone caused anomalous autumn coccolithophore bloom 3181 Figure 7. Maps of remote sensing reflectance Rrs , per steradian, over 8 d. (a) 10 September 2005. (b) 4 October 2005 – the red rectangles show the area of the initial start of the bloom. (c) 12 October 2005 – the red rectangle shows a mixing area. (d) 20 October 2005 – the black rectangle shows the center of the deep bloom in the western cyclonic gyre. (e) 28 October 2005. (f) 5 November 2005. The black arrowhead (b, c, d) shows the position of the eastern boundary of the bloom. values of Rrs extended eastward from this area along the con- decreased SST in this area was observed until the end of Oc- tinental slope to the eastern coast of the basin up to 41.5◦ E tober, indicating the stability of the upwelling. Such a pro- (Fig. 7d, e). The black arrow in Fig. 7 marks the propaga- longed duration of upwelling (2–3 weeks) can be related to tion of the eastward boundary of the plume. At the velocity the (1) delay between the action of Ekman pumping and up- of 0.45 m s−1 (Fig. 2d), the particles should be transported welling and (2) the time needed for the relaxation of the up- 1000 km in 3 weeks. Such transport caused the extension of welling after the wind action. the bloom up to the eastern coast of the Black Sea, which is in The average and maximum values of Rrs reached the high- agreement with satellite optical measurements (Fig. 7e). As a est values 2–3 weeks after the action of the QTC on 20 Oc- result, the total length of the bloom area on 20 October 2005 tober 2005 (Fig. 3; purple line). At this time, in some ar- was more than 1200 km (Fig. 7d). eas of the central Black Sea (e.g., 43◦ E, 34◦ N), Rrs was The western boundary of the bloom was stationary and higher than 0.018 sr−1 , which corresponds to an estimate of located in the center of the western cyclonic gyre (black rect- 9–10 × 106 cells per liter. The bloom area reached a maxi- angle in Fig. 7d). Therefore, the losses of coccolithophore mum of about 40 × 103 km2 (Fig. 3; red line). cells caused by horizontal advection in this local zone were At the end of October, the intensity of coccolithophore probably compensated by their growth due to intense verti- bloom in the western cyclonic cycle weakened (Fig. 7e). cal fluxes of nutrients. It indicates that the upwelling in the During this period, the maximum value of Rrs decreased to center of the western cyclonic gyre was a continuous source 0.007 sr−1 . At the beginning of November, Rrs fell to 0.005– of nutrients for phytoplankton until the end of October, af- 0.006 sr−1 , indicating the termination of the bloom (Fig. 7f). ter which the bloom stretched to the eastern shore. Indeed, The termination occurred at the time of the beginning of the https://doi.org/10.5194/bg-18-3173-2021 Biogeosciences, 18, 3173–3188, 2021
3182                      S. V. Stanichny et al.: Quasi-tropical cyclone caused anomalous autumn coccolithophore bloom

late autumn phytoplankton bloom, reflected in the rise in Chl         There are several possible reasons for such intense coc-
over the whole central part of the basin (Fig. 4f).                colithophore blooms in the observed case. Very intense up-
                                                                   welling and wind mixing caused the entrainment of a huge
                                                                   amount of nutrients from the nutricline. These layers of the
4   Discussion                                                     Black Sea are characterized by a low N/P ratio, which is
                                                                   about 2–6 (Konovalov et al., 2005; Tuğrul et al., 2014). Low
The action of the QTC caused a strong coccolithophore
                                                                   N/P is caused by the intense removal of nitrates through
bloom in October 2005, which lasted for more than
                                                                   a denitrification process in the suboxic layer of the basin
1.5 months and covered the entire southern part of the Black
                                                                   (Konovalov et al., 2008; Tuğrul et al., 2014; Yakushev et
Sea. Analysis of Rrs variability in 2003–2019 showed that
                                                                   al., 2007). Nitrates entrained to the surface are first rapidly
this situation was unique for the early autumn period, when
                                                                   consumed by diatoms, which have a higher growth rate than
Rrs usually is low (< 0.002 sr−1 ; see Fig. 6b). Only in rare
                                                                   coccolithophores (Goldman, 1993). This process caused the
cases – in October 2006 and 2014 – do we observe the in-
                                                                   increase in Chl, which reached its peak 1 week after the QTC
crease in Rrs up to 0.005 sr−1 , which still 2 times lower
                                                                   (Fig. 3). However, as the N/P ratio (2–6) was significantly
than 0.010 sr−1 in 2005. Somewhat similar to October 2005,
                                                                   smaller than the Redfield ratio (16), part of the phosphate
blooms were observed in satellite data in December 2014
                                                                   remained in the upper layer. Due to lower growth rates of
and 2016 (Fig. 6c, d). These figures demonstrate similar spa-
                                                                   coccolithophores, the observed rise in Rrs was more grad-
tial patterns of Rrs extending from the western cyclonic gyre
                                                                   ual. A total of 2–3 weeks after the QTC, Chl decreased to its
over the southern continental slope. Such winter blooms were
                                                                   prestorm values. The decrease in Chl indicates the termina-
also triggered by intense western storms (see Kubryakova
                                                                   tion of the bloom, due to mortality or grazing, and the trans-
et al., 2021) over the western cyclonic gyre. These illustra-
                                                                   formation of nutrients in the organic form. According to Stel-
tions show that the processes discussed in this paper may de-
                                                                   makh et al. (2009), the lysis of the organic matter by small
fine the biological characteristics of the basin in other years.
                                                                   diatoms in the final stage of their bloom promotes the growth
However, in both of these cases, Rrs was smaller than in 2005
                                                                   of Emiliania huxleyi in the Black Sea. Coccolithophores
and usually does not exceed 0.007 (compared to 0.01 sr−1 in
                                                                   can use osmotrophy and utilize dissolved organic nitrogen
2005). Also, such blooms were observed later in winter, in
                                                                   (Balch., 2018; Benner and Passow, 2010; Poulton et al.,
December, which is the month that is characteristic of winter
                                                                   2017). Emiliania huxleyi contain several specific enzymes
coccolithophore blooms (Kubryakova et al., 2021).
                                                                   and proteins, which may switch their diet from inorganic to
   Such an analysis demonstrates that, in October 2005, we
                                                                   organic (Dyhrman and Palenik, 2003). A large amount of the
observed an exceptional situation in the Black Sea, i.e., the
                                                                   remaining phosphates and organic nitrogen caused the maxi-
early autumn bloom of coccolithophores with estimated cell
                                                                   mum development of the coccolithophore blooms 3–4 weeks
concentrations exceeding 10 × 106 cells per liter. This situa-
                                                                   after the QTC. Such a situation is usually observed in the
tion was caused by the action of the anomalous, extremely
                                                                   Black Sea in spring, when the winter convection is followed
strong QTC in September 2005. Unfortunately, currently
                                                                   by the intense spring bloom of diatoms in March, and then,
there is no in situ microscopic information about coccol-
                                                                   by May–June, the coccolithophores bloom (Mikaelyan et al.,
ithophore blooms and, especially, their time evolution after
                                                                   2015; Kubryakov et al., 2019c). The hypothesis explaining
intense atmospheric storms. The results of this study showed
                                                                   the observed diatom–coccolithophore sequence in the Black
that such processes could significantly impact on the taxo-
                                                                   Sea was proposed in Mikaelyan et al. (2015) and is supported
nomic composition of the phytoplankton and deserve a spe-
                                                                   by the in situ chemical and biological data of Mikaelyan et
cialized in situ investigation.
                                                                   al. (2015) and Silkin et al. (2009, 2014).
   The phytoplankton bloom in the autumn–winter period in
                                                                      Long-term analysis of MODIS data in 2003–2019
the Black Sea is related to the vertical entrainment of nutri-
                                                                   (Kubryakova et al., 2021) showed that winter coccol-
ents from their subsurface maximum. Usually, this process
                                                                   ithophore blooms are also often observed 1–2 weeks after
causes a rapid growth of diatoms in November–December
                                                                   intense storm action. According to Kubryakova et al. (2021),
(Sorokin, 1983; Mikaelyan et al., 2017; Silkin et al., 2019;
                                                                   such blooms were especially strong in years with increased
Kubryakov et al., 2020), which have a higher growth rate
                                                                   cross-shelf exchange. A possible reason for such a relation is
than the coccolithophores (Goldman, 1993; Lomas and Glib-
                                                                   the grazing pressure by zooplankton on diatoms. Shelf waters
ert, 1999). Several authors demonstrated the rapid increase
                                                                   of the Black Sea are characterized by a high concentration of
of Chl in the Black Sea after strong storm events in sum-
                                                                   zooplankton, which can exceed its concentrations in the deep
mer (Nezlin, 2006; Kubryakov et al., 2019c) and the autumn
                                                                   part of the basin by 10 times (Kovalev et al., 1999). The graz-
period (Mikaelyan et al., 2017, 2020). However, in October
                                                                   ing pressure on the diatoms or dinoflagellates by zooplankton
2005, we observed another case – the atmospheric cyclone
                                                                   is usually higher than on coccolithophores (Nejstgaard, 1997;
caused only a slight rise in Chl, which was followed by the
                                                                   Stelmakh, 2013), which may give them an advantage during
very strong coccolithophore blooms (see Fig. 3).
                                                                   high concentrations of predators. Stelmakh (2013) showed
                                                                   that, in the Black Sea, grazing in diatom-dominated regions

Biogeosciences, 18, 3173–3188, 2021                                                  https://doi.org/10.5194/bg-18-3173-2021
S. V. Stanichny et al.: Quasi-tropical cyclone caused anomalous autumn coccolithophore bloom 3183 was about 90 %, while in coccolithophore-dominated regions tober 2005, we observed very high surface values of Rrs , it was 3 times lower (30 %), which is in agreement with esti- reaching 0.018 sr−1 , which correspond to the estimated N , mates obtained by Olson and Strom (2002). reaching 10 × 106 cells per liter. The mixed layer in Octo- The largest seasonal peak of zooplankton in the Black ber is usually about 2 times higher than in early summer, Sea is observed in September–October (Kovalev et al., 2003; which suggests that the intensity of the observed autumn coc- Stelmakh, 2013). Therefore, QTC was observed during a colithophore bloom in October 2005 was comparable to the seasonal maximum of zooplankton. QTC caused an intense record blooms detected in the summers of 1993 (Mihnea, cross-shelf exchange (see Fig. 5), which promoted the addi- 1997) and 2012 (Yasakova and Stanichny, 2012). tional penetration of zooplankton from the shelf to the central part of the basin. All of the above processes may suppress the rise in diatoms, despite the strong nutrients fluxes, and may 5 Conclusions give an advantage to coccolithophores. The initial rise in Rrs was observed at the frontal zone The action of the QTC in September 2005 caused an intense separating the brackish, nutrient-rich waters of the Danube bloom of coccolithophore in the Black Sea basin, with the plume and saline waters of the central Black Sea. The ac- satellite-estimated concentration reaching 10 × 106 cells per celeration of the Rim Current up to extreme velocities of liter. Satellite data showed that the bloom was caused by in- 0.75 m s−1 caused an increase in horizontal and vertical tense upwelling driven by Ekman pumping during the action shear. The vertical shear of the Rim Current is one of the of QTC. The upwelling was highest in the western cyclonic important reasons for the rise in the vertical turbulent mixing gyre of the Black Sea, where isopycnals were uplifted to (see Ostrovskii and Zatsepin, 2016; Podymov et al., 2020). the surface. After QTC, SST in this area decreased to 10 ◦ C, The rise in horizontal shear also triggered the formation of which was 10–13 ◦ C lower than surrounding waters, indicat- several submesoscale eddies (see Fig. 5) in the coastal zone ing intense vertical entrainment of nutrients in the euphotic of the Black Sea (Zatsepin et al., 2019). These eddies in- layer. This process led to the increase in Chl, which was fol- tensified the cross-shelf exchange and the horizontal trans- lowed by a strong bloom of coccolithophores. The bloom port of Danube plume waters in the deep part of the basin. was continuously observed in the area of upwelling in the Danube plume waters are rich in organic and inorganic nu- western cyclonic gyre for more than 1.5 months. An intense trients (Saliot et al., 2002; Kondratev et al., 2015, 2019). The cyclonic Rim Current spread the bloom from this permanent mixing zone became the first area in which coccolithophores source of nutrients, and at the end of October, the bloom cov- started to grow up to bloom conditions. The overflow of the ered the entire southern part of the Black Sea. brackish plume in the saline waters additionally increases the The initial growth of coccolithophores after the QTC was baroclinic instabilities (Luo et al., 2016) and intensifies sub- observed in the frontal zone between the central part of the mesoscale motions. Recent studies demonstrated that such Black Sea and the plume of the Danube. Rapid intensifica- processes could cause very intense vertical motions, which tion of the Rim Current after the QTC led to the intense may be an important reason for the rise in the primary pro- cross-shelf mixing of these waters, accompanied by the gen- ductivity on the fronts (Oguz et al., 2015; Mahadevan, 2016). eration of a number of submesoscale instabilities. The initial Such submesoscale vertical fluxes can explain the spatial dis- growth of Rrs was detected in these submesoscale structures tribution of Rrs in Fig. 5a and also help to explain its earlier of cyclonic signs, which indicate that intense vertical mo- rise compared to the central part of the basin. Therefore, a tions in frontal submesoscale cyclones were another impor- cross-frontal mixing may cause the initial growth of coccol- tant source of the nutrients for the coccolithophore blooms ithophores due to the following reasons: (1) vertical fluxes during its initial stage. of nutrients caused by baroclinic submesoscale instabilities, In addition to the aforementioned physical mechanisms, (2) penetration of nutrients or dissolved organics from brack- there were several biological factors underlying the ob- ish plume waters in the deep saline part of the basin, and served phenomenon, including (a) higher grazing pressure on (3) penetration of zooplankton from the shelf, which sup- the other phytoplankton (such as diatoms) by zooplankton, presses the growth of other types of phytoplankton. which has its seasonal maximum in September–October, the The most intense coccolithophore blooms in the Black (b) ability of coccolithophores to use osmotrophy and utilize Sea are observed in May–June. During this period, the organic nitrogen, and a (c) low N/P ratio in the Black Sea nu- cell concentration is usually N = 2–6 × 10⁶ cells per liter tricline, which led to the fast depletion of nitrates for diatoms (Mikaelyan et al., 2011, 2015), which is 2–4 times higher blooms. than in weaker winter blooms (N = 0.5–2 × 10⁶ cells per As described here, extreme atmospheric events can play an liter; Kubryakova et al., 2021). The coccolithophore blooms important role in the observed interannual variability in the usually occupy the upper mixed layer, which is 2–3 times coccolithophores and related carbonate fluxes in many other larger in winter than in summer, which suggests that the to- ocean areas, such as the North Atlantic and the Southern tal cell amount in the water column is similar in the win- Ocean, where storms are significantly more frequent. Such ter and summer period (Kubryakov et al., 2019b). In Oc- coccolithophore blooms may significantly impact the sea- https://doi.org/10.5194/bg-18-3173-2021 Biogeosciences, 18, 3173–3188, 2021
3184                        S. V. Stanichny et al.: Quasi-tropical cyclone caused anomalous autumn coccolithophore bloom

sonal succession of marine phytoplankton. Particularly, they            Financial support. This research has been supported by the Rus-
can trigger the following microbial loop – the transition of            sian Science Foundation (grant no. 20-17-00167), the Russian
trophic energy to small species and subsequent changes in               Foundation for Basic Research (grant nos. 19-05-00752 and 20-35-
the entire trophic structure of the region (Brussaard, 2004;            70034), and the Russian government assignment (grant no. 0555-
Kubryakov et al., 2019b). For a further detailed investiga-             2021-0003).
tion of the response of the phytoplankton community to
short-term physical processes, continuous data on the taxo-
                                                                        Review statement. This paper was edited by Marilaure Grégoire
nomic composition of phytoplankton, based, for example, on
                                                                        and reviewed by three anonymous referees.
the measurements of moored-flow cytometers, are required.
These data are also crucial for the validation of regional satel-
lite algorithms for phytoplankton species detection (Bracher
et al., 2017) and biogeochemical numerical models, which                References
will help to provide more insights into the mechanisms of
the ecosystem response to intense atmospheric forcing.                  Aleskerovà, A. A., Kubryakov, A. A., Goryachkin, Y. N., and
                                                                          Stanichny, S. V.: Propagation of waters from the Kerch
                                                                          Strait in the Black Sea, Physical Oceanography, 6, 47–57,
                                                                          https://doi.org/10.22449/1573-160X-2017-6-47-57, 2017.
Data availability. We acknowledge the use of the (1) Moderate
                                                                        Aleskerovà, A. A., Kubryakov, A. A., Goryachkin, Y. N., Stanichny,
Resolution Imaging Spectroradiometer (MODIS) Aqua Ocean
                                                                          S. V., and Garmashov, A. V.: Suspended-Matter Distribution
Color Data produced by the NASA Goddard Space Flight Center
                                                                          Near the Western Coast of Crimea under the Impact of Strong
(https://doi.org/10.5067/AQUA/MODIS/L2/OC/2018, NASA God-
                                                                          Winds of Various Directions, Izv. Atmos. Ocean. Phy.+, 55,
dard Space Flight Center, 2018). (2) Data Unification and Altimeter
                                                                          1138–1149, https://doi.org/10.1134/S0001433819090044, 2019.
Combination System (DUACS) delayed-time altimeter gridded
                                                                        Babin, S. M., Carton, J. A., Dickey, T. D., and Wiggert, J. D.:
maps of sea level anomalies over the Black Sea (https://resources.
                                                                          Satellite evidence of hurricane-induced phytoplankton blooms
marine.copernicus.eu/?option=com_csw&view=details&product_
                                                                          in an oceanic desert, J. Geophys. Res.-Oceans, 109, C03043,
id=SEALEVEL_BS_PHY_L4_REP_OBSERVATIONS_008_042,
                                                                          https://doi.org/10.1029/2003JC001938, 2004.
Copernicus Climate Change Service, 2021) produced and dis-
                                                                        Balch, W. M.: The ecology, biogeochemistry, and optical prop-
tributed by the Copernicus Climate Change Service. QuikSCAT
                                                                          erties of coccolithophores, Annu. Rev. Mar. Sci., 10, 71–98,
(or SeaWinds) data are produced by remote sensing systems
                                                                          https://doi.org/10.1146/annurev-marine-121916-063319, 2018.
and sponsored by the NASA Ocean Vector Winds Science
                                                                        Balch, W. M., Holligan, P. M., Ackleson, S. G., and Voss, K. J.:
Team and are available at http://www.remss.com/missions/qscat/
                                                                          Biological and optical properties of mesoscale coccolithophore
(Ricciardulli et al., 2011). Advanced Very-High-Resolution
                                                                          blooms in the Gulf of Maine, Limnol. Oceanogr., 36, 629–643,
Radiometer (AVHRR) data were received and reprocessed at the
                                                                          https://doi.org/10.4319/lo.1991.36.4.0629, 1991.
Marine Hydrophysical Institute, Russia, and are available from
                                                                        Balch, W. M., Kilpatrick, K. A., and Trees, C. C.: The 1991 coccol-
http://dvs.net.ru/mp/data/200509bs_sst.shtml (Remote Sensing
                                                                          ithophore bloom in the central North Atlantic, 1. Optical prop-
Department, 2021).
                                                                          erties and factors affecting their distribution, Limnol. Oceanogr.,
                                                                          41, 1669–1683, 1996.
                                                                        Balch, W. M., Drapeau, D. T., Bowler, B. C., Lyczskowski, E.,
Author contributions. SVS and AAK were involved in planning               Booth, E. S., and Alley, D.: The contribution of coccolithophores
and supervising the work. EAK and AAK processed the satellite             to the optical and inorganic carbon budgets during the Southern
data and performed the analysis, EAK drafted the paper and de-            Ocean Gas Exchange Experiment: New evidence in support of
signed the figures. All authors discussed the results and commented       the “Great Calcite Belt” hypothesis, J. Geophys. Res.-Oceans,
on the paper.                                                             116, C00F06, https://doi.org/10.1029/2011JC006941, 2011.
                                                                        Benner, I. and Passow, U.: Utilization of organic nutrients
                                                                          by coccolithophores, Mar. Ecol. Prog. Ser., 404, 21–29,
Competing interests. The authors declare that they have no conflict       https://doi.org/10.3354/meps08474, 2010.
of interest.                                                            Bracher, A., Bouman, H. A., Brewin, R. J., Bricaud, A., Bro-
                                                                          tas, V., Ciotti, A. M., Clementson, L., Devred, E., Cicco, A.D.,
                                                                          Dutkiewicz, S., Hardman-Mountford, N. J., Hickman, A. E., Hi-
Acknowledgements. Data acquisition and processing were made               eronymi, M., Hirata, T., Losa, S. N., Mouw, C. B., Organelli,
possible with the support of the Russian Foundation for Basic Re-         E., Raitsos, D. E., Uitz, J., Vogt, M., and Wolanin A.: Ob-
search (grant no. 19-05-00752). The study of the impact of a tropical     taining phytoplankton diversity from ocean color: a scientific
cyclone on the phytoplankton bloom development was supported              roadmap for future development, Frontiers in Marine Science,
by the Russian Science Foundation (grant no. 20-17-00167). Inves-         4, 55, https://doi.org/10.3389/fmars.2017.00055, 2017.
tigation of the evolution of autumn coccolithophore bloom was sup-      Brussaard, C. P. D.: Viral control of phytoplankton popula-
ported by Russian Foundation for Basic Research (grant no. 20-35-         tions – a review, J. Eukaryot. Microbiol., 51, 125–138,
70034). Tropical cyclone analysis was supported by the government         https://doi.org/10.1111/j.1550-7408.2004.tb00537.x, 2004.
of Russia (grant no. 0555-2021-0003).                                   Chacko, N.: Chlorophyll bloom in response to tropical cy-
                                                                          clone Hudhud in the Bay of Bengal: Bio-Argo sub-

Biogeosciences, 18, 3173–3188, 2021                                                         https://doi.org/10.5194/bg-18-3173-2021
S. V. Stanichny et al.: Quasi-tropical cyclone caused anomalous autumn coccolithophore bloom 3185 surface observations, Deep-Sea Res. Pt. I, 124, 66–72, in the south-western Black Sea, Deep-Sea Res., 37, 911–928, https://doi.org/10.1016/j.dsr.2017.04.010, 2017. https://doi.org/10.1016/0198-0149(90)90103-3, 1990. Cokacar, T., Kubilay, N., and Oguz, T.: Structure of Emiliania Holligan, P. M., Viollier, M., Harbour, D. S., Camus, P., and huxleyi blooms in the Black Sea surface waters as detected Champagne-Philippe, M.: Satellite and ship studies of coccol- by SeaWiFS imagery, Geophys. Res. Lett., 28, 4607–4610, ithophore production along a continental shelf edge, Nature, 304, https://doi.org/10.1029/2001GL013770, 2001. 339–342, https://doi.org/10.1038/304339a0, 1983. Cokacar, T., Oguz, T., and Kubilay, N.: Satellite-detected early Homar, V., Romero, R., Stensrud, D. J., Ramis, C., and summer coccolithophore blooms and their interannual variabil- Alonso, S.: Numerical diagnosis of a small, quasi-tropical cy- ity in the Black Sea, Deep-Sea Res. Pt. I, 51, 1017–1031, clone over the western Mediterranean: Dynamical vs. bound- https://doi.org/10.1016/j.dsr.2004.03.007, 2004. ary factors, Q. J. Roy. Meteor. Soc., 129, 1469–1490, Constantin, S., Constantinescu, S., and Doxaran, D.: Long-term https://doi.org/10.1256/qj.01.91, 2003. analysis of turbidity patterns in Danube Delta coastal area Honjo, S.: Coccoliths: production, transportation and based on MODIS satellite data, J. Marine Syst., 170, 10–21, sedimentation, Mar. Micropaleontol., 1, 65–79, https://doi.org/10.1016/j.jmarsys.2017.01.016, 2017. https://doi.org/10.1016/0377-8398(76)90005-0, 1976. Coolen, J.: 7000 years of Emiliania huxleyi viruses Hopkins, J., Henson, S. A., Painter, S. C., Tyrrell, T., and in the Black Sea, Science, 333, 451–452, Poulton, A. J.: Phenological characteristics of global coc- https://doi.org/10.1126/science.1200072, 2011. colithophore blooms, Global Biogeochem. Cy., 29, 239–253, Copernicus Climate Change Service: Data Unification and Al- https://doi.org/10.1002/2014GB004919, 2015. timeter Combination System (DUACS) delayed-time altimeter Ivanov, V. A. and Belokopytov, V. N. (Eds.): Oceanography of the gridded maps of sea level anomalies over the Black Sea, avail- Black Sea, ECOSY-Gidrofizika, Sevastopol, Crimea, 215 pp., able at: https://resources.marine.copernicus.eu/?option=com_ 2013. csw&view=details&product_id=SEALEVEL_BS_PHY_L4_ Karageorgis, A. P., Gardner, W. D., Mikkelsen, O. A., REP_OBSERVATIONS_008_042, last access: 11 May 2021. Georgopoulos, D., Ogston, A. S., Assimakopoulou, G., Dyhrman, S. T. and Palenik, B.: Characterization of ectoen- Krasakopoulou, E., Oaie, G., Secrieru, D., Kanellopoulos, zyme activity and phosphate-regulated proteins in the coccol- T. D., Pagou, K., Anagnostou, C., and Papathanassiou, E.: ithophorid Emiliania huxleyi, J. Plankton Res., 25, 12151225, Particle sources over the Danube River delta, Black Sea https://doi.org/10.1093/plankt/fbg086, 2003. based on distribution, composition and size using optics, Efimov, V. V., Shokurov, M. V., and Yarovaya, D. A.: imaging and bulk analyses, J. Marine Syst., 131, 74–90, Numerical Simulation of a Quasi-Tropical Cyclone over https://doi.org/10.1016/j.jmarsys.2013.11.013, 2014. the Black Sea, Izv. Atmos. Ocean. Phy.+, 43, 667–686, Kondratev, S. I.: Peculiarities of Nutrients Distribution in the https://doi.org/10.1134/S0001433807060011, 2007. Coastal Waters near the Danube Estuary in 1997–2013, Physi- Efimov, V. V., Stanichnyi, S. V., Shokurov, M. V., and cal Oceanography, 5, 3248, https://doi.org/10.22449/1573-160X- Yarovaya, D. A.: Observations of a quasi-tropical cyclone 2015-5-32-48, 2015. over the Black Sea, Russ. Meteorol. Hydrol., 33, 233–239, Kondratev, S. I.: Three Typical Hydrological-Hydrochemical Situ- https://doi.org/10.3103/S1068373908040067, 2008. ations Near the Danube River Mouth Based on the Marine Hy- Efimov, V. V., Shokurov, M. V., Yarovaya, D. A., and Hein, D.: drophysical Institute Research Expeditions in 1997–2013, Phys- Statistics of mesoscale cyclonic eddies over the Black Sea, Phys- ical Oceanography, 26, 326–340, https://doi.org/10.22449/1573- ical Oceanography, 19, 211, https://doi.org/10.1007/s11110-009- 160X-2019-4-326-340, 2019. 9052-8, 2009. Konovalov, S. K. and Murray, J. W.: Variations in the chemistry Emanuel, K.: Tropical Cyclones, Annu. Rev. Earth Planet. Sci., 31, of the Black Sea on a time scale of decades (1960–1995), 75104, https://doi.org/10.1146/annurev.earth.31.100901.141259, J. Marine Syst., 31, 217–243, https://doi.org/10.1016/S0924- 2003. 7963(01)00054-9, 2001. Goldman, J. C.: Potential role of large oceanic diatoms Konovalov, S. K., Murray, J. W., and Luther III, G. W.: Black Sea in new primary production, Deep-Sea Res., 40, 159–168, Biogeochemistry, Oceanography, 18, 24–35, 2005. https://doi.org/10.1016/0967-0637(93)90059-C, 1993. Konovalov, S. K., Fuchsman, C. A., Belokopitov, V., and Murray, J. Gordon, H. R. and Balch, W. M. (Eds.): MODIS detached coccol- W.: Modeling the distribution of nitrogen species and isotopes in ith concentration, in: MODIS Algorithm Theoretical Basis Doc- the water column of the Black Sea, Mar. Chem., 111, 106–124, ument, University of Miami, Miami, Florida, USA, 27 pp., 1999. https://doi.org/10.1016/j.marchem.2008.01.006, 2008. Grayek, S., Stanev, E. V., and Kandilarov, R.: On the re- Kopelevich, O., Burenkov, V., Sheberstov, S., Vazyulya, S., sponse of Black Sea level to external forcing: altimeter Kravchishina, M., Pautova, L., Silkin, V., Artemiev, V., and Grig- data and numerical modelling, Ocean Dynam., 60, 123–140, oriev, A.: Satellite monitoring of coccolithophore blooms in the https://doi.org/10.1007/s10236-009-0249-7, 2010. Black Sea from ocean color data, Remote Sens. Environ., 146, Han, G., Ma, Z., and Chen, N.: Hurricane Igor im- 113–123, https://doi.org/10.1016/j.rse.2013.09.009, 2014. pacts on the stratification and phytoplankton bloom Korchemkina, E. N. and Lee, M. E.: The anomalous optical char- over the Grand Banks, J. Marine Syst., 100, 19–25, acteristics of the Black Sea waters in July 2012 and their rela- https://doi.org/10.1016/j.jmarsys.2012.03.012, 2012. tionship to the concentration of mineral suspended matter in the Hay, B. J., Honjo, S., Kempe, S., Ittekkot, V. A., Degens, E. T., water, Marine Hydrophysical Journal, 2, 67–72, 2014 (in Rus- Konuk, T., and Izdar, E.: Interannual variability in particle flux sian). https://doi.org/10.5194/bg-18-3173-2021 Biogeosciences, 18, 3173–3188, 2021
You can also read