A-Train estimates of the sensitivity of the cloud-to-rainwater ratio to cloud size, relative humidity, and aerosols
←
→
Page content transcription
If your browser does not render page correctly, please read the page content below
Atmos. Chem. Phys., 21, 2765–2779, 2021
https://doi.org/10.5194/acp-21-2765-2021
© Author(s) 2021. This work is distributed under
the Creative Commons Attribution 4.0 License.

A-Train estimates of the sensitivity of the cloud-to-rainwater ratio to
cloud size, relative humidity, and aerosols
Kevin M. Smalley and Anita D. Rapp
Department of Atmospheric Sciences, Texas A&M University, College Station, Texas, USA

Correspondence: Kevin M. Smalley (ksmalley@jpl.nasa.gov)

Received: 22 July 2020 – Discussion started: 12 August 2020
Revised: 4 December 2020 – Accepted: 20 January 2021 – Published: 24 February 2021

Abstract. Precipitation efficiency has been found to play an     1   Introduction
important role in constraining the sensitivity of the climate
through its role in controlling cloud cover, yet its controls    Low cloud cover continues to be a dominant source of uncer-
are not fully understood. Here we use CloudSat observations      tainty in projecting future climate (e.g., Bony and Dufresne,
to identify individual contiguous shallow cumulus cloud ob-      2005; Dufresne and Bony, 2008; Vial et al., 2013), with vari-
jects and compute the ratio of cloud water path to rainwa-       ations in shallow cumulus distributions explaining much of
ter (WRR) path as a proxy for warm-rain efficiency. Cloud        the differences in climate-model-derived estimates of climate
objects are then conditionally sampled by cloud-top height,      sensitivity (e.g., Wyant et al., 2006; Medeiros and Stevens,
relative humidity, and aerosol optical depth (AOD) to ana-       2011; Nam et al., 2012). This stems from climate models’
lyze changes in WRR as a function of cloud size (extent).        inability to simulate shallow cumulus clouds and their im-
For a fixed cloud-top height, WRR increases with extent and      pacts, due in part to the low temporal and spatial resolution
environmental humidity following a double power-law dis-         of these models (e.g., Stevens et al., 2002), as well as the fact
tribution, as a function of extent. Similarly, WRR increases,    that small-scale processes important for cloud development,
holding average relative humidity at or below 850 mb con-        including turbulence and convection, must be parameterized
stant. There is little relationship between WRR and AOD          (e.g., Tiedtke, 1989; Zhang and McFarlane, 1995; Brether-
when conditioned by cloud-top height, suggesting that, once      ton et al., 2004). Studies have shown precipitation efficiency
rain drop formation begins, aerosols may not be as important     is a key parameter used to constrain cloud parameterizations
for WRR as cloud size and depth. Consistent with prior stud-     within climate models (Rennó et al., 1994; Del Genio et al.,
ies, results show an increase in WRR with sea-surface tem-       2005; Zhao, 2014; Lutsko and Cronin, 2018). Nam et al.
perature. However, for a given depth and SST, WRR is also        (2012) hypothesized that shallow cumulus clouds are too re-
dependent on cloud size and becomes larger as cloud size in-     flective in climate models, possibly because model precipi-
creases. Given that larger objects become more frequent with     tation efficiencies are too weak. This results in excess cloud
increasing SST, these results imply that increasing precipita-   water, which increases cloud optical depth and shallow cu-
tion efficiencies with SST are due not only to deeper clouds     mulus reflectance. Prior observational and modeling studies
with greater cloud water contents but also to the propensity     found the precipitation efficiency of shallow cumulus clouds
for larger clouds which may have more protected updrafts.        increases as sea-surface temperature (SST) increases in re-
                                                                 sponse to climate change (Lau and Wu, 2003; Bailey et al.,
                                                                 2015; Lutsko and Cronin, 2018). Factors including environ-
                                                                 mental moisture (e.g., Heus and Jonker, 2008; Schmeissner
                                                                 et al., 2015), entrainment (e.g., Korolev et al., 2016; Pin-
                                                                 sky et al., 2016b, a), and aerosols (e.g., Koren et al., 2014;
                                                                 Dagan et al., 2016; Jung et al., 2016b, a) help regulate both
                                                                 thermodynamic and dynamical processes that promote favor-
                                                                 able conditions important to not only warm-rain production

Published by Copernicus Publications on behalf of the European Geosciences Union.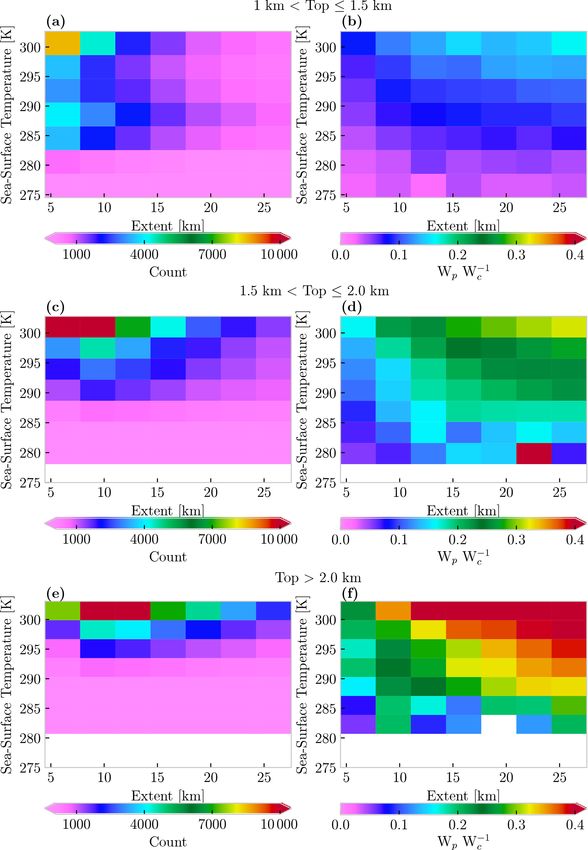
2766                        K. M. Smalley and A. D. Rapp: WRR sensitivity to cloud size, relative humidity, and aerosols

but also the efficiency of the conversion of cloud water to        Gao et al., 2018). Although both the large-scale and cloud
precipitation. To better constrain cloud parameterizations of      microphysical definitions of precipitation efficiency are use-
these processes and subsequently climate sensitivity to low        ful (Sui et al., 2005, 2007), variations in the ratio of cloud
cloud cover, more observation-based studies analyzing phys-        water to rainwater (WRR) in response to changes in evap-
ical processes influencing warm-rain efficiencies are needed.      oration can theoretically be used as a proxy for warm-rain
   In an ideal shallow cumulus cloud, liquid water content         efficiency based on the cloud microphysical definition. From
increases adiabatically from cloud base to top. However, liq-      this coupled with LES results showing that shallow cumu-
uid water content is generally only 50–80 % of the adia-           lus updrafts are more protected as clouds grow in size and/or
batic values due to entrainment (Gerber et al., 2008; Blyth        RH increases, we hypothesize larger droplets will be evident
et al., 2013; Watson et al., 2015). Evaporation induced by         closer to the cloud base and increase WRR in larger cloud
cloud edge mixing impacts not only shallow cumulus up-             objects, because the cloud core of larger cloud objects is
draft strength but also the number and size of droplets within     more protected from entrainment.
a cloud (Lu et al., 2012), with increased evaporation poten-          While perhaps not as important as organization (Minor
tially reducing the number and size of available droplets. Us-     et al., 2011) or cloud size (Jiang and Feingold, 2006), it
ing a large-eddy simulation (LES), Moser and Lasher-Trapp          is widely understood that aerosol concentrations act to sup-
(2017) found the influence of entrainment decreases from           press warm-rain production (Twomey, 1974; Albrecht, 1989)
cloud edge to center of individual shallow cumulus clouds          by increasing the cloud droplet concentration and reducing
as they grow larger. This results in liquid water content at       cloud droplet sizes (Squires, 1958). Albrecht (1989) found
cloud center being closer to adiabatic in larger clouds, be-       that increasing precipitation efficiency within a model is
cause fewer droplets evaporate away at cloud center. This          equivalent to decreasing the amount of cloud concentration
implies that the collision–coalescence process is more effi-       nuclei (CCN), which reduces the mass concentration of cloud
cient at cloud center, because there is more cloud water avail-    water within a cloudy layer. Similarly, Saleeby et al. (2015)
able to be collected by large droplets. As a result, smaller       used a cloud model to recently show that the number con-
droplets originating near cloud top may be more likely to          centration of smaller cloud drops increases, but the num-
continuously grow larger as they fall, potentially reaching        ber concentration of rain drops decreases as CCN increase
raindrop size near cloud base. At cloud edge, there are not        in the presence of increasing aerosols. Lebsock et al. (2011)
only fewer droplets but also smaller droplets, potentially re-     used CloudSat and Moderate Resolution Imaging Spectrora-
ducing collision–coalescence efficiencies there. This is con-      diometer (MODIS) observations to show that, as drop size
sistent with other LES results that found shallow cumulus up-      decreases, the ratio of rainwater to cloud water also de-
drafts are more insulated from entrainment as they increase        creases. Together, these studies suggest the number of large
in size (e.g., Heus and Jonker, 2008; Burnet and Brenguier,        droplets able to fall at sufficient terminal velocities to initiate
2010; Tian and Kuang, 2016).                                       collision–coalescence and continue growing to large enough
   LES and limited field-campaign observational studies            sizes to fall out as rain decreases with increasing aerosol con-
have shown that cloud updrafts become more protected not           centrations, which would reduce WRR.
only as cloud size increases but also as relative humidity            Earlier studies have used satellite observations to infer the
(RH) increases (e.g., Heus and Jonker, 2008; Schmeissner           relationship between precipitation efficiency and both sea-
et al., 2015). Using a model, Romps (2014) found precip-           surface temperature (Lau and Wu, 2003) and drop size (Leb-
itation efficiency to be closely related to RH, defining the       sock et al., 2011). However, the relationship between cloud
lower bound of precipitation efficiency as ≥ 1 − RH. There-        water and precipitation as shallow cumulus clouds grow
fore, the precipitation efficiency at any given level of the at-   larger, environmental moisture increases, and/or as aerosol
mosphere should increase with increasing RH in response to         loading varies has only been investigated using cloud mod-
lower evaporation rates. This suggests that lower RH would         els (e.g., Abel and Shipway, 2007; van Zanten et al., 2011;
result in increased evaporation rates and lower warm-rain ef-      Franklin, 2014; Saleeby et al., 2015; Moser and Lasher-
ficiencies. Prior studies have defined precipitation efficiency    Trapp, 2017; Hoffmann et al., 2017) and limited field-
in two ways: (1) as the large-scale precipitation efficiency       campaign observations (e.g., Rauber et al., 2007; Gerber
and (2) as the cloud microphysical precipitation efficiency.       et al., 2008; Burnet and Brenguier, 2010; Watson et al., 2015;
Generally, observational studies have based their definition       Jung et al., 2016b). While these case and model studies pro-
of precipitation efficiency on the large-scale definition, which   vide insight into the physical processes, it is unclear how well
has simply been defined as the ratio of surface rain rate to       they represent the shallow cumulus clouds observed globally.
the sum of both vapor mass flux in/out of a cloud and sur-         Satellites can observe a large enough sample size of shal-
face evaporation (e.g., Chong and Hauser, 1989; Tao et al.,        low cumulus clouds over different regions and during differ-
2004; Sui et al., 2007), whereas the cloud microphysical def-      ent stages of their life cycle to gain a more holistic view of
inition, or the ratio of surface rain rate to the sum of vapor     this relationship. Prior studies have used TRMM and Global
condensation and deposition rates, has been primarily used in      Precipitation Measurement Mission (GPM) observations to
cloud modeling studies (e.g., Li et al., 2002; Sui et al., 2005;   analyze warm-rain production and efficiency (e.g., Lau and

Atmos. Chem. Phys., 21, 2765–2779, 2021                                              https://doi.org/10.5194/acp-21-2765-2021
K. M. Smalley and A. D. Rapp: WRR sensitivity to cloud size, relative humidity, and aerosols                                  2767

Wu, 2003). Unfortunately, TRMM and GPM are precipita-              possible, probable, or certain) to identify raining cloud ob-
tion radars operating at the Ku- and Ka-bands not capable of       jects and the raining pixels within them. Using all three
observing the non-raining portions of clouds or light precip-      rain flags helps us identify pixels only producing light driz-
itation. Building off work in Smalley and Rapp (2020) that         zle that might be evaporating before reaching the surface to
analyzed the relationship between rain likelihood and cloud        those producing heavier rainfall (Haynes et al., 2009). This
size, this study uses the higher-sensitivity radar of CloudSat     range of rainfall is incorporated into the integrated precipita-
in addition to MODIS observations to test the hypothesis that      tion water path product from 2C-RAIN-PROFILE (Lebsock,
WRR is higher in larger shallow cumulus clouds and is mod-         2018), and we use this product to determine the average rain-
ulated by RH and aerosol loading.                                  water path (WP ) for each cloud object, only including WP
                                                                   associated with raining pixels in the average. We then store
                                                                   the median cloud-top height and maximum along-track ex-
2   Data and methods                                               tent (hereafter extent) of each cloud object for later analysis.
                                                                      Although CloudSat 2B-CWC-RVOD (Austin et al., 2009)
To determine if larger shallow cumulus clouds are more effi-       does provide a cloud water path (WC ) product, the rain drop
cient at producing warm rainfall, this study uses the CloudSat     size distribution used in 2B-CWC-RVOD is not the same as
Cloud Profiling Radar (CPR; Tanelli et al., 2008) to identify      that used in 2C-RAIN-PROFILE. Additionally, Christensen
individual contiguous shallow cumulus cloud objects. The           et al. (2013) found that the 2B-CWC-RVOD algorithm strug-
CPR is a near-nadir-pointing 94 GHz radar that can observe         gles to filter out precipitation-sized droplets in the presence
raining and non-raining cloud drops. It allows us to analyze       of light precipitation and drizzle, which results in an over-
the horizontal distribution of cloud within a horizontal foot-     estimation of cloud water. This, coupled with differences in
print of 1.4 × 1.8 km and the vertical distributions of clouds     assumed drop size distributions by 2B-CWC-RVOD and 2C-
within a 240 m bin within each CloudSat pixel.                     RAIN-PROFILE, makes 2B-CWC-RVOD WC not ideal for
   Contiguous cloudy regions are initially identified using the    this study, so we instead use MODIS WC . Cho et al. (2015)
2B-GEOPROF (Marchand et al., 2008) cloud mask confi-               found that MODIS effective radius and optical depth retrieval
dence values ≥ 20, which removes orbit elements that may           failure rates are higher in regions of broken trade cumulus
be influenced by ground clutter (Marchand et al., 2008). An        than regions of predominantly stratocumulus, and they pri-
additional limitation of CloudSat is its inability to sense the    marily attributed this to the presence of partially filled and
smallest cloud droplets (e.g., Lamer et al., 2020). Smalley        inhomogeneous cloudy pixels. They also found that a large
and Rapp (2020) addressed this by including CALIPSO mea-           fraction of unexplained MODIS retrieval failures are related
surements, which are sensitive to the smallest cloud droplets,     to the presence of precipitation after comparing MODIS fail-
in their identification of contiguous cloudy regions. However      ure rates to non-precipitating and precipitating pixels classi-
for this study, cloud objects must not be missing any reflec-      fied by CloudSat. This is attributed to a higher frequency of
tivity values. As a result, some cloud object edges may not        failures due to effective radius being too large. Considering
be the true edge, and some of our defined cloud objects may        the retrieval of effective radius and optical depth is required
be connected to other cloud objects. Before identifying cloud      to derive WC and higher failure rates within broken trade cu-
objects, 2C-RAIN-PROFILE (Lebsock and L’Ecuyer, 2011)              mulus, we suspect unavoidable sampling bias exists in WC
modeled reflectivity is mapped onto the two-dimensional            matched to the smallest cloud objects and/or those contain-
cloud mask field. As outlined by the prior literature (e.g.,       ing large droplets and heavy rain. However on a global scale,
L’Ecuyer and Stephens, 2002; Mitrescu et al., 2010; Leb-           prior studies have found the uncertainties in MODIS WC are
sock and L’Ecuyer, 2011), modeled reflectivity adjusts the         small in comparison to other satellite retrievals (e.g., Seethala
raw reflectivity for multi-scattering and attenuation when it is   and Horvath, 2010; Lebsock and Su, 2014), with the global
raining. As described by Smalley and Rapp (2020), we use a         mean of MODIS WC being within 5 g m−2 of WC deter-
lower-tropospheric stability threshold of 18.55 K (Klein and       mined using the Advanced Microwave Scanning Radiometer
Hartmann, 1993) to separate cloud objects occurring in en-         for Earth Observing System (Seethala and Horvath, 2010).
vironments favoring stratocumulus development from those           Given potential uncertainties in WC , we tested the sensitiv-
occurring in environments favoring shallow cumulus devel-          ity of our results to only including MODIS pixels with a
opment. To ensure that none of the cloud objects examined          minimum WC > 0, 20, and 30 g m−2 in our analysis, and we
here contain ice, we only include cloud objects with tops          found that the overall interpretation of our results does not
entirely below the freezing level as defined in 2C-PRECIP-         change depending on the minimum WC threshold used. Even
COLUMN (Haynes et al., 2009).                                      though our overall results do not change using a WC thresh-
   Shallow cumulus cloud objects are then identified using         old below 30 g m−2 , we use the conservative estimate of WC
the methodology described by Smalley and Rapp (2020)               (≥ 30 g m−2 ), which is based on an uncertainty estimate of
using the combined two-dimensional reflectivity field, with        28 g m−2 from Jolivet and Feijt (2005), coupled with an esti-
only single-layer cloud objects included. We use the inci-         mated uncertainty of 36 g m−2 which was determined using
dence precipitation flag from 2C-PRECIP-COLUMN (rain               error in effective radius and optical depth from Platnick and

https://doi.org/10.5194/acp-21-2765-2021                                            Atmos. Chem. Phys., 21, 2765–2779, 2021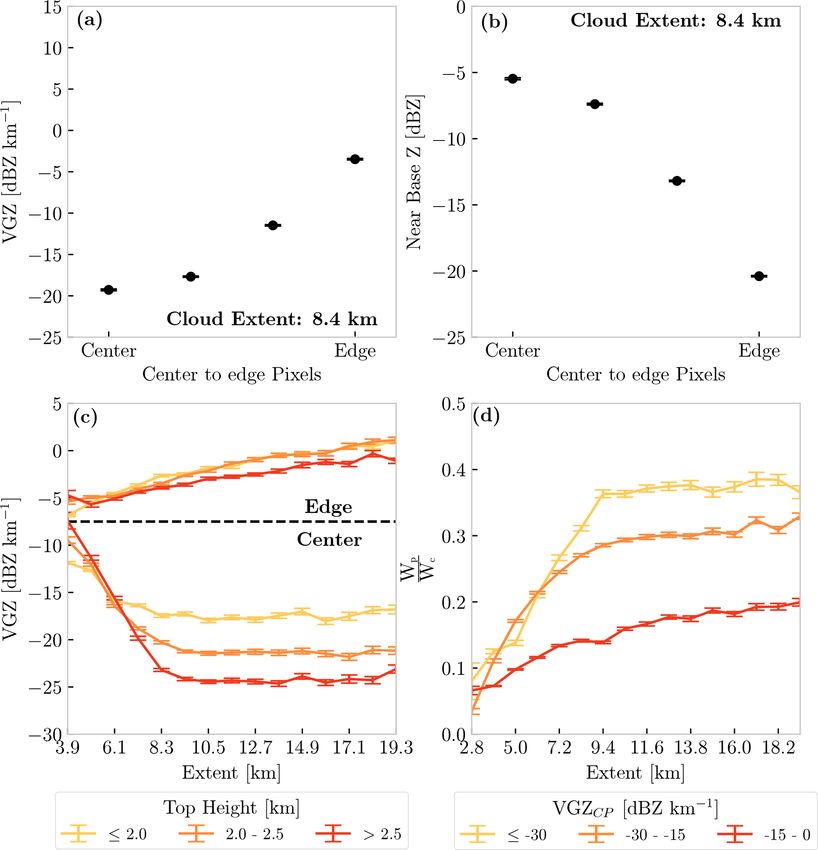
2768                         K. M. Smalley and A. D. Rapp: WRR sensitivity to cloud size, relative humidity, and aerosols

Valero (1995). Due to horizontal resolution differences be-         aerosols swelling due to the uptake of water and an underesti-
tween CloudSat and MODIS, one CloudSat pixel may over-              mation of the first indirect aerosol effect (Liu and Li, 2018).
lap multiple MODIS pixels within a surrounding 3 × 3 km             These conditions are not considered in this study but may
grid. As a result, WC is then calculated for each CloudSat          factor into WRR.
pixel by averaging the nearest nine non-zero MOD-06-1KM                As in Smalley and Rapp (2020), this analysis is con-
(Platnick et al., 2003) pixels within a 3 × 3 km grid sur-          strained to only marine shallow cumulus clouds between
rounding each CloudSat pixel, which have been previously            60◦ N and 60◦ S. Measurements are constricted to June 2006
matched to the CloudSat track in the MOD-06-1KM product             and December 2010 because CloudSat stopped taking night-
(Cronk and Partain, 2018). There could be concerns that av-         time measurements after 2010 due to a battery anomaly
eraging WC within the nearest nine MODIS pixels may not             (Witkowski et al., 2012). RH is classified using 6-hourly
properly represent the WC at the appropriate scales relative        ECMWF-AUX (Cronk and Partain, 2017). However, because
to the horizontal footprint of each CloudSat pixel; however         lateral mixing at shallow cumulus edges would most likely be
we tested our results using WC within the nearest MODIS             entraining boundary layer air (see review by de Rooy et al.,
pixel and found that our overall results do not change. We          2013), we tested the sensitivity of our results to RH at differ-
then stored and analyzed the mean WC associated with each           ent pressure levels (850 and 950 mb) in the lower atmosphere
cloud object.                                                       and at the surface, and the average RH at or below 850 mb.
   WRR of each shallow cumulus cloud object is calculated           We found that, while the magnitudes slightly change, the
    WP
as W C
       . Note that this is a proxy for true warm-rain efficiency,   overall interpretation of our results does not depend on our
because mass flux of water in and out of a cloud cannot be de-      definition of RH. As a result, we classify RH as the average
termined without a model; however, this ratio has been used         RH at or below 850 mb and match it to each cloud object.
by prior observational studies to analyze the amount of cloud       Cloud-top height, RH, VGZ, and AOD are used to control
water converted to rainwater (e.g., Lebsock et al., 2011).          and analyze the relationship between WRR and cloud object
   Considering Rayleigh reflectivity is a function of the drop      extent.
size distribution to the 6th power, it is expected that the maxi-
mum reflectivity in non-raining cloud objects will occur near
cloud top and then shift downward as a cloud transitions from       3   Warm-rain relationship to extent
non-raining to raining. Wang et al. (2017) used the vertical
reflectivity gradient (VGZ) to investigate warm-rain onset.         Similar to Smalley and Rapp (2020), the spatial distribution
They found VGZ (positive down) reverses sign (positive to           of WP , WC , WRR, and AOD, as well as the extent of raining
negative) when clouds transition from non-raining to rain-          shallow cumulus cloud objects, is analyzed by binning them
ing. Given previous studies and results shown in Smalley and        to a 2.5◦ × 2.5◦ global grid.
Rapp (2020) finding rain is more likely as clouds grow larger          Figure 1a shows the spatial distribution of WP over the
in extent, it is hypothesized that the negative VGZ within          global ocean basins, with WP increasing equatorward. This
individual raining cloud objects will increase in magnitude         is consistent with the prior literature that found raining shal-
as cloud objects increase in extent. The methodology devel-         low cumulus clouds are most frequent within the tropics
oped by Wang et al. (2017) is applied to find the VGZ for           (e.g., Smalley and Rapp, 2020). WP is largest near the Inter-
each pixel within every shallow cumulus cloud object. VGZ           Tropical Convergence Zone (ITCZ), South Pacific Conver-
at cloud object center pixel (VGZCP ) will then be compared         gence Zone (SPCZ), and tropical warm pool, with values
to VGZ at cloud object edge pixel (VGZEP ) to infer the im-         exceeding 45 g m−2 . Deep convection is more frequent here
pact of mixing on cloud object cores as a function of cloud         (e.g., Waliser and Gautier, 1993), so some objects may be
size and RH.                                                        transitioning from raining shallow cumulus to deeper con-
   The influence of aerosols on the relationship between            vection. The results likely include a mix of frequently occur-
WRR and cloud object size is determined using Aqua                  ring tropical raining shallow cumulus clouds and the early
MODIS Level 3 daily 550 nm aerosol optical depth (AOD)              stages of developing deep convection possibly resulting in
(Ruiz-Arias et al., 2013). Each cloud object is matched to          large WP over the tropics.
the nearest 1◦ × 1◦ grid box AOD value. Note that AOD                  Spatial patterns in WC (Fig. 1b) within the tropics gen-
may not necessarily scale with the number of CCN due to             erally follow WP , with values ranging between 110 and
its dependence on particle size, and that aerosol type varies       150 g m−2 in the tropics. We find that relative humidity gen-
globally. Additionally, AOD, being column-integrated, does          erally decreases from median values near 90 % in the tropics
not give any information about where the aerosols are within        to median values near 80 % north or south into the midlat-
the atmospheric column, so high AOD does not necessarily            itudes (not shown); this is consistent with modeling studies
mean that aerosols are occurring within the cloud layer. Fi-        that found less cloud water evaporates away in wetter envi-
nally, multiple studies have shown that AOD depends on rel-         ronments (e.g., Tian and Kuang, 2016). Considering bound-
ative humidity (Su et al., 2008; Michel Flores et al., 2012;        ary layer depth scales with SST (e.g., Wood and Bretherton,
Neubauer et al., 2017; Liu and Li, 2018). This results in           2004), the boundary layer is generally deeper over the tropi-

Atmos. Chem. Phys., 21, 2765–2779, 2021                                               https://doi.org/10.5194/acp-21-2765-2021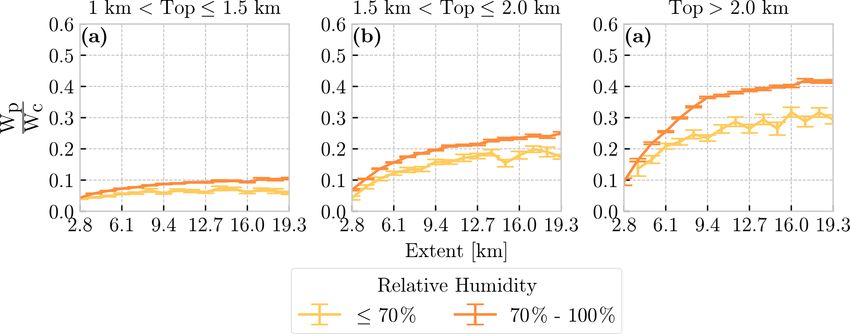
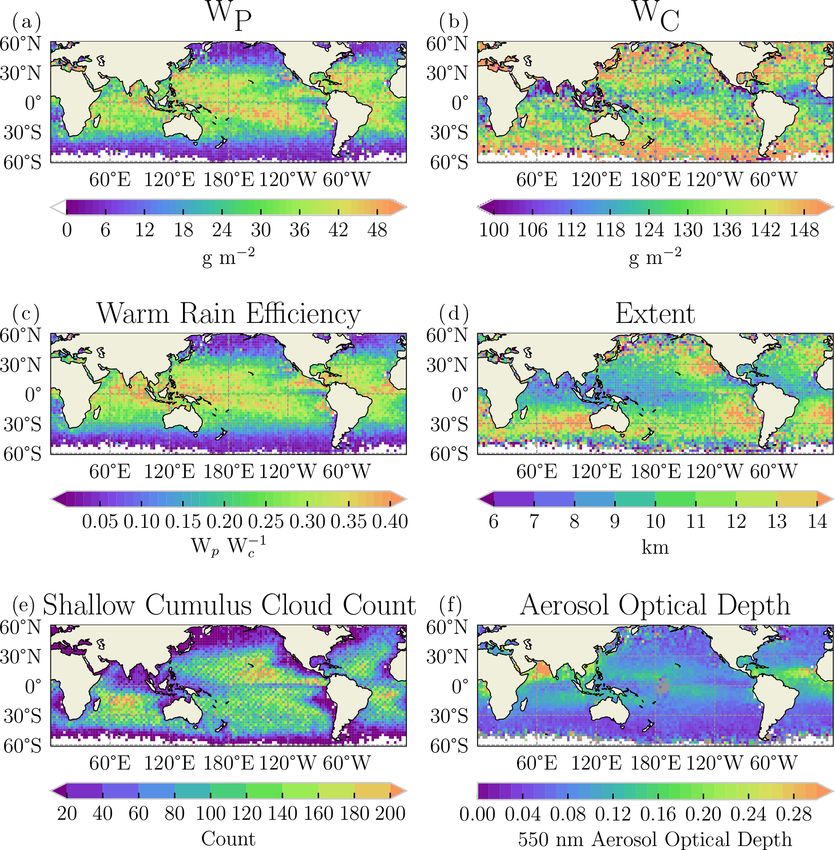
K. M. Smalley and A. D. Rapp: WRR sensitivity to cloud size, relative humidity, and aerosols                                              2769

Figure 1. The spatial distribution of integrated precipitation water path (WP ), cloud water path (WC ), warm-rain efficiency, extent, number of
shallow cumulus cloud objects, and aerosol optical depth is shown in panels (a)–(f), respectively. Cloud objects are binned onto a 2.5◦ × 2.5◦
spatial grid, and any grid box containing no data is white.

cal oceans than the sub-tropical oceans. This supports deeper             region in a 4-year period, reducing confidence in WRR here.
clouds (e.g., Short and Nakamura, 2000; Rauber et al., 2007;              Together, Fig. 1c and d indicate that the relationship between
Smalley and Rapp, 2020) and could also help explain why                   WRR and extent is complicated and potentially depends on
WC and WP are largest in the tropics.                                     cloud depth (which increases in the tropics) and on environ-
   Figure 1c shows the spatial patterns in WRR follow spa-                mental conditions including RH and aerosol loading.
tial patterns in WP , with values increasing equatorward. Shal-              To determine how WRR depends on cloud size, Fig. 2
low cumulus cloud object WRR is largest within the ITCZ,                  shows WRR as a function of cloud object extent. Note that
SPCZ, and tropical warm pool, with values > 0.35. This is                 we estimate the uncertainty in median WRR at any given ex-
consistent with Lau and Wu (2003), who found precipitation                tent by bootstrapping WRR at a given extent 10 000 times
efficiency is positively correlated with SST (e.g., Lau and               with replacement. Error in WRR median is then classified
Wu, 2003), and implies that WRR is higher in wetter envi-                 as ±1 standard deviation of the bootstrapped sample distri-
ronments.                                                                 bution of median values. Similar error estimates are shown
   Patterns in spatial extent shown in Fig. 1d are similar to             in Figs. 3–5 later in this section. WRR follows a double
those found by Smalley and Rapp (2020), who used com-                     power-law relationship, with WRR < 0.25 for cloud objects
bined CloudSat–CALIPSO to define extent, with extent de-                  < 8.4 km and approaching 0.30 for cloud objects > 8.4 km.
creasing from the stratocumulus regions west into the trade               There is also very little spread in median WRR at a given ex-
cumulus regions and north of the trade cumulus and stratocu-              tent, which gives us confidence that this relationship is real.
mulus regions into the ITCZ. Interestingly, Fig. 1c shows                 Similar to these results, earlier studies have shown a double
WRR also peaks in the southeast Pacific stratocumulus re-                 power-law distribution in shallow cumulus size (e.g., Benner
gion, implying that WRR is high in regions with relatively                and Curry, 1998; Trivej and Stevens, 2010), which will be
low SST. However, Fig. 1e shows that fewer than 40 shallow                discussed in further detail later.
cumulus objects are observed in a given grid box over this

https://doi.org/10.5194/acp-21-2765-2021                                                     Atmos. Chem. Phys., 21, 2765–2779, 2021
2770                         K. M. Smalley and A. D. Rapp: WRR sensitivity to cloud size, relative humidity, and aerosols

                                                                    then decrease, moving from cloud object center to cloud ob-
                                                                    ject edge, with edge values of −17.96 dBZ. Figure 4a cou-
                                                                    pled with Fig. 4b implies, at least for extents of 8.4 km, that
                                                                    drops grow larger near cloud object centers and may be more
                                                                    protected from mixing.
                                                                       Figure 4c shows the relationship between VGZCP and
                                                                    VGZEP as a function of extent and top height. For a con-
                                                                    stant cloud-top height, VGZCP again follows a double power-
                                                                    law distribution. Specifically, the magnitude of the VGZCP
                                                                    rapidly increases from approximately 10 to 20 dBZ km−1
                                                                    as extent approaches 8.4 km, while it plateaus around
                                                                    20 dBZ km−1 for extents > 8.4 km. Conversely, VGZEP de-
                                                                    creases in magnitude, approaching 0 dBZ km−1 for the
                                                                    largest cloud object extents. However, it does not decrease
                                                                    as fast as VGZCP , implying that the change in vertical re-
                                                                    flectivity gradient in the center of cloud is driving changes

                                                           WP       in differences from center to edge. Figure 4c also shows that
Figure 2. The median ratio of cloud water to rainwater W       at
                                                            C       the change in VGZCP depends on cloud-top height for ex-
a given maximum size (extent). The red error bars represent  ±1
                                                     WP
                                                                   tents > 5.6 km, with larger magnitudes for the tallest clouds.
standard deviation of a bootstrapped distribution of W    medians   Narrowing this down to the possible influence of entrainment
                                                      C
at a given extent.                                                  on cloud object updrafts from cloud edge to center, this is
                                                                    also consistent with previous modeling studies that found
                                                                    that larger shallow cumulus cloud cores are more insulated
   To address the impact of RH and cloud depth on WRR,              from entrainment (e.g., Burnet and Brenguier, 2010; Tian
Fig. 3 shows the relationship between WRR and cloud object          and Kuang, 2016), a more adiabatic cloud core of developing
extent conditioned using cloud-top height and RH at or below        cumulus as shown in Fig. 2 from Moser and Lasher-Trapp
850 mb. Holding RH constant, WRR depends strongly on                (2017), and a higher probability of rainfall (e.g., Smalley and
cloud-top height, with WRR nearly doubling for each 0.5 km          Rapp, 2020) in observations.
increase in cloud-top height for a given extent in the most            To determine how VGZCP influences the relationship be-
humid environments. For a given RH and top height, there is         tween WRR and extent, Fig. 4d shows WRR as a function
also an increase in WRR with extent. Holding top height con-        of extent conditioned by top height and VGZCP , with WRR
stant, there is also an increase in WRR with increasing RH,         increasing as the magnitude of VGZCP increases; however,
with no overlap in median WRR error at a given extent or            changes in WRR are not distinct when the magnitude of
RH. However, increases in WRR are dominated by changing             VGZCP is larger than −15 dBZ km−1 for extents < 7 km.
cloud size (depth and extent).                                      This, coupled with Fig. 4c, illustrates that, as shallow cumu-
   To support the hypothesis that larger shallow cumulus            lus grow deeper and wider, drops at the center of the cloud
clouds are able to sustain a larger droplet field within their      can grow larger and scavenge more available cloud water.
cores to increase the precipitation efficiency, the variation       This is consistent with larger shallow cumulus clouds being
in the VGZ across individual cloud objects is examined.             more efficient at producing rainfall, perhaps in part because
We expect that VGZ will be a larger negative value near             they are less influenced by environmental mixing.
cloud center than cloud edge, especially as cloud size in-             Until this point, this paper has focused on how cloud size
creases. As an example, Fig. 4a shows the change in me-             and RH impact WRR. However, it is also understood that
dian VGZCP to VGZEP for cloud objects with an extent of             aerosol concentrations influence both the number and size
8.4 km. VGZ decreases from −3.48 dBZ km−1 at cloud ob-              of droplets within a cloud, with larger aerosol concentra-
ject edge to −20.3 dBZ km−1 at cloud object center. Given           tions resulting in a greater number of smaller droplets (e.g.,
the relationship between reflectivity and drop size, a nega-        Twomey, 1974; Albrecht, 1989). As a result, we hypothesize
tive VGZCP implies that drop growth is occurring from near          that increasing aerosol concentrations, which vary regionally
cloud top to near cloud base close to cloud object center,          (Fig. 1f), increase the ratio of cloud droplets to rain drops,
suggesting that larger droplets may be present near cloud           thus reducing WRR.
base near cloud object center compared to the edge. To di-             Figure 5a shows the relationship between WRR and AOD,
rectly analyze drop size near cloud base, Fig. 4b shows the         conditioned by top height. On first glance, it appears that
spread in median near-base reflectivity for cloud objects with      WRR increases as a function of AOD, which contradicts
an extent of 8.4 km. Figure 4b confirms that cloud drops are        the expectation of a shift in drop size distribution towards
largest near cloud object center, with a median reflectivity of     fewer large drops to initiate collision–coalescence, which
−5.28 dBZ. Reflectivity values, and subsequent drop sizes,          would reduce the amount of cloud water converted to rainwa-

Atmos. Chem. Phys., 21, 2765–2779, 2021                                              https://doi.org/10.5194/acp-21-2765-2021
K. M. Smalley and A. D. Rapp: WRR sensitivity to cloud size, relative humidity, and aerosols 2771
WP
Figure 3. The median ratio of cloud water to rainwater W at a given maximum size (extent). The different line colors represent cloud
C
WP
objects separated by < 850 mb relative humidity (RH). Error bars represent ±1 standard deviation of a bootstrapped distribution of W
C
medians at a given extent and RH.
Figure 4. Panel (a) shows the median change in the vertical reflectivity (VGZ) from the center to edge of all cloud objects with an extent
of 8.4 km. Panel (b) shows the median change in near-base reflectivity (Z) from the center to edge of all cloud objects with an extent
of 8.4 km. Panel (c) shows the median vertical reflectivity gradient (VGZ) at the center and edge of different-sized (extent) raining cloud
WP
objects. Different lines represent cloud objects separated by top height. Panel (d) shows the median ratio of cloud water to rainwater ( W )
C
at a given median size (extent). The different line colors represent cloud objects separated by the vertical reflectivity gradient on the center
pixel (VGZCP ) of all cloud objects. Error bars represent ±1 standard deviation of a bootstrapped distribution of median VGZ and Z for a
WP
given pixel from cloud object edge to center (a, b), as well as VGZ and W at a given extent (c, d).
C
https://doi.org/10.5194/acp-21-2765-2021 Atmos. Chem. Phys., 21, 2765–2779, 20212772 K. M. Smalley and A. D. Rapp: WRR sensitivity to cloud size, relative humidity, and aerosols
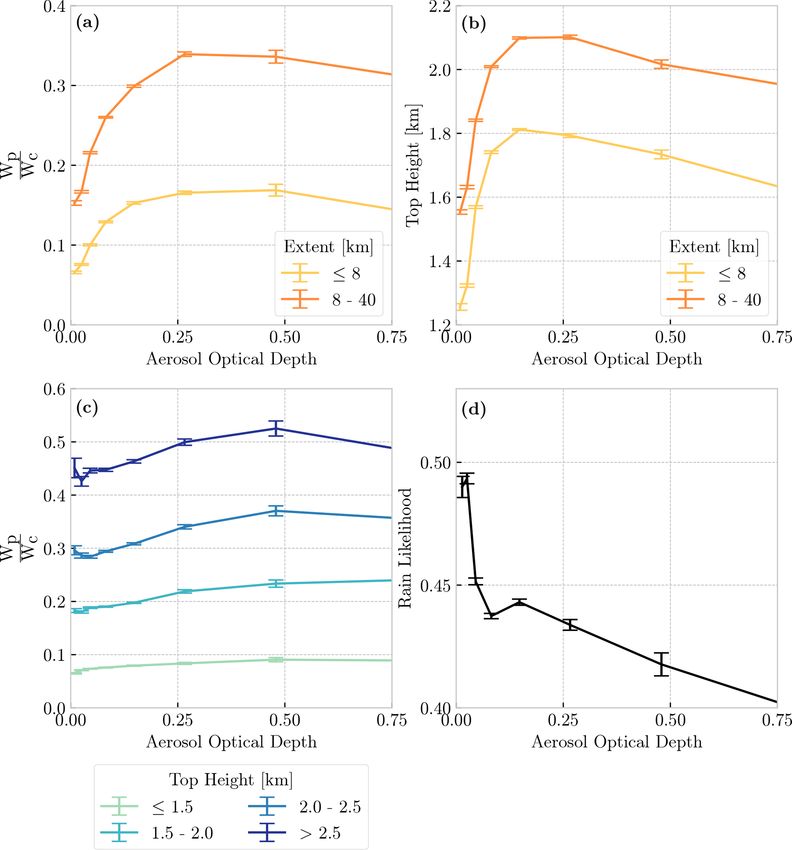
Figure 5. Panel (a) shows the relationship between median warm-rain efficiency and MODIS 550 nm aerosol optical depth. Panel (b)
shows the relationship
between median cloud-top height and aerosol optical depth. Panel (c) shows the relationship between warm-rain
WP
efficiency W and aerosol optical depth. Line colors in panels (a) and (b) represent cloud objects separated by extent, while line colors
C
in panel (c) represent cloud objects separated by top height. Panel (d) shows the ratio of raining cloud objects to non-raining cloud objects
(rain likelihood) at a given aerosol optical depth. For panels (a), (b), and (c), error bars represent ±1 standard deviation of a bootstrapped
WP
distribution of raining cloud objects to determine the uncertainty in W and top height at a given aerosol optical depth, whereas the error
C
bars shown in panel (d) represent ±1 standard deviation of a bootstrapped distribution of raining and non-raining cloud objects to determine
rain likelihood uncertainty at a given aerosol optical depth.
ter. However, disentangling aerosol–cloud interactions from is more sensitive to cloud depth than aerosols. While these
other meteorological variables is quite difficult, as increasing results seem counterintuitive, this analysis examines clouds
aerosol concentrations are often correlated with other envi- in which precipitation has been detected. Figure 5d shows
ronmental variables (e.g., Koren et al., 2014). the likelihood of rain occurrence at a given AOD determined
Given the strong dependence of WRR on top height, by the ratio of raining cloud objects to the total number of
we further examine the relationship between AOD and top cloud objects. As expected, Fig. 5d shows that the likelihood
height (Fig. 5b), conditioned by extent. The curves shown in of rain decreases as AOD increases, with rain likelihood of
Fig. 5a look similar to those shown in Fig. 5b, suggesting about 50 % in the cleanest environments decreasing to about
the positive correlation between aerosols and top height are 40 % for an AOD approaching 0.75. These results imply that,
responsible for the observed relationship between AOD and once the condensation–coalescence is initiated, aerosol load-
WRR. Indeed, Fig. 5c further supports this assertion. When ing has a smaller impact on the conversion of cloud water to
conditioned by top height, WRR shows little dependence rain than other cloud or environmental characteristics.
on AOD and suggests that the conversion from WC to WP
Atmos. Chem. Phys., 21, 2765–2779, 2021 https://doi.org/10.5194/acp-21-2765-2021K. M. Smalley and A. D. Rapp: WRR sensitivity to cloud size, relative humidity, and aerosols 2773
4 Limitations of analysis and observations nant type of entrainment impacting these cloud objects would
be lateral entrainment at cloud edges (see review by de Rooy
This study has emphasized the potential for the decreasing et al., 2013) and that these are indeed shallow cumulus.
impact of entrainment on cloud cores, resulting in higher At the small end of the shallow cumulus horizontal size
WRR, as cloud size increases; however, it is important to spectrum, CloudSat is limited to observing cloud objects no
point out other factors related to cloud size that may also smaller than 1.4 × 1.8 km. Given prior ground observational
impact WRR. Figure 3 shows WRR is higher when cloud studies, it is likely that there is a significant population of
objects are taller, which may be simply because we are sam- shallow cumulus cloud objects not identified by our study
pling more mature clouds that have had more time for the (e.g., Kollias et al., 2003; Mieslinger et al., 2019) due to non-
collision–coalescence process to result in rain formation. uniform beam filling effects. Battaglia et al. (2020) noted that
Deeper shallow cumulus not only live longer, which would this results in an underestimation of path-integrated attenua-
give cloud droplets more time to grow to raindrop size (e.g., tion, potentially introducing error into the retrieval of WP .
Burnet and Brenguier, 2010), but they are more likely to Unfortunately, this limitation is unavoidable given Cloud-
have more intense updrafts, which could result in more wa- Sat’s horizontal resolution.
ter vapor being transported to higher altitudes within a cloud.
Stronger updrafts are then more likely to be able to suspend
cloud droplets higher in the cloud for longer periods of time, 5 Summary and discussion
which allows them to grow larger before they begin to fall
and collision–coalescence is initiated. Once cloud droplets This study uses the methodology described by Smalley and
do begin to fall, they are not only potentially larger but able Rapp (2020) to classify a large global shallow cumulus cloud
to collect more droplets over a larger distance than droplets object dataset from CloudSat and determine the relationship
falling through a shallower cloud. This could potentially re- between WRR, cloud extent, RH, and aerosol loading. We
sult in higher WRR; however there is likely a lag between the find that WRR increases as a function of cloud size (top
peaks in cloud water path and rainwater path as cloud drops height and extent) and RH. Benner and Curry (1998) found
grow to raindrop size in a developing cloud. Earlier mod- a double power-law distribution in shallow cumulus thick-
eling studies have also noted that turbulent flow potentially ness as a function of cloud diameter, and Trivej and Stevens
enhances the likelihood of warm-rain formation (e.g., Bren- (2010) hypothesized that the shift from one power-law distri-
guier and Chaumat, 2001; Seifert et al., 2010; Wyszogrodzki bution to another results from small shallow cumulus clouds
et al., 2013; Franklin, 2014; Seifert and Onishi, 2016; Chen that can rapidly grow in size until reaching the trade inver-
et al., 2018). Seifert et al. (2010) found that turbulence ef- sion. We find a similar relationship between WRR and ex-
fects are largest near cloud tops in shallow cumulus clouds, tent, showing that one distribution exists with WRR increas-
which they note is an important region for initial rain for- ing faster for extents < 8.4 km and then slowly increasing
mation. While these additional processes may impact WRR, above this breakpoint. Trivej and Stevens (2010) also found
the satellite observations used in this study are instantaneous that environmental factors, particularly RH, become impor-
snapshots in time. We attempted to remove some of these life tant once cloud-top height reaches the trade inversion. Our
cycle impacts by binning cloud objects by top height. Within results show that WRR is most sensitive to RH above an ex-
a given cloud-top height bin, WRR (Fig. 3) and the magni- tent of 8.4 km, which we assume represents the average ex-
tude of VGZCP (Fig. 4c) still increase as a function of extent. tent where cloud objects reach the trade inversion.
While we acknowledge that this cannot fully remove these Unexpectedly, we find that, for a fixed cloud depth, WRR
impacts, these results support the idea that processes other is fairly insensitive to AOD. One explanation may be that,
than those related to cloud lifetime, like lateral entrainment, although high AOD values do occur over the global ocean
may also influence the WRR of shallow cumulus clouds of basins, the majority of cloud objects being sampled still form
different horizontal sizes. in relatively clean air, so the minority of cloud objects occur-
It is surprising that this study identifies shallow cumulus ring over polluted regions have a small impact on the overall
cloud objects larger than 10 km. This suggests that some stra- statistics. Another explanation may be that this analysis only
tocumulus clouds are not being filtered out of this dataset by includes precipitating clouds, so once collision–coalescence
our lower-tropospheric stability threshold. However, a ma- is initiated, the amount of cloud water converted to rainwater
jority of cloud objects that we identify have extents below is less influenced by aerosol concentrations.
10 km. This is consistent with Fig. 1e, which shows that a Past studies conclude that precipitation efficiency in-
majority of cloud objects occur over regions generally asso- creases as SST increases (Lau and Wu, 2003; Bailey et al.,
ciated with shallow cumulus clouds. To further test this, we 2015; Lutsko and Cronin, 2018). Considering warmer SSTs
performed the same analysis over the South Pacific trade re- tend to result in deeper clouds (e.g., Wood and Bretherton,
gion but excluded the southeast stratocumulus region, and we 2004) and more humid environments (e.g., Chen and Liu,
still find few large cloud objects with our overall results and 2016), it is reasonable to expect that WRR would increase
interpretation not changing. This suggests that the predomi- in response (e.g., Lau and Wu, 2003). Our results show that
https://doi.org/10.5194/acp-21-2765-2021 Atmos. Chem. Phys., 21, 2765–2779, 20212774 K. M. Smalley and A. D. Rapp: WRR sensitivity to cloud size, relative humidity, and aerosols Figure 6. The two-dimensional distribution of extent as a function of sea-surface temperature, conditioned by cloud-top height, is shown in panels (a), (c), and (e). The median ratio of cloud water to rainwater (WP WC−1 ) as a function of extent and sea-surface temperature is shown in panels (b), (d), and (f). WRR is highest near the Equator, where SSTs are warmest. these suggest that increasing WRR with SST shown in past However, the general relationship between cloud size (depth studies results not only from the deepening clouds but also and extent), RH, and WRR suggests that WRR is more sen- from the shift towards more frequent larger clouds. sitive to cloud size than RH. To directly address the SST de- The prior literature has shown that modeled shallow cu- pendence, Fig. 6 shows the frequency distribution of extents mulus cores become more adiabatic as they grow larger and the median WRR, both as a function of cloud-top height (Moser and Lasher-Trapp, 2017), potentially resulting in and SST. For a given cloud-top height, WRR does increase larger drops. Figure 6 and our analysis of the relationship as a function of SST. However, for a fixed SST, WRR also between VGZCP , extent, and WRR suggest drop growth is increases as extent increases. Additionally, Fig. 6 shows that being enhanced near the base at the center of larger cloud the frequency distribution of cloud object sizes shifts toward objects, potentially resulting in more cloud water being scav- more frequent larger extents with increasing SST. Together, enged by larger droplets and more efficient autoconversion Atmos. Chem. Phys., 21, 2765–2779, 2021 https://doi.org/10.5194/acp-21-2765-2021
K. M. Smalley and A. D. Rapp: WRR sensitivity to cloud size, relative humidity, and aerosols                                        2775

and accretion processes. Most climate models parameterize              References
autoconversion and accretion as functions of cloud and pre-
cipitation properties (e.g., Lohmann and Roeckner, 1996; Liu           Abel, S. J. and Shipway, B. J.: A comparison of cloud-resolving
and Daum, 2004; Morrison et al., 2005; Lim and Hong, 2010;               model simulations of trade wind cumulus with aircraft observa-
                                                                         tions taken during RICO, Q. J. Roy. Meteor. Soc., 133, 781–794,
Lee and Baik, 2017), but recently enhancement factors that
                                                                         https://doi.org/10.1002/qj.55, 2007.
depend on variations and covariations in WC and WP have                Albrecht, B. A.: Aerosols, Cloud Microphysics, and
been introduced to correct for biases due to subgrid-scale WC            Fractional      Cloudiness,     Science,     245,     1227–1230,
and WP inhomogeneity (e.g., Lebsock et al., 2013; Boutle                 https://doi.org/10.1126/science.245.4923.1227, 1989.
et al., 2014; Witte et al., 2019). Presumably, the dependence          Austin, R. T., Heymsfield, A. J., and Stephens, G. L.: Re-
of these enhancement factors on WC variability would cap-                trieval of ice cloud microphysical parameters using the Cloud-
ture the increase in WRR with cloud depth shown here; how-               Sat millimeter-wave radar and temperature, J. Geophys. Res.-
ever it is unclear if these enhancement factors based on the             Atmos., 114, D00A23, https://doi.org/10.1029/2008JD010049,
variance in WC and WP capture the effects of cloud extent on             2009.
WC and WP , and subsequently WRR. Our dataset provides                 Bailey, A., Nusbaumer, J., and Noone, D.: Precipitation effi-
an opportunity for a future analysis that could focus on in-             ciency derived from isotope ratios in water vapor distinguishes
                                                                         dynamical and microphysical influences on subtropical atmo-
vestigating the relationship between subgrid-scale variability
                                                                         spheric constituents, J. Geophys. Res.-Atmos., 120, 9119–9137,
in WC , WP , WRR, and extent, which could help improve our               https://doi.org/10.1002/2015JD023403, 2015.
understanding and simulation of precipitating shallow cloud            Battaglia, A., Kollias, P., Dhillon, R., Lamer, K., Khairoutdinov,
processes in climate models.                                             M., and Watters, D.: Mind the gap – Part 2: Improving quantita-
                                                                         tive estimates of cloud and rain water path in oceanic warm rain
                                                                         using spaceborne radars, Atmos. Meas. Tech., 13, 4865–4883,
Data availability. ECMWF-AUX (Cronk and Partain, 2017),                  https://doi.org/10.5194/amt-13-4865-2020, 2020.
MOD-06-1KM (Cronk and Partain, 2018), 2B-GEOPROF                       Benner, T. C. and Curry, J. A.: Characteristics of small
(Marchand et al., 2008), 2C-RAIN-PROFILE (Lebsock and                    tropical cumulus clouds and their impact on the en-
L’Ecuyer, 2011), and 2C-PRECIP-COLUMN (Haynes et al., 2009)              vironment, J. Geophys. Res.-Atmos., 103, 28753–28767,
were acquired from the CloudSat Data Processing Center and               https://doi.org/10.1029/98JD02579, 1998.
can be obtained from http://www.cloudsat.cira.colostate.edu (last      Blyth, A. M., Lowenstein, J. H., Huang, Y., Cui, Z., Davies, S.,
access: 20 July 2020).                                                   and Carslaw, K. S.: The production of warm rain in shallow
                                                                         maritime cumulus clouds, Q. J. Roy. Meteor. Soc., 139, 20–31,
                                                                         https://doi.org/10.1002/qj.1972, 2013.
Code and data availability. Please contact the authors for access to   Bony, S. and Dufresne, J.-L.: Marine boundary layer clouds
any dataset created by the analysis and/or the code used to process      at the heart of tropical cloud feedback uncertainties
the CloudSat/MODIS data.                                                 in climate models, Geophys. Res. Lett., 32, L20806,
                                                                         https://doi.org/10.1029/2005GL023851, 2005.
                                                                       Boutle, I. A., Abel, S. J., Hill, P. G., and Morcrette, C. J.: Spa-
Author contributions. KMS performed the analysis, while KMS              tial variability of liquid cloud and rain: observations and mi-
and ADR wrote and edited the manuscript.                                 crophysical effects, Q. J. Roy. Meteor. Soc., 140, 583–594,
                                                                         https://doi.org/10.1002/qj.2140, 2014.
                                                                       Brenguier, J.-L. and Chaumat, L.: Droplet Spectra Broadening
                                                                         in Cumulus Clouds, Part I: Broadening in Adiabatic Cores,
Competing interests. The authors declare that they have no conflict
                                                                         J. Atmos. Sci., 58, 628–641, https://doi.org/10.1175/1520-
of interest.
                                                                         0469(2001)0582.0.CO;2, 2001.
                                                                       Bretherton, C. S., McCaa, J. R., and Grenier, H.: A New
                                                                         Parameterization for Shallow Cumulus Convection and Its
Acknowledgements. We thank the two anonymous reviewers for               Application to Marine Subtropical Cloud-Topped Bound-
their comments and suggestions that helped improve and clarify this      ary Layers, Part I: Description and 1D Results, Mon.
paper.                                                                   Weather Rev., 132, 864–882, https://doi.org/10.1175/1520-
                                                                         0493(2004)1322.0.CO;2, 2004.
                                                                       Burnet, F. and Brenguier, J.-L.: The onset of precipitation in warm
Financial support. This research has been supported by                   cumulus clouds: An observational case-study, Q. J. Roy. Meteor.
the National Aeronautics and Space Administration (grant                 Soc., 136, 374–381, https://doi.org/10.1002/qj.552, 2010.
no. NNX14AO72G).                                                       Chen, B. and Liu, C.: Warm Organized Rain Systems over
                                                                         the Tropical Eastern Pacific, J. Climate, 29, 3403–3422,
                                                                         https://doi.org/10.1175/jcli-d-15-0177.1, 2016.
Review statement. This paper was edited by Timothy Garrett and         Chen, S., Yau, M. K., and Bartello, P.: Turbulence Effects of
reviewed by two anonymous referees.                                      Collision Efficiency and Broadening of Droplet Size Dis-
                                                                         tribution in Cumulus Clouds, J. Atmos. Sci., 75, 203–217,
                                                                         https://doi.org/10.1175/JAS-D-17-0123.1, 2018.

https://doi.org/10.5194/acp-21-2765-2021                                                 Atmos. Chem. Phys., 21, 2765–2779, 2021
2776 K. M. Smalley and A. D. Rapp: WRR sensitivity to cloud size, relative humidity, and aerosols
Cho, H.-M., Zhang, Z., Meyer, K., Lebsock, M., Platnick, S., Heus, T. and Jonker, H. J. J.: Subsiding Shells around
Ackerman, A. S., Di Girolamo, L., C.-Labonnote, L., Cor- Shallow Cumulus Clouds, J. Atmos. Sci., 65, 1003–1018,
net, C., Riedi, J., and Holz, R. E.: Frequency and causes of https://doi.org/10.1175/2007jas2322.1, 2008.
failed MODIS cloud property retrievals for liquid phase clouds Hoffmann, F., Noh, Y., and Raasch, S.: The Route to Rain-
over global oceans, J. Geophys. Res.-Atmos., 120, 4132–4154, drop Formation in a Shallow Cumulus Cloud Simulated by
https://doi.org/10.1002/2015JD023161, 2015. a Lagrangian Cloud Model, J. Atmos. Sci., 74, 2125–2142,
Chong, M. and Hauser, D.: A Tropical Squall Line Observed during https://doi.org/10.1175/JAS-D-16-0220.1, 2017.
the COPT 81 Experiment in West Africa, Part II: Water Budget, Jiang, H. and Feingold, G.: Effect of aerosol on warm convec-
Mon. Weather Rev., 117, 728–744, https://doi.org/10.1175/1520- tive clouds: Aerosol-cloud-surface flux feedbacks in a new cou-
0493(1989)1172.0.CO;2, 1989. pled large eddy model, J. Geophys. Res.-Atmos., 111, D01202,
Christensen, M. W., Stephens, G. L., and Lebsock, M. D.: https://doi.org/10.1029/2005JD006138, 2006.
Exposing biases in retrieved low cloud properties from Jolivet, D. and Feijt, A. J.: Quantification of the accuracy of liq-
CloudSat: A guide for evaluating observations and cli- uid water path fields derived from NOAA 16 advanced very
mate data, J. Geophys. Res.-Atmos., 118, 12120–12131, high resolution radiometer over three ground stations using mi-
https://doi.org/10.1002/2013JD020224, 2013. crowave radiometers, J. Geophys. Res.-Atmos., 110, D11204,
Cronk, H. and Partain, P.: CloudSat ECMWF-AUX Auxillary Data https://doi.org/10.1029/2004JD005205, 2005.
Product Process Description and Interface Control Document, Jung, E., Albrecht, B. A., Feingold, G., Jonsson, H. H., Chuang,
Tech. Rep., Colorado State University, Fort Collins, Colorado, P., and Donaher, S. L.: Aerosols, clouds, and precipitation in
USA, 2017. the North Atlantic trades observed during the Barbados aerosol
Cronk, H. and Partain, P.: CloudSat MOD06-AUX Auxiliary Data cloud experiment – Part 1: Distributions and variability, At-
Process Description and Interface Control Document, Tech. mos. Chem. Phys., 16, 8643–8666, https://doi.org/10.5194/acp-
Rep., Colorado State University, Fort Collins, Colorado, USA, 16-8643-2016, 2016a.
2018. Jung, E., Albrecht, B. A., Sorooshian, A., Zuidema, P., and Jon-
Dagan, G., Koren, I., Altaratz, O., and Heiblum, R. H.: Aerosol sson, H. H.: Precipitation susceptibility in marine stratocumu-
effect on the evolution of the thermodynamic properties lus and shallow cumulus from airborne measurements, Atmos.
of warm convective cloud fields, Sci. Rep.-UK, 6, 38769, Chem. Phys., 16, 11395–11413, https://doi.org/10.5194/acp-16-
https://doi.org/10.1038/srep38769, 2016. 11395-2016, 2016b.
Del Genio, A. D., Kovari, W., Yao, M.-S., and Jonas, J.: Cumu- Klein, S. A. and Hartmann, D. L.: The Sea-
lus Microphysics and Climate Sensitivity, J. Climate, 18, 2376– sonal Cycle of Low Stratiform Clouds, J. Cli-
2387, https://doi.org/10.1175/JCLI3413.1, 2005. mate, 6, 1587–1606, https://doi.org/10.1175/1520-
de Rooy, W. C., Bechtold, P., Fröhlich, K., Hohenegger, C., 0442(1993)0062.0.CO;2, 1993.
Jonker, H., Mironov, D., Pier Siebesma, A., Teixeira, J., and Kollias, P., Albrecht, B. A., and Marks Jr., F. D.: Cloud
Yano, J.-I.: Entrainment and detrainment in cumulus con- radar observations of vertical drafts and microphysics
vection: an overview, Q. J. Roy. Meteor. Soc., 139, 1–19, in convective rain, J. Geophys. Res.-Atmos., 108, 4053,
https://doi.org/10.1002/qj.1959, 2013. https://doi.org/10.1029/2001JD002033, 2003.
Dufresne, J.-L. and Bony, S.: An Assessment of the Primary Koren, I., Dagan, G., and Altaratz, O.: From aerosol-limited to in-
Sources of Spread of Global Warming Estimates from Cou- vigoration of warm convective clouds, Science, 344, 1143–1146,
pled Atmosphere–Ocean Models, J. Climate, 21, 5135–5144, https://doi.org/10.1126/science.1252595, 2014.
https://doi.org/10.1175/2008JCLI2239.1, 2008. Korolev, A., Khain, A., Pinsky, M., and French, J.: Theoretical
Franklin, C. N.: The effects of turbulent collision–coalescence study of mixing in liquid clouds – Part 1: Classical concepts, At-
on precipitation formation and precipitation-dynamical feed- mos. Chem. Phys., 16, 9235–9254, https://doi.org/10.5194/acp-
backs in simulations of stratocumulus and shallow cu- 16-9235-2016, 2016.
mulus convection, Atmos. Chem. Phys., 14, 6557–6570, Lamer, K., Kollias, P., Battaglia, A., and Preval, S.: Mind the
https://doi.org/10.5194/acp-14-6557-2014, 2014. gap – Part 1: Accurately locating warm marine boundary
Gao, W., Liu, L., Li, J., and Lu, C.: The Microphysical layer clouds and precipitation using spaceborne radars, At-
Properties of Convective Precipitation Over the Tibetan mos. Meas. Tech., 13, 2363–2379, https://doi.org/10.5194/amt-
Plateau by a Subkilometer Resolution Cloud-Resolving 13-2363-2020, 2020.
Simulation, J. Geophys. Res.-Atmos., 123, 3212–3227, Lau, K. M. and Wu, H. T.: Warm rain processes over tropical
https://doi.org/10.1002/2017JD027812, 2018. oceans and climate implications, Geophys. Res. Lett., 30, 2290,
Gerber, H. E., Frick, G. M., Jensen, J. B., and Hudson, https://doi.org/10.1029/2003GL018567, 2003.
J. G.: Entrainment, Mixing, and Microphysics in Trade- Lebsock, M. D.: Level 2C RAIN-PROFILE Product Process De-
Wind Cumulus, J. Meteorol. Soc. Jpn., 86A, 87–106, scription and Interface Control Document, Tech. Rep. D-20308,
https://doi.org/10.2151/jmsj.86A.87, 2008. Jet Propulsion Laboratory, California Institute of Technology,
Haynes, J. M., Lecuyer, T. S., Stephens, G. L., Miller, S. D., Pasadena, California, USA, 2018.
Mitrescu, C., Wood, N. B., and Tanelli, S.: Rainfall retrieval over Lebsock, M. D. and L’Ecuyer, T. S.: The retrieval of warm
the ocean with spaceborne W-band radar, J. Geophys. Res., 114, rain from CloudSat, J. Geophys. Res.-Atmos., 116, D20209,
D00A22, https://doi.org/10.1029/2008jd009973, 2009. https://doi.org/10.1029/2011JD016076, 2011.
Lebsock, M. D. and Su, H.: Application of active spaceborne re-
mote sensing for understanding biases between passive cloud
Atmos. Chem. Phys., 21, 2765–2779, 2021 https://doi.org/10.5194/acp-21-2765-2021K. M. Smalley and A. D. Rapp: WRR sensitivity to cloud size, relative humidity, and aerosols 2777 water path retrievals, J. Geophys. Res.-Atmos., 119, 8962–8979, Mieslinger, T., Horvath, A., Buehler, S. A., and Sakradz- https://doi.org/10.1002/2014JD021568, 2014. ija, M.: The Dependence of Shallow Cumulus Macrophys- Lebsock, M. D., L’Ecuyer, T. S., and Stephens, G. L.: Detect- ical Properties on Large-Scale Meteorology as Observed in ing the Ratio of Rain and Cloud Water in Low-Latitude Shal- ASTER Imagery, J. Geophys. Res.-Atmos., 124, 11477–11505, low Marine Clouds, J. Appl. Meteorol. Clim., 50, 419–432, https://doi.org/10.1029/2019JD030768, 2019. https://doi.org/10.1175/2010JAMC2494.1, 2011. Minor, H. A., Rauber, R. M., Göke, S., and Di Girolamo, Lebsock, M. D., Morrison, H., and Gettelman, A.: Microphysi- L.: Trade Wind Cloud Evolution Observed by Polarization cal implications of cloud-precipitation covariance derived from Radar: Relationship to Giant Condensation Nuclei Concentra- satellite remote sensing, J. Geophys. Res.-Atmos., 118, 6521– tions and Cloud Organization, J. Atmos. Sci., 68, 1075–1096, 6533, https://doi.org/10.1002/jgrd.50347, 2013. https://doi.org/10.1175/2010JAS3675.1, 2011. L’Ecuyer, T. S. and Stephens, G. L.: An Estimation-Based Mitrescu, C., L’Ecuyer, T., Haynes, J., Miller, S., and Turk, Precipitation Retrieval Algorithm for Attenuating Radars, J. J.: CloudSat Precipitation Profiling Algorithm–Model Appl. Meteorol., 41, 272–285, https://doi.org/10.1175/1520- Description, J. Appl. Meteorol. Clim., 49, 991–1003, 0450(2002)0412.0.CO;2, 2002. https://doi.org/10.1175/2009JAMC2181.1, 2010. Lee, H. and Baik, J.-J.: A Physically Based Autoconver- Morrison, H., Curry, J. A., and Khvorostyanov, V. I.: A New sion Parameterization, J. Atmos. Sci., 74, 1599–1616, Double-Moment Microphysics Parameterization for Application https://doi.org/10.1175/JAS-D-16-0207.1, 2017. in Cloud and Climate Models, Part I: Description, J. Atmos. Sci., Li, X., Sui, C.-H., and Lau, K.-M.: Precipitation Efficiency in 62, 1665–1677, https://doi.org/10.1175/JAS3446.1, 2005. the Tropical Deep Convective Regime: A 2D Cloud Resolv- Moser, D. H. and Lasher-Trapp, S.: The Influence of Suc- ing Modeling Study, J. Meteorol. Soc. Jpn., 80, 205–212, cessive Thermals on Entrainment and Dilution in a Sim- https://doi.org/10.2151/jmsj.80.205, 2002. ulated Cumulus Congestus, J. Atmos. Sci., 74, 375–392, Lim, K.-S. S. and Hong, S.-Y.: Development of an Ef- https://doi.org/10.1175/JAS-D-16-0144.1, 2017. fective Double-Moment Cloud Microphysics Scheme with Nam, C., Bony, S., Dufresne, J.-L., and Chepfer, H.: Prognostic Cloud Condensation Nuclei (CCN) for Weather The “too few, too bright” tropical low-cloud problem and Climate Models, Mon. Weather Rev., 138, 1587–1612, in CMIP5 models, Geophys. Res. Lett., 39, L21801, https://doi.org/10.1175/2009MWR2968.1, 2010. https://doi.org/10.1029/2012GL053421, 2012. Liu, J. and Li, Z.: Significant Underestimation in the Optically Neubauer, D., Christensen, M. W., Poulsen, C. A., and Lohmann, Based Estimation of the Aerosol First Indirect Effect Induced U.: Unveiling aerosol–cloud interactions – Part 2: Minimising by the Aerosol Swelling Effect, Geophys. Res. Lett., 45, 5690– the effects of aerosol swelling and wet scavenging in ECHAM6- 5699, https://doi.org/10.1029/2018GL077679, 2018. HAM2 for comparison to satellite data, Atmos. Chem. Phys., Liu, Y. and Daum, P. H.: Parameterization of the Au- 17, 13165–13185, https://doi.org/10.5194/acp-17-13165-2017, toconversion Process, Part I: Analytical Formula- 2017. tion of the Kessler-Type Parameterizations, J. At- Pinsky, M., Khain, A., and Korolev, A.: Theoretical analysis of mos. Sci., 61, 1539–1548, https://doi.org/10.1175/1520- mixing in liquid clouds – Part 3: Inhomogeneous mixing, At- 0469(2004)0612.0.CO;2, 2004. mos. Chem. Phys., 16, 9273–9297, https://doi.org/10.5194/acp- Lohmann, U. and Roeckner, E.: Design and performance of a 16-9273-2016, 2016a. new cloud microphysics scheme developed for the ECHAM Pinsky, M., Khain, A., Korolev, A., and Magaritz-Ronen, L.: general circulation model, Clim. Dynam., 12, 557–572, Theoretical investigation of mixing in warm clouds – Part 2: https://doi.org/10.1007/BF00207939, 1996. Homogeneous mixing, Atmos. Chem. Phys., 16, 9255–9272, Lu, C., Liu, Y., Niu, S., and Vogelmann, A. M.: Lateral entrain- https://doi.org/10.5194/acp-16-9255-2016, 2016b. ment rate in shallow cumuli: Dependence on dry air sources and Platnick, S. and Valero, F. P. J.: A Validation of a probability density functions, Geophys. Res. Lett., 39, L20812, Satellite Cloud Retrieval during ASTEX, J. Atmos. https://doi.org/10.1029/2012GL053646, 2012. Sci., 52, 2985–3001, https://doi.org/10.1175/1520- Lutsko, N. J. and Cronin, T. W.: Increase in Precipitation 0469(1995)0522.0.CO;2, 1995. Efficiency With Surface Warming in Radiative-Convective Platnick, S., King, M. D., Ackerman, S. A., Menzel, W. P., Baum, Equilibrium, J. Adv. Model. Earth Sy., 10, 2992–3010, B. A., Riedi, J. C., and Frey, R. A.: The MODIS cloud products: https://doi.org/10.1029/2018MS001482, 2018. algorithms and examples from Terra, IEEE T. Geosci. Remote, Marchand, R., Mace, G. G., Ackerman, T., and Stephens, G.: 41, 459–473, 2003. Hydrometeor Detection Using Cloudsat – An Earth-Orbiting Rauber, R. M., Stevens, B., Ochs, H. T., Knight, C., Albrecht, B. A., 94 GHz Cloud Radar, J. Atmos. Ocean. Tech., 25, 519–533, Blyth, A. M., Fairall, C. W., Jensen, J. B., Lasher-Trapp, S. G., https://doi.org/10.1175/2007JTECHA1006.1, 2008. Mayol-Bracero, O. L., Vali, G., Anderson, J. R., Baker, B. A., Medeiros, B. and Stevens, B.: Revealing differences in GCM Bandy, A. R., Burnet, E., Brenguier, J.-L., Brewer, W. A., Brown, representations of low clouds, Clim. Dynam., 36, 385–399, P. R. A., Chuang, R., Cotton, W. R., Girolamo, L. D., Geerts, B., https://doi.org/10.1007/s00382-009-0694-5, 2011. Gerber, H., Göke, S., Gomes, L., Heikes, B. G., Hudson, J. G., Michel Flores, J., Bar-Or, R. Z., Bluvshtein, N., Abo-Riziq, A., Kollias, P., Lawson, R. R., Krueger, S. K., Lenschow, D. H., Kostinski, A., Borrmann, S., Koren, I., Koren, I., and Rudich, Nuijens, L., O’Sullivan, D. W., Rilling, R. A., Rogers, D. C., Y.: Absorbing aerosols at high relative humidity: linking hygro- Siebesma, A. P., Snodgrass, E., Stith, J. L., Thornton, D. C., scopic growth to optical properties, Atmos. Chem. Phys., 12, Tucker, S., Twohy, C. H., and Zuidema, P.: Rain in Shallow Cu- 5511–5521, https://doi.org/10.5194/acp-12-5511-2012, 2012. mulus Over the Ocean: The RICO Campaign, B. Am. Meteorol. https://doi.org/10.5194/acp-21-2765-2021 Atmos. Chem. Phys., 21, 2765–2779, 2021
You can also read