Quantitative MRI phenotypes capture biological heterogeneity in multiple sclerosis patients
←
→
Page content transcription
If your browser does not render page correctly, please read the page content below
www.nature.com/scientificreports
OPEN Quantitative MRI phenotypes
capture biological heterogeneity
in multiple sclerosis patients
Ide Smets 1,2,3,6, An Goris 1,2,6*, Marijne Vandebergh 1,2, Jelle Demeestere 3
,
Stefan Sunaert 2,4, Patrick Dupont 2,5 & Bénédicte Dubois 1,2,3
Magnetization transfer ratio (MTR) and brain volumetric imaging are (semi-)quantitative MRI markers
capturing demyelination, axonal degeneration and/or inflammation. However, factors shaping
variation in these traits are largely unknown. In this study, we collected a longitudinal cohort of
33 multiple sclerosis (MS) patients and extended it cross-sectionally to 213. We measured MTR in
lesions, normal-appearing white matter (NAWM), normal-appearing grey matter (NAGM) and total
brain, grey matter, white matter and lesion volume. We also calculated the polygenic MS risk score.
Longitudinally, inter-patient differences at inclusion and intra-patient changes during follow-up
together explained > 70% of variance in MRI, with inter-patient differences at inclusion being the
predominant source of variance. Cross-sectionally, we observed a moderate correlation of MTR
between NAGM and NAWM and, less pronounced, with lesions. Age and gender explained about
30% of variance in total brain and grey matter volume. However, they contributed less than 10% to
variance in MTR measures. There were no significant associations between MRI traits and the genetic
risk score. In conclusion, (semi-)quantitative MRI traits change with ongoing disease activity but
this change is modest in comparison to pre-existing inter-patient differences. These traits reflect
individual variation in biological processes, which appear different from those involved in genetic MS
susceptibility.
Multiple sclerosis (MS) is the most common disease of the central nervous system (CNS) in young adults, and
may lead to serious physical and cognitive disability. The disease course is distinguished as presenting with
relapsing–remitting disease at onset (bout onset MS), which may over time convert to a progressive disease, or
with progression from onset (primary progressive MS). Important patient-to-patient heterogeneity is seen for
clinical (e.g. onset, severity) as well as paraclinical (e.g. laboratory measures, imaging) features. MS affects white
and grey matter in the CNS through inflammation, demyelination and axonal degeneration1. Several conventional
and non-conventional imaging outcomes reflect these hallmarks2. T2 MRI sequences with or without gadolinium
administration are typically used to assess inflammatory brain lesions and their evolution. Volumetric brain
measurements quantify gross tissue loss and represent an MRI biomarker of n eurodegeneration3. Finally, a
decreased magnetization transfer ratio (MTR), both in lesions and in normal-appearing white matter (NAWM)
or grey matter (NAGM), correlates with reduced myelin content post-mortem4 and with r emyelination5, although
additional pathologic features may contribute to the MTR signal.
Both brain volume loss and subtle reductions in MTR are apparent early in M S6. Nevertheless, there are strik-
ing patient-to-patient differences. Some patients withstand neurodegeneration better due to differences in brain
and cognitive r eserve7,8, and remyelination can be considerable in some cases while virtually absent in others9.
Most currently used immunomodulating drugs at best only modestly influence the rate of brain volume loss. To
date, we do not understand why patients exhibit these different levels of MTR reduction and brain volume loss.
Moreover, the influence of MS susceptibility genes on these MRI phenotypes is largely unknown. Therefore, it
is unclear whether the immunological pathways influencing susceptibility also shape (semi-)quantitative MRI
1
Laboratory for Neuroimmunology, Department of Neurosciences, KU Leuven, Herestraat 49, Box 1022,
3000 Leuven, Belgium. 2Leuven Brain Institute KU Leuven, Leuven, Belgium. 3Department of Neurology,
University Hospitals Leuven, 3000 Leuven, Belgium. 4Department of Imaging and Pathology, Translational MRI,
KU Leuven, 3000 Leuven, Belgium. 5Department of Neurosciences, Laboratory for Cognitive Neurology, KU
Leuven, 3000 Leuven, Belgium. 6These authors contributed equally: Ide Smets and An Goris. *email: an.goris@
kuleuven.be
Scientific Reports | (2021) 11:1573 | https://doi.org/10.1038/s41598-021-81035-8 1
Vol.:(0123456789)
www.nature.com/scientificreports/
traits10. Such understanding would have important implications for neuroprotective and remyelinating treat-
ment strategies.
Hence, we studied in a longitudinal cohort whether variation in MTR and volumetric indices over time is
(1) primarily influenced by inter-patient demographic differences or by the ongoing MS disease activity. In a
cross-sectional cohort, we scrutinized (2) whether there is a correlation between MTR values in white, grey
matter and lesions and to which extent these MTR values are influenced by (3) demographic variables and (4)
the MS genetic risk score.
Materials and methods
Study population. We included a cross-sectional study population of 213 Caucasian patients, 209 of whom
were finally eligible for genetic analysis (cfr. infra). Longitudinal MRI data obtained on the same and most fre-
quently used scanner protocol were available for 33 of 213 patients. Patients were diagnosed with MS according
to the McDonald 2010 c riteria11 in University Hospitals Leuven, underwent imaging between July 2012 and
February 2017, and donated a blood sample for genetic analysis. Patients provided written informed consent,
and the Ethics committee of the University Hospitals Leuven approved the study (S60222). All research was
performed in accordance with their guidelines. Clinical data were collected during follow-up by the same expert
treating clinician (B.D.). Multiple Sclerosis Severity Score (MSSS) was calculated based on the Expanded Dis-
ability Status Scale (EDSS) and disease duration12.
MRI and image analysis. We obtained and analysed the images as we described previously13. MRI data
were acquired on a 3T MRI scanner (Intera, Ingenia, or Achieva; Philips, Best, The Netherlands) equipped with
an 8-, 15- or 32-channel head coil using parameters corresponding to 6 different MRI protocols as summa-
rized in Supplementary Table S1. All sequences were obtained in the context of routine clinical follow-up at the
Neurology Department of University Hospitals Leuven. The magnetization transfer (MT) imaging data were
obtained by acquiring 2 axial gradient-echo images with and without an off-resonance magnetization transfer
saturation pulse. From the MT sequences, we calculated the MTR value as MTR = 100 × (M0 − Ms)/M0, where
Ms and M0 represent the signal intensity with and without application of the saturation pulse, respectively. The
MTR and 3-dimensional (3D) fast fluid-attenuated inversion recovery (FLAIR) images were co-registered to the
3D-T1 weighted images using statistical parametric mapping (SPM; Welcome Trust Centre for Neuroimaging,
version SPM12). Next, we applied the lesion segmentation toolbox using 20 thresholds for kappa ranging from
0 to 1 in steps of 0.0514. This parameter controls the initialization of a lesion-growing algorithm. Low values of
kappa lead to segmentations of lesions, which can be considered more sensitive but less specific for real lesions,
and the reverse is true for high values of kappa. We used a kappa of 1 for lesion segmentation. This lesion seg-
mentation toolbox requires the 3D T1 and FLAIR images as input and provides the lesion segmentation as well
as a hard segmentation in grey matter, white matter and cerebrospinal fluid (CSF) based on the VBM8 toolbox
(University of Jena). Using this hard segmentation, we defined NAGM and NAWM as voxels belonging to grey
and white matter, respectively, but not belonging to lesions when kappa = 0. We calculated MTR values of the co-
registered image for each tissue class (NAGM, NAWM, and lesions), plotted them in a histogram and extracted
histogram parameters such as median, peak height (expressed as unit percent), peak location and the mean of
the middle 90 percentiles (mean90). We filled the lesions in the 3D-T1 image and soft segmented this image
using SPM12 with the default settings. We calculated volumes of grey and white matter and CSF as the sum of
the soft segmentation classes multiplied with voxel volume. We defined total brain volume as the sum of the
volumes of these three compartments. White matter and grey matter volume were expressed as a percentage of
total brain volume.
Imaging‑related statistical analysis. For the cross-sectional study population, we used the first avail-
able scan of each patient. For the longitudinal cohort, we considered only patients scanned at least twice using
the same and most frequently used scanner protocol. Due to the high inter-correlation between histogram
parameters (Supplementary Table S2), we included only median and peak height MTR in the statistical analy-
sis with Rv3.6.115. For the cross-sectional cohort, we analysed 10 MRI parameters (median and peak height
MTR in lesions, NAWM and NAGM as well as WM, GM, total brain and lesion volume) in function of demo-
graphic (gender, age), clinical (disease duration, OCB status, IgG index, MSSS and treatment status), and genetic
(HLA, non-HLA and total genetic burden) parameters. MRI protocol is always added as categorical covariate,
and age and gender as a continuous covariate for all clinical and genetic analyses. We calculated the percent-
age of variance in MRI traits explained by age and gender by subtracting the adjusted r2 from the full model
(MRI ~ Age + Gender + MRI Protocol) with the adjusted r2 of the baseline model (MRI ~ MRI Protocol).
To quantify intra- versus inter-patient variation in imaging parameters as done previously for immuno-
logical parameters16, we regressed the MRI parameters in function of two generalized linear models. A generic
generalized linear model (MRI ~ Patient identifier code + Time between interval scans) specifically includes a
patient identifier such that it will generate a different intercept for each patient. We calculated the contribution
of the inter- (patient identifier) and intraindividual (time) variation to explained variance in MRI traits in the
generic model with the relaimpo package by subtracting the adjusted r2 of the baseline generic model without
one variable from the adjusted r 2 of the full generic model16,17. After establishing that intra-individual variation
is low compared to inter-individual variation, we subsequently analyzed whether demographical and clinical
parameters age, gender and disease duration can (partially) replace or account for patient identifier as fixed effects
in a clinical generalized linear model (MRI ~ Age + Gender + Disease duration + Time between interval scans) or
whether other, unknown parameters should be invoked to explain inter-individual variation.
Scientific Reports | (2021) 11:1573 | https://doi.org/10.1038/s41598-021-81035-8 2
Vol:.(1234567890)www.nature.com/scientificreports/
Demographical/clinical characteristics Cross-sectional Longitudinal
Number of patients included 213 33
Gender: N female/male (% female) 151/62 (70.9%) 24/9 (72.7%)
Age at onset (years): median (range) 29 (4–68) 27 (4–68)
Disease course: Bout onset/primary progressive/unknown (% bout onset) 208/2/3 (97.6%) 33/0/0 (100.0%)
Disease duration (years): median (range) 8 (0–43) 6 (1–20)
Age at imaging (years): median (range) 39 (19 -71) 36 (19–69)
Interval between first and second scan (months): mean (standard deviation) – 13.2 (7.9)
MSSS at imaging: median (range) 1.61 (0.11–9.45) 1.21 (0.19–8.50)
Oligoclonal bands: positive/negative/unknown (% positive) 175/18/20 (90.6%) 26/4/3 (86.7%)
IgG index: median (range) 0.90 (0.44–4.2) 0.94 (0.5–4.2)
Therapy at imaging: N (%) 133 (62.5%) 21 (63.6%)
None 80 (37.5%) 12 (36.4%)
Interferon-beta 62 (29.1%) 6 (18.1%)
Glatiramer acetate 21 (9.9%) 2 (6.1%)
Teriflunomide 15 (7.0%) 4 (12.1%)
Fingolimod 13 (6.1%) 3 (9.1%)
Natalizumab 14 (6.6%) 5 (15.2%)
Other (dimethyl fumarate and alemtuzumab) 8 (3.8%) 1 (3.0%)
Table 1. Demographics of the study population.
Bonferroni multiple testing correction starting from an overall targeted type I error rate of 5% was applied
separately for the longitudinal cohort (P ≤ 0.0025 for the 10 MRI measures and 2 models described above) and
cross-sectional study population (P ≤ 0.00047 for 10 MRI measures vs. 10 demographic/clinical/genetic variables
described above and 6 tests of median and peak height MTR across the three tissue classes).
Genotyping, quality control and imputation. DNA was extracted from total blood using standard
methods with an in-house protocol. Genotyping for 700,078 variants using the Infinium HTS assay on Global
Screening Array bead-chips (Illumina) followed by genotype calling and quality control (QC) using PLINK v1.9
was done as described previously13,18,19. For one patient no genetic data were available, and three samples were
excluded because of cryptic relatedness (identity by descent > 0.1875). This left a total of 209 patients remaining
in the genetic analysis. In the cleaned sample set we performed variant QC and excluded variants with minor
allele frequency < 1%, call rate < 98% and significant deviation from Hardy–Weinberg equilibrium (P < 10–6).
A total of 502,527 SNPs remained in the analysis. Strand alignment, pre-phasing and imputation were done as
described previously13,18. Classical Human Leukocyte Antigen (HLA) alleles, amino acid polymorphisms and
SNPs were imputed with SNP2HLA v1.0.3 and the T1DGC reference panel (build 37)20.
Polygenic risk score. The latest MS genomic map includes 138 primary, independent autosomal MS risk
factors outside the HLA region as well as 31 statistically independent associations within the HLA r egion10. The
primary autosomal variants were identified in the marginal analysis, i.e. no other variant was included in the
model (step 0). The secondary, conditional variants (not included in our MS genetic risk score), were identified
in a step-wise modelling approach, including variants from previous s teps10. Overall, 133 primary, independent
autosomal SNPs (including 5 proxy SNPs with r 2 > 0.9) as well as 22 statistically independent risk variants in the
HLA region could be extracted from the imputed genetic data (Supplementary Table S4–S5). All SNPs had a
MAF > 1% and genotype imputation info score ≥ 0.8 or genotype imputation r 2 ≥ 0.8 for respectively non-HLA
or HLA SNPs. Subsequently, we calculated the polygenic risk score for each patient with PRSice v2.3.1.e by sum-
ming the allele dosage for each variant weighted by the logarithm of the odds ratio obtained for that variant in
the original susceptibility study10. For each genetic variant, alleles were aligned and matched so that their effects
correspond to an increase in MS risk. Linear regression analyses for polygenic risk scores with MRI parameters
were performed in Rv3.6.1, including age at MRI, sex and MRI protocol as covariates. Single SNP frequentist
association tests for N = 133 non-HLA and N = 22 HLA variants with 10 MRI parameters as variables and age at
MTR, sex and MRI protocol as covariates were performed with SNPTEST v2.5.221.
Data availability. The raw data are available at KU Leuven and will be shared upon request from any quali-
fied investigator pending Institutional Review Board approval and accordance with EU General Data Protection
Regulation.
Results
High inter‑patient differences with low variation over time characterize MRI traits. For the
longitudinal cohort of 33 patients, we obtained two to five scans with the same scanner protocol and with an
average interval of 13.2 ± 7.9 months between the first and second scan (Table 1). Figure 1 depicts the timing of
Scientific Reports | (2021) 11:1573 | https://doi.org/10.1038/s41598-021-81035-8 3
Vol.:(0123456789)www.nature.com/scientificreports/
Figure 1. Timeline of treatment modality, clinical relapses and MRI scans of the longitudinal cohort. Patients
included in the longitudinal cohort (N = 33) were scanned at least twice using the same MRI protocol D (72
scans in total: N = 29 had two scans, N = 3 had three scans, and N = 1 had five scans). The radiology reports
that were generated in the context of routine clinical follow-up at the University Hospitals Leuven allowed to
distinguish between an ‘active’ and ‘stable’ MRI scan at follow-up. Whenever the neuroradiologists mentioned
gadolinium enhancement, new lesions or lesions with an increased volume compared to the preceding MRI scan
this implied coding of the MRI scan as ‘active’ (Image generated with Rv3.6.1, https://www.R-project.org).
MRI scans, clinical relapses during follow-up as well as the applied treatment strategy. In the longitudinal cohort,
we visualized the evolution over time of all included MRI traits in Fig. 2. Next, we modelled the longitudinally
obtained imaging parameters in function of a unique patient identifier code (reflecting inter-patient demo-
graphic variation) and the number of days since the first scan (reflecting intra-patient variation in disease activ-
ity over time). This generic model explained > 70% of variance in MTR (P ≤ 1.85 × 10⁻⁷) and > 82% of variance
in volumetric measures (P ≤ 2.57 × 10⁻¹¹) (Fig. 3A,B). Inter-patient differences at inclusion (≥ 99%) determine
the majority of the explained variance whereas intra-patient heterogeneity contributed only modestly (≤ 1.0%)
(Fig. 3C).
Subsequently, we investigated whether known demographical and clinical patient-specific parameters
explained inter-patient variation. For this purpose, we analyzed the longitudinal imaging parameters in func-
tion of known variables of inter-patient variation (gender, age, disease duration at inclusion) and the number
of days since the first scan. The three patient-specific covariates clarified substantially less of variance in the
total brain and grey matter percentage (r2 ≤ 0.51) compared to the generic model ( r2 ≥ 0.87). Moreover, a model
based on known patient-specific factors could not significantly explain variance in lesion volume, white matter
percentage and MTR parameters ( r2 ≤ 0.10, P ≥ 0.007) (Fig. 3A,B).
MTR traits correlate across tissues within individual patients. In order to increase power to inves-
tigate relevant correlations, we extended our cohort to 213 MS patients with available cross-sectional MRI data
(Table 1). The majority of these patients were female (70.9%) and had a relapsing–remitting disease course
(97.6%). The median age at imaging was 39 years with a median disease duration of 8 years. In the cross-sectional
population, we noted a highly significant correlation between MTR values of different tissue classes (Fig. 4).
Most prominently, MTR correlated moderately between the two types of normal-appearing tissue, NAWM and
NAGM (median: r2 = 0.29, P = 1.04 × 10–56; peak height: r2 = 0.38, P = 7.38 × 10⁻²⁸). MTR reductions in lesions
Scientific Reports | (2021) 11:1573 | https://doi.org/10.1038/s41598-021-81035-8 4
Vol:.(1234567890)www.nature.com/scientificreports/
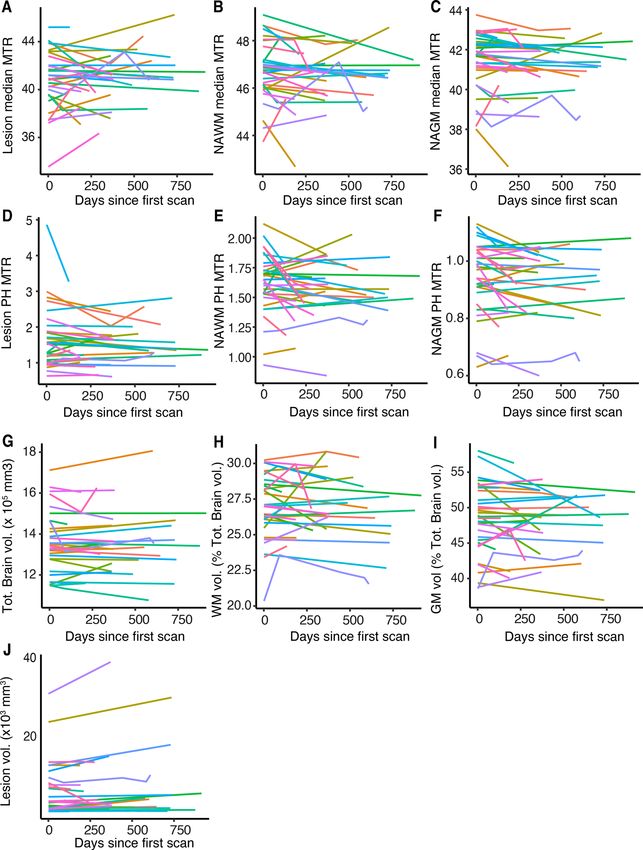
Figure 2. Longitudinal variation in MRI. Longitudinal evolution of (A–C) median and (D–F) peak height
MTR in each tissue class (lesions, NAWM, NAGM) as well as (G) total brain volume, (H) white matter, (J) grey
matter and (I) lesion volume. The same color represents each individual patient (N = 33) throughout the graphs.
All patients were scanned using the same scanner protocol. MTR magnetization transfer ratio, NAWM normal
appearing white matter, NAGM normal appearing grey matter, PH peak height, Tot. total, vol. volume, WM
white matter, GM grey matter (Image generated with Rv3.6.1, https://www.R-project.org).
Scientific Reports | (2021) 11:1573 | https://doi.org/10.1038/s41598-021-81035-8 5
Vol.:(0123456789)www.nature.com/scientificreports/
Figure 3. Contribution of inter- and intra-individual variance in longitudinal MRI data. In the longitudinal
cohort of 33 patients we visualized the (A) percentage of variance explained (= adjusted r2) and (B) significance
in a generic model (black) including a unique patient identifier code (i.e. inter-individual variation) and time
(i.e. intra-individual variation) and a clinical model (grey) including gender, age, disease duration (i.e. known
variables of inter-individual variation) and time. The dotted line represents the cut-off for significance of P ≤ 0.05
after correction for multiple testing (P ≤ 0.0025). (C) The relative contributions of inter-individual and intra-
individual variation over time to the total variance explained in the generic model. PH peak height, NAWM
normal appearing white matter, NAGM normal appearing grey matter, WM white matter, GM grey matter, vol
volume (Image generated with Rv3.6.1, https://www.R-project.org).
paralleled to a lesser extent MTR decrease in NAWM and NAGM (median: r 2 = 0.18–0.13, P ≤ 1.79 × 10⁻¹²; peak
height: r2 = 0.06–0.11, P ≤ 1.37 × 10⁻⁴). These findings highlight correlation in MTR traits across tissues.
Demographic and clinical variables modestly shape MRI traits. Median and peak height MTR
showed substantial variability among patients in lesions, NAWM and NAGM (Fig. 4). Female gender correlated
highly significantly with lower brain volume (P = 1.67 × 10⁻²¹) and higher grey matter percentage (P = 3.58 × 10⁻⁴)
whereas increasing age correlated with lower grey matter percentage (P = 4.57 × 10⁻¹⁶) (Supplementary Table S3).
Age and gender together determined 34 percent of the variance in total brain volume and 30 percent of variance
in grey matter percentage. These observations reflect known physiological correlations and provide validation
for our study. Increasing age was associated with a decrease in peak height MTR, surviving multiple testing
for NAGM and with a trend for NAWM and lesions. Age and gender together determined between 0.6 and
2.0% of the total variance in median MTR traits and 4.4 and 8.4% of total variance in peak height MTR traits,
respectively. The MSSS correlated significantly with increased lesion volume (P = 1.19 × 10⁻⁴). No associations
Scientific Reports | (2021) 11:1573 | https://doi.org/10.1038/s41598-021-81035-8 6
Vol:.(1234567890)www.nature.com/scientificreports/
Figure 4. Correlation of MTR over tissue classes within patients. Correlation of (A) median and (B) peak
height MTR in normal appearing tissues versus median and peak height MTR in lesions. Correlation between
(C) median and (D) peak height MTR in NAWM versus NAGM in the cross-sectional study population
(N = 213). Adjusted r2 and P-values result from linear regression with covariates age, gender and MRI protocol.
The Bonferroni cut-off for significance of P ≤ 0.05 after correction for multiple testing was 0.00047. MTR
magnetization transfer ratio, NAWM normal appearing white matter, NAGM normal appearing grey matter, PH
peak height (Image generated with Rv3.6.1, https://www.R-project.org).
remained significant after correction for multiple testing with regard to disease duration (P ≥ 0.02), presence of
oligoclonal bands (P ≥ 0.07), IgG index (P ≥ 0.13) and treatment status (P ≥ 4.87 × 10⁻⁴). Altogether, demographic
and clinical variables only account for at most 10% or one third of inter-patient heterogeneity in MTR and volu-
metric traits, respectively.
The MS genetic risk score is not associated with MRI traits. We subsequently investigated whether,
in addition to demographic and clinical variables, genes explaining susceptibility to MS play a role in modulating
MTR/volumetric traits. A genetic risk score combining known MS variants was not associated with MTR meas-
ures (P ≥ 0.16) or volumetric indices (P ≥ 0.22) (Fig. 5). This conclusion did not change when evaluating sepa-
rately the non-HLA (P ≥ 0.05) and HLA (P ≥ 0.33) genetic risk score (data not shown). Similarly, the association
of individual risk loci with MTR and volumetric measures did not reveal more nominally significant associations
than expected by chance [non-HLA: 4.51% (60/1330); HLA 2.7% (6/220)] (Supplementary Table S4–S5).
Discussion
In this study, we demonstrated the importance of pre-existing inter-patient differences in explaining variation
in MTR and volumetric measures among patients. Moreover, there was a moderate correlation of MTR across
tissues, especially normal-appearing white and grey matter and to a lesser extent lesions, suggesting a shared
underlying pathway. Longitudinally, the generic model including inter-patient (i.e. differences between patients
at inclusion) as well as intra-patient (i.e. changes occurring over time in each patient) variation could explain
about three quarters of the variance in MTR and volumetric measures. Inter-patient differences were the pre-
dominant source of variation and outweighed disease duration or activity reflected by intra-patient variation.
Other research approaches could similarly highlight intrinsic heterogeneity in degree of myelination. When
lymphocytes from 27 different MS patients were grafted into the demyelinated lesions of nude mice spinal cords,
high and low remyelination patterns were observed22. A longitudinal follow-up study of the myelin content in
lesions of 20 cases with myelin-specific PET tracers documented a large subject-specific heterogeneity in all
indices of myelin content change23. These findings are consistent with anatomo-pathological observations in post-
mortem brain tissue of 51 MS patients. These data showed a profound diversity in remyelination level: a subset
Scientific Reports | (2021) 11:1573 | https://doi.org/10.1038/s41598-021-81035-8 7
Vol.:(0123456789)www.nature.com/scientificreports/
Figure 5. Association of MS genetic risk score with MRI traits. Correlation of (A–C) median and (D–F) peak
height MTR across tissues as well as (G–J) volumetric measurements with MS genetic risk score calculated
based on known HLA (N = 22) and non-HLA (N = 133) risk variants in the cross-sectional study population
(N = 209). P-values were calculated from linear regression including age, gender and protocol as covariates.
NAGM normal appearing grey matter, NAWM normal appearing white matter, PH peak height, GM grey matter,
WM white matter, vol. volume, MS multiple sclerosis, HLA human leukocyte antigen (Image generated with
Rv3.6.1, https://www.R-project.org).
displayed extensive remyelination whereas in others remyelination was s parse9. Furthermore, many studies have
tried to correlate MTR changes over short to medium time intervals with disease e volution24–27. However, these
observational studies require lengthy patient follow-up as differences between patients and controls are subtle
and easily overshadowed by inter-patient differences at baseline28–30. The best illustration is a 13-year follow-up
cohort of MS patients where only MTR and grey matter fraction at baseline and not the change within the first
year of follow-up could predict disability or cognitive d ecline27. Overall, our study does not contradict modest
longitudinal change with age and disease duration but demonstrates it is substantially smaller than variation
between patients.
The abovementioned literature could only limitedly clarify why patients differ regarding remyelination capac-
ity. The studies mentioned n o22 or modest associations with age, disease d uration9,23 and disability level23 and
the bulk of inter-patient differences remained unexplained. Apart from the association between peak height
and age, MTR measures were only limitedly and not consistently associated with clinical or demographical
values across tissues in our work. On the other hand, association of age and gender with brain volume measures
is well e stablished31–33 providing a validation for our dataset. Indeed, together with disease duration, age and
gender explained between 30 and 50 percent of the variance in total brain and grey matter volume. Altogether,
Scientific Reports | (2021) 11:1573 | https://doi.org/10.1038/s41598-021-81035-8 8
Vol:.(1234567890)www.nature.com/scientificreports/
quantitative MRI parameters might reflect variation between patients in underlying biological processes which
could partially be driven by genetics.
Epidemiological studies indeed indicate a genetic basis for variation in MTR, as MTR is decreased to a
greater extent in patients with a higher familial burden of disease34,35. To date, 200 non-HLA autosomal genetic
risk factors for MS, of which 138 are primary, independent effects, as well as 32 statistically independent HLA
risk factors have been e stablished10,36–38. We summarized the combined effect of these genetic associations in
the MS genetic risk score. We previously demonstrated that the MS genetic risk score is correlated with CSF
antibody production (HLA burden)39. In this study, we did not observe an association of MS genetic risk score
with MTR or volumetric measures. This is in line with the absence of genetic associations with disease course
(relapsing–remitting versus primary progressive) or severity40,41. Similarly, individual HLA alleles did not influ-
ence the examined MRI traits. This contrasts with the prominent role HLA-DRB*1501 fulfills in susceptibility.
In literature, the association with HLA is debated. Some smaller studies highlight the role of HLA-DRB1*15
on the accumulation of microstructural brain d amage42,43 whereas others refute t his44,45. The MS genetic risk
factors involve mainly the innate and adaptive immune system10, but other pathways may control presentation
of disease after onset.
Demyelination has been proposed to be the major pathologic substrate for decreased MTR, but additional
pathologic features may contribute to the MTR signal. Increased numbers of enlarged microglia/macrophages
contribute to MTR abnormalities in NAWM and even more prominently in l esions46. In MS active lesions, these
innate immune cells increase already in initial lesion stages and reach their peak in early/late active lesion a reas47.
Microglia-related CSF biomarkers at diagnosis correlate with MTR measured more than 3 years later in a subset
of the current study population13. In particular, chitotriosidase or CHIT1 levels increase with increasing MTR
abnormalities (decreasing MTR) in lesions, and explain 12% of variance in median lesion MTR across patients.
Clinical or demographical covariates did not add to the variance explained, and a trend similar to MTR in lesions
was seen for MTR in NAGM and NAWM. This is in line with the conclusions of our current work indicating a
partially shared biological pathway underlying variation in MTR that is correlated across tissues and inherent
to a patient but is not influenced by demographic or clinical variables.
The real-life setting of the study allowed us to collect a large patient population but inherently introduced
technical variation since different MRI scanners and MRI scanning protocols were used in daily practice. To
take into account this inter-protocol variability, we introduced the five distinct MRI protocols as a covariate
in the linear regression model, and only assessed patients that were scanned twice using the same protocol for
the longitudinal analysis. Replication of known effects provides validation for this strategy. Furthermore, we
acknowledge that next to MT imaging also other informative myelin imaging techniques exist such as myelin
water imaging and diffusion tensor imaging48. However, MT imaging is technically and logistically the most
standardized and feasible t echnique48. Therefore, it is the only technique that allows to be integrated in clinical
MRI scanning protocols with typically short time slots.
Our study addresses the determinants of variation in MTR and volumetric traits. We posit that (semi-)quan-
titative MRI traits change with ongoing disease activity or duration but that this change is modest in comparison
to the pre-existing inter-patient differences. Hence, MTR and volumetric indices reflect individual variation in
biological processes which is not driven by the known MS genetic susceptibility variants. Additional large-scale
genetic studies are required to unravel the pathways associated with MRI heterogeneity.
Received: 15 September 2020; Accepted: 23 December 2020
References
1. Thompson, A. J., Baranzini, S. E., Geurts, J., Hemmer, B. & Ciccarelli, O. Multiple sclerosis. Lancet 6736, 1–15 (2018).
2. Barkhof, F., Calabresi, P. A., Miller, D. H. & Reingold, S. C. Imaging outcomes for neuroprotection and repair in multiple sclerosis
trials. Nat. Rev. Neurol. 5, 256–266 (2009).
3. De Stefano, N. et al. Clinical relevance of brain volume measures in multiple sclerosis. CNS Drugs 28, 147–156 (2014).
4. Schmierer, K., Scaravilli, F., Altmann, D. R., Barker, G. J. & Miller, D. H. Magnetization transfer ratio and myelin in postmortem
multiple sclerosis brain. Ann. Neurol. 56, 407–415 (2004).
5. van den Elskamp, I. J. et al. Lesional magnetization transfer ratio: A feasible outcome for remyelinating treatment trials in multiple
sclerosis. Mult. Scler. 16, 660–669 (2010).
6. Fernando, K. T. M. et al. Magnetization transfer histograms in clinically isolated syndromes suggestive of multiple sclerosis. Brain
128, 2911–2925 (2005).
7. Sumowski, J. F. et al. Brain reserve against physical disability progression over 5 years in multiple sclerosis. Neurology 86, 2006–2009
(2016).
8. Rocca, M. et al. Clinical and imaging assessment of cognitive dysfunction in multiple sclerosis. Lancet Neurol. 14, 302–317 (2015).
9. Patrikios, P. et al. Remyelination is extensive in a subset of multiple sclerosis patients. Brain 129, 3165–3172 (2006).
10. International Multiple Sclerosis Genetics Consortium et al. Multiple sclerosis genomic map implicates peripheral immune cells
and microglia in susceptibility. Science 365, 1–43 (2019).
11. Polman, C. H. et al. Diagnostic criteria for multiple sclerosis: 2010 revisions to the McDonald criteria. Ann. Neurol. 69, 292–302
(2011).
12. Roxburgh, R. H. S. R. et al. Multiple Sclerosis Severity Score: Using disability and disease duration to rate disease severity. Neurol-
ogy 64, 1144–1151 (2005).
13. Oldoni, E. et al. CHIT1 at diagnosis reflects long-term multiple sclerosis disease activity. Ann. Neurol. 87, 633–645 (2020).
14. Roura, E. et al. A toolbox for multiple sclerosis lesion segmentation. Neuroradiology 57, 1031–1043 (2015).
15. R Core Team. R: A Language and Environment for Statistical Computing (R Foundation for Statistical Computing, Vienna, 2020).
16. Carr, E. J. et al. The cellular composition of the human immune system is shaped by age and cohabitation. Nat. Immunol. 17,
461–468 (2016).
17. Grömping, U. Relative importance for linear regression in R: The package relaimpo. J. Stat. Softw. 17, 1–27 (2006).
Scientific Reports | (2021) 11:1573 | https://doi.org/10.1038/s41598-021-81035-8 9
Vol.:(0123456789)www.nature.com/scientificreports/
18. Lagou, V. et al. Genetic architecture of adaptive immune system identifies key immune regulators. Cell Rep. 25, 798-810.e6 (2018).
19. Purcell, S. et al. PLINK: A tool set for whole-genome association and population-based linkage analyses. Am. J. Hum. Genet. 81,
559–575 (2007).
20. Jia, X. et al. Imputing amino acid polymorphisms in human leukocyte antigens. PLoS ONE 8, e64683 (2013).
21. Marchini, J., Howie, B., Myers, S., McVean, G. & Donnelly, P. A new multipoint method for genome-wide association studies by
imputation of genotypes. Nat. Genet. 39, 906–913 (2007).
22. El Behi, M. et al. Adaptive human immunity drives remyelination in a mouse model of demyelination. Brain 140, 967–980 (2017).
23. Bodini, B. et al. Dynamic imaging of individual remyelination profiles in multiple sclerosis. Ann. Neurol. 79, 726–738 (2016).
24. Rocca, M. A., Mastronardo, G., Rodegher, M., Comi, G. & Filippi, M. Long-term changes of magnetization transfer-derived
measures from patients with relapsing-remitting and secondary progressive multiple sclerosis. Am. J. Neuroradiol. 20, 821–827
(1999).
25. Rovaris, M. et al. Conventional and magnetization transfer MRI predictors of clinical multiple sclerosis evolution: A medium-term
follow-up study. Brain 126, 2323–2332 (2003).
26. Mesaros, S. et al. Bimonthly assessment of magnetization transfer magnetic resonance imaging parameters in multiple sclerosis:
A 14-month, multicentre, follow-up study. Mult. Scler. 16, 325–331 (2010).
27. Filippi, M. et al. Gray matter damage predicts the accumulation of disability 13 years later in MS. Neurology 81, 1759–1767 (2013).
28. Fisniku, L. K. et al. Disability and T2 MRI lesions: A 20-year follow-up of patients with relapse onset of multiple sclerosis. Brain
131, 808–817 (2008).
29. Biberacher, V. et al. Intra- and interscanner variability of magnetic resonance imaging based volumetry in multiple sclerosis.
Neuroimage 142, 188–197 (2016).
30. De Stefano, N. et al. Establishing pathological cut-offs of brain atrophy rates in multiple sclerosis. J. Neurol. Neurosurg. Psychiatry
87, 93–99 (2016).
31. Newbould, R. D. et al. Age independently affects myelin integrity as detected by magnetization transfer magnetic resonance imag-
ing in multiple sclerosis. NeuroImage Clin. 4, 641–648 (2014).
32. Mascalchi, M. et al. Gender, age-related, and regional differences of the magnetization transfer ratio of the cortical and subcortical
brain gray matter. J. Magn. Reson. Imaging 40, 360–366 (2014).
33. Smith, C. D., Chebrolu, H., Wekstein, D. R., Schmitt, F. A. & Markesbery, W. R. Age and gender effects on human brain anatomy:
A voxel-based morphometric study in healthy elderly. Neurobiol. Aging 28, 1075–1087 (2007).
34. Weinstock-Guttman, B. et al. Increased tissue damage and lesion volumes in African Americans with multiple sclerosis. Neurology
74, 538–544 (2010).
35. De Stefano, N. et al. Brain damage as detected by magnetization transfer imaging is less pronounced in benign than in early relaps-
ing multiple sclerosis. Brain 129, 2008–2016 (2006).
36. International Multiple Sclerosis Genetics Consortium et al. Risk alleles for multiple sclerosis identified by a genomewide study.
N. Engl. J. Med. 357, 851–862 (2007).
37. International Multiple Sclerosis Genetics Consortium (IMSGC) et al. Analysis of immune-related loci identifies 48 new suscep-
tibility variants for multiple sclerosis. Nat. Genet. 45, 1353–1360 (2013).
38. Moutsianas, L. et al. Class II HLA interactions modulate genetic risk for multiple sclerosis. Nat. Genet. 47, 1107–1113 (2015).
39. Goris, A. et al. Genetic variants are major determinants of CSF antibody levels in multiple sclerosis. Brain 138, 632–643 (2015).
40. Hilven, K., Patsopoulos, N., Dubois, B. & Goris, A. Burden of risk variants correlates with phenotype of multiple sclerosis. Mult.
Scler. 21, 1670–1680 (2015).
41. International Multiple Sclerosis Genetics Consortium, Briggs, F. B. S., Shao, X., Goldstein, B. & Oksenberg, J. R. Genome-wide
association study of severity in multiple sclerosis. Genes Immun. 12, 615–625 (2011).
42. Tur, C. et al. HLA-DRB1*15 influences the development of brain tissue damage in early PPMS. Neurology 83, 1712–1718 (2014).
43. Isobe, N. et al. Association of HLA genetic risk burden with disease phenotypes in multiple sclerosis. JAMA Neurol. 94158, 1–8
(2016).
44. Mühlau, M., Andlauer, T. F. M. & Hemmer, B. HLA genetic risk burden in multiple sclerosis. JAMA Neurol. 73, 1500–1501 (2016).
45. Yaldizli, Ö. et al. HLA-DRB*1501 associations with magnetic resonance imaging measures of grey matter pathology in multiple
sclerosis. Mult. Scler. Relat. Disord. 7, 47–52 (2016).
46. Moll, N. M. et al. Multiple sclerosis normal-appearing white matter: Pathology-imaging correlations. Ann. Neurol. 70, 764–773
(2011).
47. Zrzavy, T. et al. Loss of ‘homeostatic’ microglia and patterns of their activation in active multiple sclerosis. Brain 140, 1900–1913
(2017).
48. Enzinger, C. et al. Nonconventional MRI and microstructural cerebral changes in multiple sclerosis. Nat. Rev. Neurol. 11, 676–686
(2015).
Acknowledgements
We thank the patients who participated in this study, Katleen Clysters and Cindy Thys for their help in sample
collection, Ronald Peeters, Hilde Vandenhout and Stefan Ghysels for their help in organizing the scanning logis-
tics, and the High-Throughput Genomics Group at the Wellcome Trust Centre for Human Genetics (funded by
Wellcome Trust grant reference 090532/Z/09/Z) for the generation of the sequencing data.
Author contributions
All authors contributed to the study conception and design. Patient recruitment and data collection was done by
I.S., S.S. and B.D. Data processing and analyses were performed by I.S., A.G., M.V., J.D. and P.D. The first draft
of the manuscript was written by I.S. and all authors commented on previous versions of the manuscript. All
authors read and approved the final manuscript.
Funding
BD is a Clinical Investigator and MV and JD are PhD fellows of the Research Foundation Flanders (FWO-
Vlaanderen). IS is an ECTRIMS Clinical Fellow. This project is supported by the Research Fund KU Leuven
(C24/16/045), the Research Foundation Flanders (G073415N), and the Belgian Charcot Foundation. AG is sup-
ported by MS Liga Vlaanderen and the Queen Elisabeth Medical Foundation. The computational resources and
services used in this work were provided by the VSC (Flemish Supercomputer Center), funded by the Research
Foundation—Flanders (FWO) and the Flemish Government—department EWI.
Scientific Reports | (2021) 11:1573 | https://doi.org/10.1038/s41598-021-81035-8 10
Vol:.(1234567890)www.nature.com/scientificreports/
Competing interests
BD has received consulting fees and/or funding from Biogen Idec, Merck, Sanofi, Roche, Novartis and TEVA
Pharma Nederland. AG has received consulting/travel fees and/or research funding from Novartis, Roche and
Merck. IS, MV, JD, SS and PD have nothing to disclose.
Additional information
Supplementary Information The online version contains supplementary material available at https://doi.
org/10.1038/s41598-021-81035-8.
Correspondence and requests for materials should be addressed to A.G.
Reprints and permissions information is available at www.nature.com/reprints.
Publisher’s note Springer Nature remains neutral with regard to jurisdictional claims in published maps and
institutional affiliations.
Open Access This article is licensed under a Creative Commons Attribution 4.0 International
License, which permits use, sharing, adaptation, distribution and reproduction in any medium or
format, as long as you give appropriate credit to the original author(s) and the source, provide a link to the
Creative Commons licence, and indicate if changes were made. The images or other third party material in this
article are included in the article’s Creative Commons licence, unless indicated otherwise in a credit line to the
material. If material is not included in the article’s Creative Commons licence and your intended use is not
permitted by statutory regulation or exceeds the permitted use, you will need to obtain permission directly from
the copyright holder. To view a copy of this licence, visit http://creativecommons.org/licenses/by/4.0/.
© The Author(s) 2021
Scientific Reports | (2021) 11:1573 | https://doi.org/10.1038/s41598-021-81035-8 11
Vol.:(0123456789)You can also read