Public Hearing Draft 12-2021 Adopted: XX, XX 2022 - Oneida ...
←
→
Page content transcription
If your browser does not render page correctly, please read the page content below
Public Hearing Draft 12-2021 Adopted: XX, XX 2022
Oneida Charter Township Master Plan 2021 – 2041

Prepared by the Township Board
   •   Donald Cooley, Supervisor
   •   Jacqueline Kilgore, Clerk
   •   Melissa Goschka, Treasurer and Zoning Administrator
   •   Christopher Arndt
   •   Jim Green
   •   Madelyne Lawry
   •   Janet Schultz

Prepared by the Planning Commission
   •   Sue Dembowski
   •   Jim Green
   •   Justin Kilgore
   •   Chris Kuhlman
   •   Carol Scherer
   •   Fay Schroeder
   •   Robert Stahelin
   •   Mike Walters

Planning Assistance Provided by:
ROWE Professional Services Company
540 S. Saginaw Street, Suite 200
Flint, MI 48502
Oneida Charter Township
Master Plan
Table of Contents
Chapter 1 Introduction ........................................................................................................................... 1-1
What is a Master Plan? .......................................................................................................................... 1-1
Community Character ........................................................................................................................ 1-2
Adaptability of Land ........................................................................................................................... 1-2
Community Needs.............................................................................................................................. 1-2
Available Services ............................................................................................................................... 1-2
Existing Development ........................................................................................................................ 1-2
Regional Planning............................................................................................................................... 1-2
The Master Plan and Zoning Ordinance................................................................................................. 1-2
Using the Plan ........................................................................................................................................ 1-3
Refer to the Master Plan in all Zoning Decisions ............................................................................... 1-3
Encourage other Decision-Making Bodies to use the Master Plan ................................................... 1-3
Keep the Plan Current ........................................................................................................................ 1-3
How Does the Master Plan Affect You as a Resident or Landowner? ................................................... 1-3
How Should You Use This Plan? ......................................................................................................... 1-3
Conclusion .............................................................................................................................................. 1-4
Chapter 2 Community Profile ................................................................................................................. 2-1
Understanding Our Community ............................................................................................................. 2-1
Location.................................................................................................................................................. 2-1
Population Characteristics ..................................................................................................................... 2-2
Population .............................................................................................................................................. 2-2
Overall Character ................................................................................................................................... 2-6
Economic Characteristics ....................................................................................................................... 2-6
Housing Characteristics........................................................................................................................ 2-10
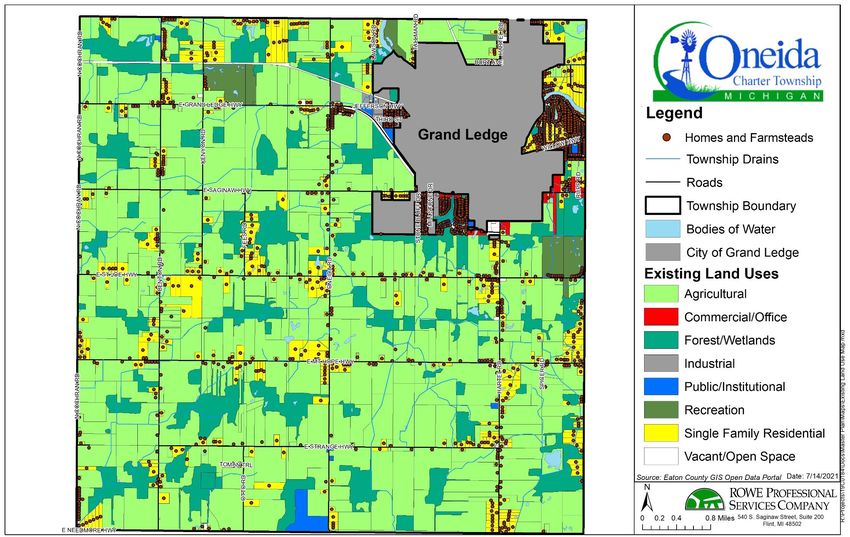
Chapter 3 Land Use Inventory ................................................................................................................ 3-1
Agricultural............................................................................................................................................. 3-2
Forest/Wetlands .................................................................................................................................... 3-3
Single Family Residential........................................................................................................................ 3-3
Recreation .............................................................................................................................................. 3-3
Public and Institutional .......................................................................................................................... 3-4
Industrial ................................................................................................................................................ 3-4
Commercial ............................................................................................................................................ 3-4
ii
Oneida Charter Township
Master Plan
Vacant/Open Space ............................................................................................................................... 3-5
Chapter 4 Agricultural and Natural Resources ....................................................................................... 4-1
Agriculture in Oneida Township ............................................................................................................ 4-1
Farmland and Development Conflicts ............................................................................................... 4-3
Zoning Techniques For Farmland Preservation ................................................................................. 4-3
Other Farmland Preservation Techniques ......................................................................................... 4-6
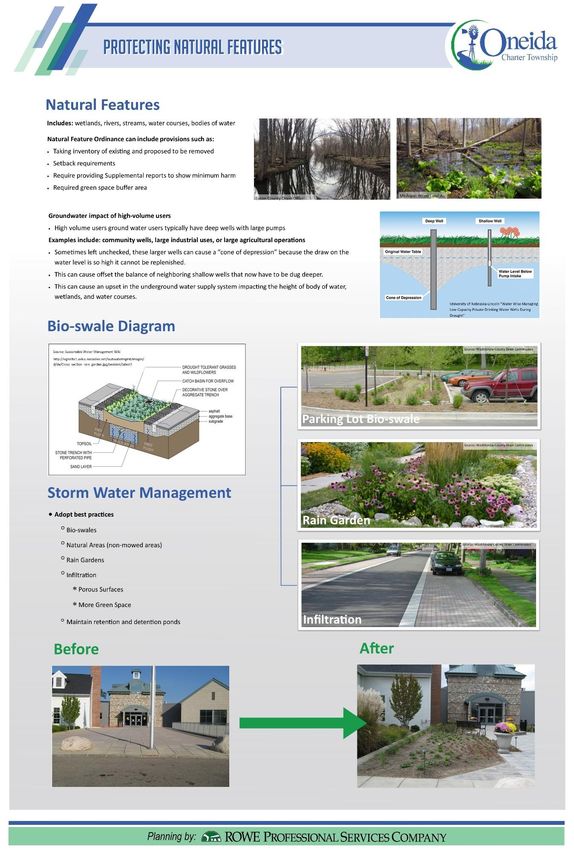
Natural Features in Oneida Township ................................................................................................... 4-7
Wetlands ............................................................................................................................................ 4-8
Floodplains ......................................................................................................................................... 4-8
Protection of Environmentally Sensitive Areas - Preservation and Integration .............................. 4-10
Chapter 5 Public Services and Community Facilities .............................................................................. 5-1
Public Amenities in Oneida Township ................................................................................................... 5-1
Public Utilities .................................................................................................................................... 5-1
Public Roads ....................................................................................................................................... 5-3
Government Facilities ........................................................................................................................ 5-5
Recreational Facilities ........................................................................................................................ 5-5
Education Facilities ............................................................................................................................ 5-5
Chapter 6 Public Engagement................................................................................................................. 6-1
Community Attitude Survey................................................................................................................... 6-1
Survey Analysis................................................................................................................................... 6-1
Summary of Survey Results................................................................................................................ 6-3
Master Plan Town Hall ........................................................................................................................... 6-3
Master Plan Open House ....................................................................................................................... 6-4
Master Plan Open House Survey Analysis ......................................................................................... 6-5
Summary of Master Plan Open House Survey Results ...................................................................... 6-6
Chapter 7 Goals, Objectives, and Strategies........................................................................................... 7-1
Future Directions ................................................................................................................................... 7-1
Goals and Objectives.............................................................................................................................. 7-1
Agricultural/Open Space Preservation .............................................................................................. 7-1
Natural Features and the Environment ............................................................................................. 7-2
Residential Growth and Development............................................................................................... 7-3
Commercial/Industrial Growth and Development ............................................................................ 7-4
Community Facilities and Services ..................................................................................................... 7-4
iii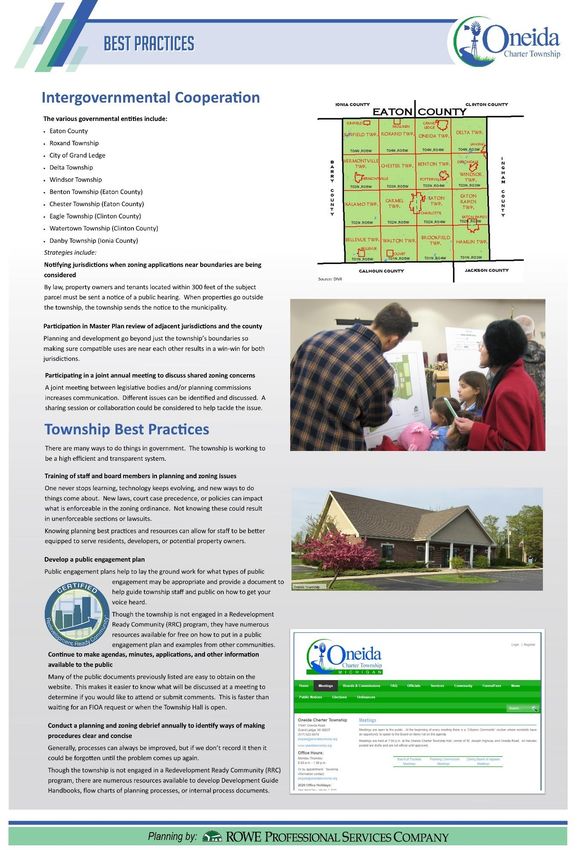
Oneida Charter Township
Master Plan
Best Practices ..................................................................................................................................... 7-5
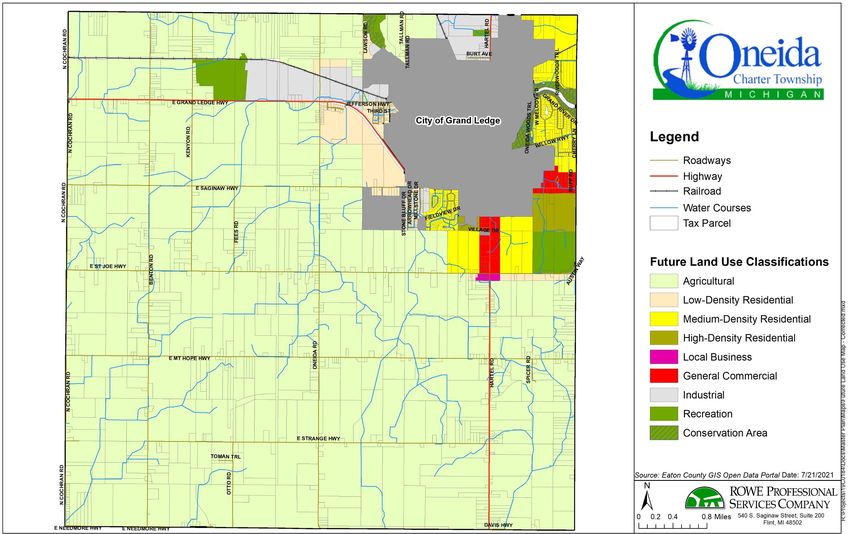
Chapter 8 Future Land Use Plan ............................................................................................................. 8-1
Future Land Use Classification ............................................................................................................... 8-1
Future Land Use Map ............................................................................................................................. 8-6
Zoning Plan............................................................................................................................................. 8-8
Chapter 9 Implementation Plan.............................................................................................................. 9-1
Strategies ............................................................................................................................................... 9-1
Plan Maintenance and Update .............................................................................................................. 9-1
Annual Report .................................................................................................................................... 9-2
Five-Year Review ................................................................................................................................ 9-2
Using the Master Plan in Rezoning and Text Amendments............................................................... 9-4
Appendices
Appendix A : Community Attitude Survey ................................................................................................. A-I
Appendix B : Open House Boards ...............................................................................................................B-I
Appendix C : Master Plan Adoption Process............................................................................................... C-I
Tables
Table 2-1 Population Growth Trends 1970-2019 ...................................................................................... 2-3
Table 2-2 Median Age, 1990-2019 ............................................................................................................. 2-4
Table 2-3 2019 Household Types ............................................................................................................... 2-4
Table 2-4 Education Attainment, 2019 ...................................................................................................... 2-5
Table 2-5 Income, 2019 ............................................................................................................................. 2-6
Table 2-6 Occupations ............................................................................................................................... 2-8
Table 2-7 Income Source, 2019.................................................................................................................. 2-9
Table 2-8 Poverty Status, 2019 ................................................................................................................ 2-10
Table 2-9 Oneida Township Housing Types ............................................................................................. 2-10
Table 2-10 Years Structures Were Built in Oneida Township .................................................................. 2-11
Table 2-11 Number of Occupied Dwelling Units, 2000-2019 .................................................................. 2-12
Table 2-12 House Value, 2019 ................................................................................................................. 2-12
Table 2-13 Gross Rent, 2019 .................................................................................................................... 2-13
Table 3-1 Existing Land Use Change 2002 - 2019 ...................................................................................... 3-2
Table 4-1 Sliding Scale (Example)............................................................................................................... 4-4
Table 6-1 Residency Length ....................................................................................................................... 6-1
Table 6-2 Prouds and Sorries Exercise Results........................................................................................... 6-4
iv
Oneida Charter Township
                                                                                                                                  Master Plan

Maps
Map 2-1 Location ....................................................................................................................................... 2-1
Map 3-1 Existing Land Use ......................................................................................................................... 3-6
Map 4-1 Township Prime Farmland........................................................................................................... 4-2
Map 4-2 National Wetlands Inventory ...................................................................................................... 4-8
Map 4-3 Oneida Township Topography Map ............................................................................................ 4-9
Map 4-4: Floodplain northwest of the City of Grand Ledge .................................................................... 4-10
Map 4-5: Floodplain east of the City of Grand Ledge .............................................................................. 4-10
Map 5-1 Sanitary Sewer Master Plan ........................................................................................................ 5-2
Map 5-2 Wellhead Protection Area ........................................................................................................... 5-3
Map 5-3 Township Road Types .................................................................................................................. 5-4
Map 5-4 Township School Districts............................................................................................................ 5-6
Map 8-1 Future Land Use........................................................................................................................... 8-7

Figures
Figure 2-1 Oneida Township Population 1970-2019 ................................................................................. 2-2
Figure 2-2 Population 1970-2019 .............................................................................................................. 2-3
Figure 2-3 Age Profile................................................................................................................................. 2-4
Figure 2-4 Average Household Size, 2000-2019 ........................................................................................ 2-5
Figure 2-5 Educational Attainment ............................................................................................................ 2-5
Figure 2-6 Oneida Township Household Income ....................................................................................... 2-7
Figure 2-7 Eaton County Household Income ............................................................................................. 2-7
Figure 2-8 State of Michigan Household Income....................................................................................... 2-7
Figure 2-9 Oneida Township Housing Unit Occupancy............................................................................ 2-11
Figure 2-10 Eaton County Unit Occupancy .............................................................................................. 2-12
Figure 2-11 State of Michigan Unit Occupancy ....................................................................................... 2-12
Figure 2-12 Selected Monthly Owner Costs as a Percentage of Household Income, 2019..................... 2-14
Figure 2-13 Gross Rent as a Percentage of Household Income, 2019 ..................................................... 2-14
Figure 3-1 Breakdown of Existing Land Usage in Oneida Township 2019 ................................................. 3-1
Figure 4-1 Continuum of Protection of Farmland / Rural Character ......................................................... 4-3
Figure 4-2 Quarter/Quarter Zoning ........................................................................................................... 4-5
Figure 4-3 Open Space (Cluster) Development.......................................................................................... 4-5
Figure 6-1 Preference for Alternative Energy Development ..................................................................... 6-3
Figure 6-2 Open House Board on Residential, Commercial and Industrial Growth .................................. 6-5
Figure 6-3 Open House Board on Protecting Natural Features ................................................................. 6-6

                                                                             v
Oneida Charter Township
                                                                                               Master Plan

    Chapter 1            Introduction

What is a Master Plan?
Responsibility for developing a Master Plan rests with the township Planning Commission in consultation
with the Township Board, citizens, the county, neighboring communities, the Tri-County Regional Planning
Commission (TCRPC), and other parties representing the public interest. This Master Plan has been
adopted by Oneida Charter Township to ensure that the decisions made regarding the use of land are
based on a sound vision that will enhance the quality of life for township residents. This Master Plan is
intended to ensure that the township’s desires regarding future development are translated into action;
one rezoning, one plan review, one special land use approval, and one variance at a time.
The Master Plan consists of several major elements and activities, including long-range development
Goals and Objectives, Future Land Use, and Public Input.
    •   Long-range development Goals and Objectives define how
        the township will deal with community concerns and protect
        its community character;
    •   The Future Land Use text describes what types of new
        development the township believes would be most
        appropriate in the community, and suitable locations for
        that development;
    •   The Future Land Use Map is an illustration of the long-range
        land use pattern of the township; and
    •   Public input is an essential component to the Master Plan
        process; it is important to understand what township
        residents think of the issues and what they want.
When combined, these pieces fit together to create a picture for the future of Oneida Charter Township.
It is important to remember that the Master Plan will not be fulfilled overnight; as a plan for the future, it
is intended to guide decisions made one day at a time. Accordingly, the Master Plan cannot be rigidly
administered; changing conditions that can affect the original intent of the Master Plan should be
acknowledged. The Master Plan is intended to be flexible so that these changes can be accommodated.
On the other hand, while the Master Plan needs to be flexible, its recommendations should not be taken
lightly. Adjustments should be made only when necessary, and justified on changing conditions or shifts
in community philosophy. The Planning Commission should regularly review the Master Plan to ensure
that the township remains on the right track to achieve the future it desires.
The Master Plan can be used in a number of ways, but above all it should be consulted whenever land use
decisions are to be made. Oneida Charter Township may also wish to add other elements to the Master
Plan in the future, including a Capital Improvements Program (CIP) or Recreation Plan.
Overall, the Master Plan is based on a number of township characteristics, each of which must be
considered by the Planning Commission and Township Board as the Master Plan is implemented and
updated. These characteristics include:

                                                Introduction
                                                     1-1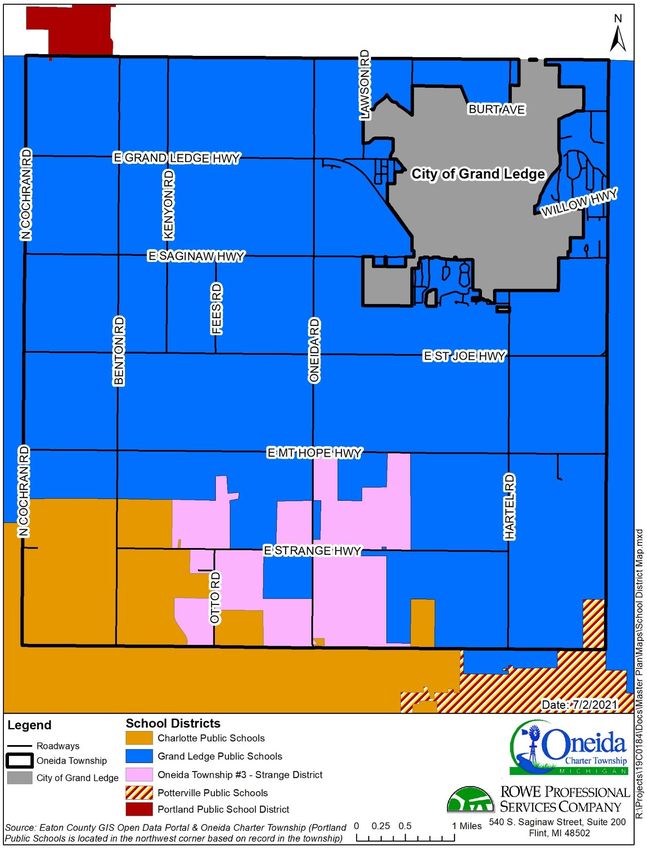
Oneida Charter Township
                                                                                           Master Plan

Community Character
The Master Plan’s goals describe the character desired by the community. The strong emphasis placed on
maintaining rural character in this Master Plan is reflected in the Future Land Use element and other
recommendations as well.
Adaptability of Land
Environmental constraints must also be considered. Is the land itself able to accommodate planned uses?
Are soils suitable for or capable of accommodating the density of development planned? If not, are public
utilities available to provide sewer and water service?
Community Needs
What uses are needed in the community? If a shortage of low- to medium-density housing was
determined to be a community issue, providing appropriate land uses in desirable locations would be an
appropriate response. If a small shopping area or commercial nodes seem appropriate for the community,
a location(s) should be selected and planned, based on the ability of the location to accommodate the
use.
Available Services
Through issue identification, goals, and data collection, information is obtained about the status of
community services. Are services capable of handling planned development? What kind of strain will new
residential development place on the ability to provide adequate fire protection? What road
improvements may be required?
Existing Development
How will the planned land uses affect existing uses? Are there some areas that are residential now that
the township would like to see become commercial in the future? How will planned uses affect those uses
already established nearby?
Regional Planning
The township does not exist in a vacuum. There are other regional issues, such as transportation,
environmental, and utility plans of adjacent communities, that also need to be considered.
The Master Plan and Zoning Ordinance
The relationship of the Master Plan and Zoning Ordinance is often misunderstood. Stated concisely, the
Master Plan is a guide for land use for the future; the Zoning Ordinance regulates the use of land in the
present. The Master Plan is not a binding, legal document; the Zoning Ordinance is a law that must be
followed by the township and its residents.
                          The Master Plan                 The Zoning Ordinance
                     The Master Plan is a Guide       The Zoning Ordinance is a Law
                  The Master Plan is adopted by      The Zoning Ordinance is adopted
                    the Planning Commission*              by the Legislative Body
                    The Master Plan shows how        The Zoning Ordinance shows how
                  land is to be used in the future        land is regulated today
                 * May be adopted by Legislative body
Adopting or changing the Master Plan does not directly affect the zoning for any property. However,
future changes to the zoning map are intended to be reflective of the planned uses shown by the Master
Plan.

                                              Introduction
                                                   1-2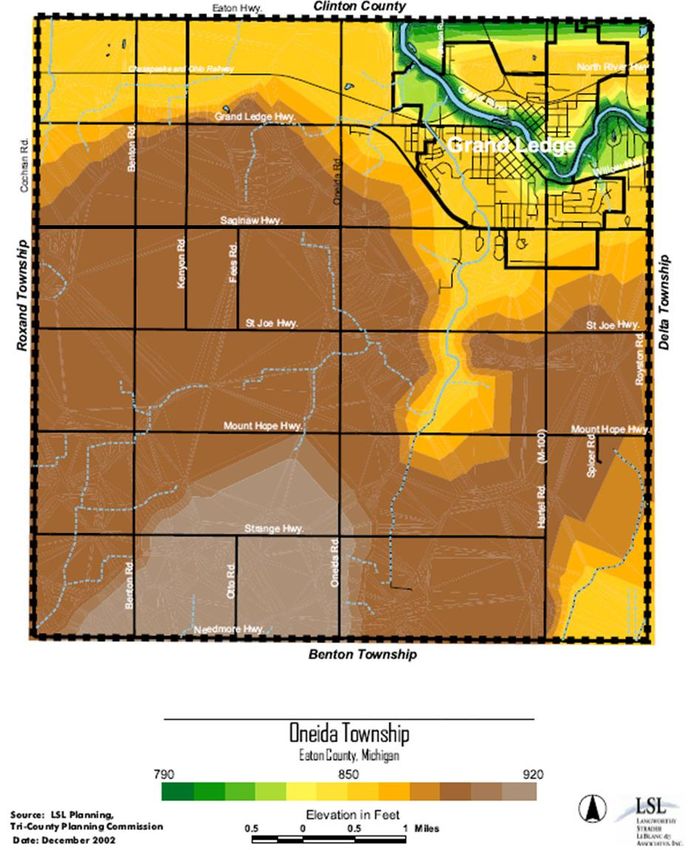
Oneida Charter Township
                                                                                            Master Plan

    •   In order to change the Master Plan, the township Planning Commission must conduct a public
        hearing and address comments made by the public. The Planning Commission then has the
        authority to adopt the Master Plan without Township Board action.
    •   In order to change the zoning map, the township Planning Commission must conduct a public
        hearing and forward a recommendation for action to the Township Board. It is the Township
        Board which must then adopt the proposed zoning change.

Using the Plan
The Planning Commission and Township Board should continuously strive to:
Refer to the Master Plan in all Zoning Decisions
One of the principal benefits of having an adopted Master Plan is the foundation it provides for sound
zoning decisions. Just as the Master Plan is the policy guide for land use, zoning is the principal legal
enforcement tool. The two must work together to support each zoning decision as well as assist in
defending legal challenges to those decisions, should they occur.
Encourage other Decision-Making Bodies to use the Master Plan
The Master Plan should help guide everyday decisions, from improving roads to building new schools.
Working with other parties that can affect land use patterns in the township, such as the City of Grand
Ledge, Eaton County Road Commission, school districts, and even adjacent townships, can help Oneida
Charter Township in the implementation of the Master Plan.
Keep the Plan Current
Adoption of the Master Plan does not mark the end of the planning process so much as its beginning. An
outdated Master Plan that is not referred to on a continual basis can weaken township decisions. The
Planning Commission should conduct an annual review of the Master Plan to ensure that the Master Plan
is kept current. Any amendments to the Master Plan can be done at that time to keep it up to date and
consistent with township philosophies. Several goals in the community may have been achieved and new
ones may need to be established, or several zoning decisions may have changed the direction of
development in a certain part of the township.
Where uses have been approved contrary to the Master Plan, it should be amended to reflect these
changes. By routinely following this procedure, the Master Plan will continue to be an up-to-date, reliable
planning tool.
How Does the Master Plan Affect You as a Resident or Landowner?
How the Master Plan affects you depends on your particular situation. If you are a property owner, you
may have several interests, including not only your property but properties that are in a similar land use
category. As a homeowner, you will be interested in the properties in your immediate neighborhood. You
may wish to know what uses are proposed for vacant land in your area. As an owner of vacant property,
you will want to know what land uses are proposed for your property.
As a township resident, you will be interested in the overall concepts of the Master Plan, as expressed in
its goals. These statements will give you an indication of the Planning Commission’s view of the township
now and in the future.
How Should You Use This Plan?
Again, use of the Master Plan depends on your interest in the future of Oneida Charter Township, but
generally, here is the procedure you should follow.

                                              Introduction
                                                   1-3
Oneida Charter Township
Master Plan
Step #1 What land use is proposed for your property, or the area surrounding your property?
You can start to find this information on the Future Land Use map (Map 8-1 Future Land Use, page 8-7).
This map is divided into separate land use categories. Find the category of land use in which your property
is located.
Step #2 Determine how the Planning Commission views development in your area.
The text of the Future Land Use Plan as well as the Goals, Objectives, and Strategies will indicate to you
the general direction of development within your area; it may be fairly specific, or it may be somewhat
general. The Land Use text is meant to provide a general direction to the Planning Commission as well as
property owners regarding future development within the township.
Step #3 Determine the meaning of the land use designation for your property.
In Step #1, you were asked to determine the land use category into which your property falls. In the Future
Land Use chapter, there is a discussion covering each of these categories. Find the one that applies to you
(the category in which your property lies) and read the discussion on the meaning of each land use
designation, its “locational criteria” and related zoning classification. Keep in mind that the Future Land
Use map is one possible arrangement of future land uses. Because some property may meet the locational
criteria of more than one future land use classification, your property may be appropriate for more than
one zoning classification. And because the land use classification may be based in part on the existence of
certain infrastructure like major roads or water / sewer, changes in that infrastructure can change the
appropriateness of the land use classification and therefore the zoning of property.
Depending on the nature of your interest in the Master Plan, this may be as far as you carry your initial
investigation. If you have a specific proposal which does not fit the Future Land Use Plan, you may want
to investigate the Master Plan in more detail, beginning with the Goals.
Step #4 Determine how the Master Plan affects your property.
The Future Land Use designation will indicate to you how your property is planned for use in the future.
This does not mean that you cannot continue the use that you currently have. Land use within Oneida
Charter Township is also affected by the zoning for your property. See the Zoning Ordinance or call the
township offices for more information.
In short, the Master Plan may have a profound impact on the future of your property, regardless of
whether you are a landowner or a homeowner. As a resident of Oneida Charter Township, it is important
that you become familiar with the Master Plan and what it may mean to you.
Conclusion
The Planning Commission and Township Board of Oneida Charter Township have assumed their
responsibility to look beyond today’s zoning issues and provide long-term guidance for land use and
development through the adoption of this Master Plan. The Master Plan, properly developed and well
thought out, can provide tangible benefits in improved quality of life, efficient use of financial and other
resources, a cleaner environment, and an economically healthy community. However, those benefits are
directly related to the willingness of the township’s citizens to follow the plan, and to keep the plan
current. It is hard work; but the rewards will make the effort well worthwhile.
Introduction
1-4Oneida Charter Township
Master Plan
Chapter 2 Community Profile
Understanding Our Community
Understanding Oneida Township and the changes it has undergone through time helps to better
determine a clear direction for its future. By analyzing existing trends and conditions, we can begin to
learn why and how land use patterns have changed over time and the ways in which the township can
better serve the needs of its residents. This Master Plan utilizes a wide range of information to ensure
that its recommendations are based on accurate information and closely reflect the conditions and needs
of Oneida Township.
• Population data helps in determining the social and physical needs of the community. Population
information is based on 2010 U.S. Census and 2019 American Community Survey (ACS) data and
earlier.
• An inventory of community facilities helps determine what type and intensity of development is
reasonable.
• Existing land use patterns reveal the effects of past land use decisions on development. Existing
land use information in this Master Plan is based on an existing land use inventory conducted in
2019.
• Public involvement provides township residents with opportunities to voice their opinions about
what they see happening in the community; and a chance to offer suggestions, provide insight,
and strengthen the position of the Master Plan through their involvement.
• Identifying issues of importance in the township is essential to the formation of a sound vision for
the future. Unless problems are Map 2-1 Location
accurately identified, and proper
solutions sought, the Master Plan
will not achieve its full potential
as a tool that can make Oneida
Township a better place to live,
work, and play.
Location
Oneida Township is located in the
northeastern portion of Eaton County,
Michigan (see Map 2-1), approximately 6
miles west of the City of Lansing. The
township covers approximately 33.5
square miles with the City of Grand Ledge
occupying the remaining 2.5 miles,
entirely within the township boundaries.
Eaton County is located in south-central
Michigan. The county is considered part
of the Tri-County region, which includes
Ingham , Eaton, and Clinton Counties, all
of which surround the City of Lansing.
Community Profile
2-1Oneida Charter Township
Master Plan
Eaton Highway (the Eaton County/Clinton County line) forms the northern boundary of the township,
while Needmore Highway/Davis Highway marks the southern boundary. Cochran Road and Royston Road
form the western and eastern boundaries of Oneida Township respectively.
Oneida Township is within close proximity to the suburbs of Lansing and surrounds the expanding City of
Grand Ledge (2010 Pop. 7,786). Its general location to Grand Ledge and Lansing makes it attractive to
future residential development that desires a “country” or “rural” atmosphere.
Population Characteristics
Evaluating the characteristics of the township’s population can help paint a picture of the community
and determine trends that can set the stage for the Master Plan to address questions such as:
• If the population of the township continues to grow, will this increase the need for additional
infrastructure (expanded water and sewer services) and adversely affect the natural
environment?
• What areas should be served in the future with water and sewer? Rural residential areas?
Commercial areas? Industrial?
• What considerations need to be given to the protection of farmland and the environment to
enhance the township’s rural character and quality of life?
Population information is shown through census data and includes population changes, age
profiles/breakdown, and population growth trends. Population data helps in determining the social and
physical needs of the community. Population information is based on the 2010 Decennial Census data and
earlier, as well as the 2019 American Community Survey (ACS) information. The decennial census occurs
only once every 10 years, but the data represents the results of responses from almost 100% of the
population. The ACS data is updated every year, but is a statistical estimate of the results of an annual
survey of 1% of the population. Because the township’s population is relatively small, a 1% survey is not
statistically valid, so the 2019 ACS data is actually an average of data over 5 years (2013-2019).
Population
Figure 2-1 shows the population changes between 1970 and 2019. Figure 2-1 is a great visual showing the
growth that has occurred over the last 40 years in Oneida Township. Between 1970 and 1980, Oneida
Township saw the most dramatic growth, followed by a slight decline between 1980 and 1990. Between
1990 and 2020, the township saw additional growth, although growth since 2000 has been significantly
less.
Figure 2-1 Oneida Township Population 1970-2019
5000
4000
3000
2000
1000
0
1970 1980 1990 2000 2010 2019
Source: U.S. Census Bureau
Community Profile
2-2Oneida Charter Township
Master Plan
The data in Table 2-1 from surrounding jurisdictions shows the township’s change in population in relation
to local, county, and statewide trends. It shows that the change has generally been consistent with that
of the county as a whole and significantly greater than the state.
Table 2-1 Population Growth Trends 1970-2019
1980 1990 2000 2010 2019
(Percent (Percent (Percent (Percent (Percent
Community 1970 Change) Change) Change) Change) Change)
3,378 3,228 3,703 3,865 3,895
Oneida Township 2,635 (28.2%) (-4.4%) (14.7%) (4.4%) (0.8%)
2,060 2,151 2,332 2,671 2,713
Eagle Township 1,594 (29.2%) (4.4%) (8.4%) (14.5%) (1.6%)
23,822 26,129 29,682 32,408 33,124
Delta Township 17,396 (36.9%) (9.7%) (13.6%) (9.2%) (2.2%)
2,405 2,528 2,712 2,796 2,832
Benton Township 1,754 (37.1%) (5.1%) (7.3%) (3.1%) (3.1%)
1,975 1,903 1,903 1,848 1,705
Roxand Township 1,671 (18.2%) (-3.6%) (0.0%) (-2.9%) (-7.7%)
6,920 7,579 7,813 7,786 7,842
City of Grand Ledge 6,032 (14.7%) (9.5%) (3.1%) (-0.3%) (0.7%)
88,337 92,879 103,655 107,759 109,456
Eaton County 68,892 (28.2%) (5.1%) (11.6%) (4.0%) (1.6%)
9,262,078 9,295,297 9,536,094 9,883,640 9,986,857
State of Michigan 8,875,083 (4.4%) (0.4%) (2.6%) (3.6%) (1.0%)
Source: 1970, 1980, 1990, 2000, 2010, Decennial Census, 2019 American Community Survey (ACS)
Figure 2-2 shows the population change for Oneida Township in comparison with the City of Grand Ledge.
While Oneida Township continues to generally have half the population of the city, the growth rate has
generally exceeded the city’s over much of the past 50 years.
Figure 2-2 Population 1970-2019
9000
Oneida Township
8000
City of Grand Ledge
7000
6000
Number of Persons
5000
4000
3000
2000
1000
0
1970 1980 1990 2000 2010 2019
Source: 1970, 1980, 1990, 2000, 2010 Decennial Census, 2019 ACS
Community Profile
2-3Oneida Charter Township
Master Plan
Oneida’s largest age group in 2019 can be seen in Figure 2-3 as those who are 45 to 64, which differed
from 2000 when the largest age group was those under the age of 20. Large populations in the 45 to 64
“cohort” indicate future needs for senior citizens such as retirement housing and health care facilities.
The future needs for senior citizens will be centered around strategies to allow aging in place and a variety
of senior housing options. The segment of the population 20 to 24 remained stable.
Figure 2-3 Age Profile
1500
2000 2010 2019
1000
Number of Persons
500
0
Under 20 20 to 24 25 to 44 45 to 64 65+
Source: 2000, 2010 Decennial Census, 2019 ACS
The continued “aging” of the population is shown in the Table 2-2 Median Age, 1990-2019
change in the median age in Table 2-2. This also
demonstrates the extent to which the population of the Year Oneida Eaton State of
township is older than that of the county or the state as a Township County Michigan
whole. 1990 35.6 32.8 32.6
2000 40.5 36.4 35.5
Table 2-3 illustrates that while almost 92.5% of the
2010 46.1 40.3 38.9
households in the township are married couples, 37.4%
are married couples with at least one child under 18 years 2019 49.2 40.9 38.5
of age, what many people would assume is the “normal” Source: 1990, 2000, 2010 Decennial
household composition. A plurality of households (55.1%) Census, 2019 ACS
are “empty nesters”, and this percentage can be expected to increase. However, at some point these
older households can be expected to get to the age where they need to move into housing more suitable
to their needs and capabilities and the housing will be occupied by younger households with families.
Table 2-3 2019 Household Types
Oneida Township Eaton County State of Michigan
# % # % # %
Total Households 1,158 100.0% 44,480 100.0% 3,935,041 100.0%
Family households (families) 1,146 98.9% 28,756 64.6% 2,517,441 64.0%
With own children under 18 years 433 37.4% 12,329 27.9% 1,110,316 28.2%
Married-couple Family 1,071 92.5% 22,302 50.1% 1,853,456 47.1%
Female Householder, no husband 32 2.7% 4,577 10.3% 475,082 12.1%
present
Male Householder, no wife present 55 4.7% 1,877 4.2% 188,903 4.8%
Nonfamily Households 363 31.3% 15,724 35.4% 1,417,600 36.0%
Householder living alone 306 26.4% 12,964 29.1% 1,164,019 29.6%
Householder living alone, 65 years 186 16.0% 5,224 11.7% 467,411 11.9%
and over
Source: 2019 American Community Survey
Community Profile
2-4Oneida Charter Township
Master Plan
The average household size is shown in Figure 2-4 for the township, county, and state. As shown, Oneida
Township shows higher average household sizes than both Eaton County and the State of Michigan. A
drop is shown in 2019 among all jurisdictions in average household size. This is a national trend due to the
aging population. Increases in the rate of divorce over the past 50 years have also increased the number
of households and caused a reduction in average household size. A significant impact of this trend is that
a population that does not increase may still require additional housing units. It also impacts the demand
for smaller dwelling units.
Figure 2-4 Average Household Size, 2000-2019
3
2.5
2
2000 2010 2019
Oneida Township Eaton County State of Michigan
The township has a similar education attainment numbers and percentages to the county and state, but
the township does show a slightly higher percentage of those with bachelor’s degrees. The largest
segment of the population over 25 years old have some college, but no degree. This differs from Eaton
County and the State of Michigan, where the largest group are those with high school degrees with no
college. This is expected to change over the next 20 years as more workers find it necessary to go to
college to acquire training or skills to remain employed.
Table 2-4 Education Attainment, 2019
Oneida Township Eaton County State of Michigan
# % # % # %
Population 25 years and over 1,856 - 76,765 - 6,813,480 -
Less than 9th grade 28 1.0 1,355 1.8 194,755 2.9
9th to 12th grade, no diploma 111 3.9 3,032 3.9 431,435 6.3
High school graduate (includes 799 28.0 21,255 27.7 1,967,316 28.9
equivalency)
Some college, no degree 677 23.7 21,086 27.5 1,591,358 23.4
Associate degree 322 11.3 8,726 11.4 643,446 9.4
Bachelor’s degree 629 22.0 13,684 17.8 1,207,829 17.7
Graduate or Professional Degree 290 10.2 7,627 9.9 777,341 11.4
Source: 2019 American Community Survey
Figure 2-5 Educational Attainment
State of
Michigan
Eaton County
Oneida
Township
0.00% 20.00% 40.00% 60.00% 80.00% 100.00%
Less than 9th Grade 9th to 12th Grade, no diploma
High School Graduate (Includes Equivalency) Some college, no degree
Associate Degree Bachelor's Degree
Graduate or Professional Degree
Community Profile
2-5Oneida Charter Township
Master Plan
Overall Character
The overall character of Oneida Township is predominantly rural, with the majority of its land dedicated
to agricultural uses. The primary concentration of commercial and industrial uses, such as restaurants,
banks, retail and wholesale stores, and manufacturing operations, is found in and around the City of Grand
Ledge. On a regional level, services and employment other than farming are provided by the businesses
within the metropolitan area of the City of Lansing. Oneida’s neighbor to the east, Delta Township (a
suburb of Lansing), places development pressure on Oneida Township due to its significant growth,
specifically along Saginaw Highway (M-43).
As the Cities of Grand Ledge and Lansing continue to seek room to grow residential and commercial
development, they increase the pressure on Oneida Township to develop rural or vacant land. Therefore,
the township, through this document, is actively seeking to plan for and control growth in a positive
manner to provide for quality development while maintaining its rural character. The greatest restraint to
this growth will be the community’s desire to protect its prime farmland and natural features, as well as
the present limitation of public sanitary sewers and utilities. This may also work to the township’s
advantage in terms of curbing the threat of urban sprawl, as discussed later.
Economic Characteristics
The Decennial Census and ACS data relates to the characteristics of the individual communities and does
not necessarily reflect the economy of the community. Individuals may live in community “X” but work in
community “Y”. Economic characteristics include household income, the industry a worker is employed
in, and all income sources for households in the township.
Incomes can help provide an understanding of a community’s affluence and buying power. In 2019, the
American Community Survey shows that incomes from $35,000 to $49,999 were the highest percentage
in Oneida Township. This is consistent with the county and the state. The median income of Oneida
Township residents is significantly higher at $56,750 versus $48,735 for the county and $48,463 for the
state.
Table 2-5 Income, 2019
Oneida Township Eaton County State of Michigan
# % # % # %
$1 to $9,999 or less 8 0.7% 748 2.0% 53,553 1.7%
$10,000 to $14,999 25 2.1% 798 2.1% 88,877 2.8%
$15,000 to $24,999 70 5.8% 3873 10.3% 358,355 11.3%
$25,000 to $34,999 79 6.5% 5631 14.9% 502,932 15.9%
$35,000 to $49,999 310 25.7% 8417 22.3% 633,740 20.0%
$50,000 to $64,999 243 20.1% 6815 18.0% 514,008 16.2%
$65,000 to $74,999 129 10.7% 3209 8.5% 207,855 6.6%
$75,000 to $99,999 205 17.0% 4699 12.4% 367,327 11.6%
$100,000 or more 139 11.5% 3588 9.5% 442,943 14.0%
Median $56,750 N/A $48,735 N/A $48,463 N/A
Source: 2019 American Community Survey
Community Profile
2-6Oneida Charter Township
Master Plan
Figure 2-6 Oneida Township Household Income
2019 ACS Household Income Oneida Township
Under $15,000 $15,000 to $49,999 $50,000 to $99,999 $100,000 and Over
Figure 2-7 Eaton County Household Income Figure 2-8 State of Michigan Household Income
2019 ACS Household Income: Eaton 2019 ACS Household Income: State
County of Michigan
Under $15,000 $15,000 to $49,999 Under $15,000 $15,000 to $49,999
$50,000 to $99,999 $100,000 and Over $50,000 to $99,999 $100,000 and Over
Community Profile
2-7Oneida Charter Township
Master Plan
Table 2-6 shows the number of persons in Oneida Township that are employed in various “industries”.
The Bureau of the Census uses the term “industry” to reflect different segments of the economy and not
just parts of the industrial sector. The highest percentage of persons are employed in the Educational,
Health, and Social Services industry and the lowest amount is in the Agriculture, Forestry, Fishing, Hunting,
& Mining. This should not be seen as a reflection of the importance of agriculture as a source of
employment, but simply that many farmers find it necessary to have a second source of income along
with that provided by farming. The high percentage in the Educational, Health, and Social Services industry
may reflect the township’s central location between several cities, with several schools, colleges,
hospitals, and other major employers.
Table 2-6 Occupations
Industry Number of Persons Percent of Persons
Employed by Industry Employed by Industry
Agriculture, forestry, fishing and hunting, and 12 0.7%
mining
Construction 88 5.2%
Manufacturing 212 12.4%
Wholesale trade 57 3.3%
Retail trade 119 7.0%
Transportation and warehousing, and utilities 82 4.8%
Information 16 0.9%
Finance and insurance, and real estate and 99 5.8%
rental and leasing
Professional, scientific, and management, and 137 8.0%
administrative and waste management services
Educational services, and health care and social 515 30.2%
assistance
Arts, entertainment, and recreation, and 130 7.6%
accommodation and food services
Other services, except public administration 46 2.7%
Public administration 193 11.3%
TOTAL 1,706 100%
Source: 2019 American Community Survey
Community Profile
2-8Oneida Charter Township
Master Plan
Table 2-7 shows the income source of the residents in Oneida Township, Eaton County, and the State of
Michigan. Information about income source is important because it allows a community to understand
the extent to which their residents are impacted by changes in employment opportunities versus those
living on stable but fixed income such as retirement. Oneida Township has a higher percentage of
individuals living on retirement income, and the township also has a higher mean retirement income than
both the county and the state. Oneida Township also shows a notably lower amount of people living with
public assistance income than the county or state.
Table 2-7 Income Source, 2019
Oneida Township Eaton County State of Michigan
Income Source in 2019
# % # % # %
Households 1,521 100% 44,480 100% 3,935,041 100%
With earnings 1,060 69.7 33,802 76.0 2,923,374 74.3
Mean earnings (dollars) 94,536 (X) 75,954 (X) 80,809 (X)
With Social Security 723 47.5 16,293 36.6 1,365,683 34.7
Income
Mean Social Security 21,636 (X) 21,575 (X) 20,657 (X)
Income (dollars)
With Supplemental 38 2.5 2,211 5.0 241,441 74.3
Security Income
Mean Supplemental 11,921 (X) 10,801 (X) 10,343 (X)
Security Income (dollars)
With public assistance 21 1.4 1,784 4.0 92,166 2.3
income
Mean public assistance N/A (X) 2,305 (X) 2,607 (X)
income (dollars)
With retirement income 678 39.0% 13,499 30.3 932,709 23.7
Mean retirement income 48,904 30,373 (X) 24,096 (X)
-
(dollars)
Source: 2019 American Community Survey
Community Profile
2-9Oneida Charter Township
Master Plan
Table 2-8 shows the poverty status of families and individuals in the township, county, and state. The
township had a significantly lower number of families with incomes below the poverty level than the
county or state. Families with a female head of household which include minor children are the most likely
persons to be living below the poverty line.
Table 2-8 Poverty Status, 2019
Oneida Township Eaton County State of Michigan
Poverty Status in 2019
% % %
All Families - - -
Percent below poverty level 2.9% 7.4% 10.9%
With related children under 18 years - - -
Percent below poverty level 5.5% 12.7% 18.4%
With related children under 5 years - - -
Percent below poverty level 0.0% 15.7% 20.6%
Families with female householder, no husband present
Percent below poverty level 50.0% 24.1% 31.3%
With related children under 18 years - - -
Percent below poverty level 66.7% 33.3% 42.5%
With related children under 5 years - - -
Percent below poverty level 0.0% 39.7% 49.5%
All people as individuals
Percent below poverty level 4.5% 10.9% 15.6%
18 years and over - - -
Percent below poverty level 4.2% 9.3% 13.8%
65 years and over - - -
Percent below poverty level 3.7% 5.8% 8.2%
Related children under 18 years - - -
Percent below poverty level 5.5% 16.2% 21.3%
Related children 5 to 17 years - - -
Percent below poverty level 7.1% 15.3% 19.9%
Unrelated individuals 15 years and over - - -
Percent below poverty level 14.0% 15.3% 28.3%
Source: 2019 American Community Survey
Housing Characteristics Table 2-9 Oneida Township Housing Types
Housing characteristics combine population and Type of Unit # of Units % of Units
economic information and the current status and 1-Unit, detached 1,484 95.5%
growth of housing opportunities in the community. 1-Unit, attached 9 0.6%
Housing characteristics include housing types, the year 2 Units 15 1.0%
structures were built, and unit occupancy. 3 or 4 Units 0 0.0%
Table 2-9 shows the different types of homes that can 5 to 9 Units 32 2.1%
be found in Oneida Township. The table shows that the 10 to 19 Units 0 0.0%
type of housing that is most prevalent in Oneida 20 or More Units 0 0.0%
Township is 1-unit detached, or single-family homes, Mobile Home 14 0.9%
and they make up 95.5% of the township’s housing unit Boat, RV, Van, etc. 0 0.0%
types. This helps to explain the significantly higher Source: 2019 American Community Survey
Community Profile
2-10Oneida Charter Township
Master Plan
median value of owner-occupied homes in the township but places it at a disadvantage in retaining its
aging population. As its population ages, many residents will move to other communities with housing
more appropriate for their needs, and if new owners for their homes cannot be found, vacancy rates could
increase, or at least the rate of new construction will continue to drop.
Table 2-10 shows the number of structures in Oneida Township that were built in specific years. The year
that structures were built is an important aspect to consider because older homes can cost more to keep
up and are more vulnerable to deterioration. About a quarter of the homes in the township are 30 years
old or less, which is comparable with the county and state. The information in Table 2-10 also illustrates
the dramatic slowdown in home construction that occurred over the past 10+ years.
Table 2-10 Years Structures Were Built in Oneida Township
Year Structure was Built Number of Structures Percent of Total Structures
Built 2014 or Later 16 1.0%
Built 2010 to 2013 15 1.0%
Built 2000 to 2009 181 11.6%
Built 1990 to 1999 226 14.5%
Built 1980 to 1989 149 9.6%
Built 1970 to 1979 332 21.4%
Built 1960 to 1969 299 19.2%
Built 1950 to 1959 124 8.0%
Built 1940 to 1949 109 7.0%
Built 1939 or Earlier 103 6.6%
Source: 2019 American Community Survey
Figure 2-9 Oneida Township Housing Unit Occupancy shows how many homes in Oneida Township are
owner-occupied, renter occupied, and vacant. Oneida Township’s largest amount is owner occupied, with
their lowest amount being vacant. When comparing Figure 2-9 through Figure 2-11, Oneida Township has
a lower vacancy rate than both Eaton County and the State of Michigan. Oneida Township also has less
renter occupied dwellings than both Eaton County and the State of Michigan, which is consistent in a
community with such a high percentage of single-family detached homes.
Figure 2-9 Oneida Township Housing Unit Occupancy
ONEIDA TOWNSHIP HOUSING UNIT OCCUPANCY
Renter Occupied Vacant
5% 2%
Owner Occupied
93%
Community Profile
2-11Oneida Charter Township
Master Plan
Figure 2-10 Eaton County Unit Occupancy Figure 2-11 State of Michigan Unit Occupancy
EATON COUNTY HOUSING STATE OF MICHIGAN
UNIT OCCUPANCY HOUSING UNIT
Vacant
OCCUPANCY
6% Vacant Owner
Renter 14% Occupied
Occupied 61%
26%
Owner Renter
Occupied Occupied
68% 25%
Table 2-11 shows the change in the number of occupied dwelling units. Oneida Township showed a 2.9%
increase over 2000 to 2019. While Oneida Township saw an increase in occupied dwelling units, both
Eaton County and the State of Michigan saw a decrease in occupied dwelling units.
Table 2-11 Number of Occupied Dwelling Units, 2000-2019
Oneida Township Eaton County State of Michigan
# % # % # %
2000 1,352 95.0% 40,167 95.4% 3,785,661 89.4%
2010 1,449 95.7% 43,494 92.4% 3,872,508 85.4%
2019 1,521 97.9% 44480 93.5% 3,935,041 85.6%
Reference: 2000, 2010 U.S. Census, 2019 American Community Survey
Table 2-12 shows the house value breakdown in the township, the county, and the state. The majority of
the township’s house value is between $100,000 to 199,999. The median home value is higher for the
township than the county and state.
Table 2-12 House Value, 2019
Oneida Township Eaton County State of Michigan
# % # % # %
Specified owner-occupied units 1,445 100% 32,148 100% 2,802,699 100%
Less than $50,000 22 5.9% 2,101 6.5% 326,347 11.6%
$50,000 to $99,999 85 18.4% 4,792 14.9% 508,868 18.2%
$100,000 to $149,999 266 30.2% 8,285 25.8% 510,142 18.2%
$150,000 to $199,999 436 36.9% 7,645 23.8% 477,897 17.1%
$200,000 to $299,999 533 5.8% 6,479 20.2% 514,530 18.4%
$300,000 to $499,999 84 1.3% 2,323 7.2% 337,418 12.0%
$500,000 to $999,999 19 1.5% 366 1.1% 105,648 3.8%
$1,000,000 or more 0 0.0% 157 0.5% 21,849 0.8%
Median (dollars) 190,900 - 155,000 - 154,900 -
Reference: 2019 American Community Survey
Community Profile
2-12You can also read