Prevalence of Overweight and Obesity among Health Sciences Students in the Amazonia Region of Peru - MDPI
←
→
Page content transcription
If your browser does not render page correctly, please read the page content below
healthcare
Article
Prevalence of Overweight and Obesity among Health
Sciences Students in the Amazonia Region of Peru
Joseba Rabanales-Sotos 1,2 , Maritza Evangelina Villanueva-Benites 3 ,
Jesús Jacinto-Magallanes-Castilla 3 , Zoila Esperanza Leitón-Espinoza 4 ,
Ángel López-González 1,2, * and Jesús López-Torres-Hidalgo 2,5
 1    Department of Nursing, Physiotherapy and Occupational Therapy, Nursing Faculty, University of
      Castilla-La Mancha, Campus Univesitario s/n, 02071 Albacete, Spain; joseba.rabanales@uclm.es
 2    Group of Preventive Activities in the University Health Sciences Setting (UCLM), 02071 Albacete, Spain;
      jesusl@sescam.org
 3    Scientific University of Peru (Universidad Científica del Perú/UCP), Maynas 80300, Peru;
      maritza.villanueva@unapiquitos.edu.pe (M.E.V.-B.); jesus.magallanes@unapiquitos.edu.pe (J.J.-M.-C.)
 4    Nursing Faculty, National University of Trujillo (Universidad Nacional de Trujillo), Trujillo 130101, Peru;
      zeleiton@unitru.edu.pe
 5    Albacete Faculty of Medicine (UCLM), Castilla-La Mancha Health Service (Servicio de Salud de Castilla-La
      Mancha/SESCAM), 02071 Albacete, Spain
 *    Correspondence: angel.lopez@uclm.es; Tel.: +34-967-599-200 (ext. 2711)

 Received: 6 November 2020; Accepted: 2 December 2020; Published: 4 December 2020

 Abstract: A cross-sectional study was conducted to evaluate 199 health sciences students in
 the city of Iquitos. Their socio-demographic characteristics, lifestyle, level of physical activity,
 type of food, substance abuse, and prevalence of overweight and obesity were ascertained using
 purpose-validated questionnaires, i.e., the Systematic Alcohol Consumption Interview (Interrogatorio
 Sistematizado de Consumos Alcohólicos/ISCA), a questionnaire on the frequency of dietary
 intake (CFCA), the International Physical Activity Questionnaire (IPAQ), and anthropometric
 measurements. The prevalence of overweight (body mass index (BMI) of 25.0–29.9 kg/m2 ) was 26.5%
 (95% CI = 19.9–33.0%) and that of obesity (BMI ≥ 30.0 kg/m2 ) was 7.9% (95% CI = 3.8–12.1%). A total
 of 34.4% of students (95% CI = 27.4–41.4%) presented with a BMI > 25 kg/m2 . The frequency of
 overweight was significantly higher in persons aged over 20 years (OR = 2.5) and smokers (OR = 3.2),
 and the frequency of obesity was significantly higher in older students (OR = 4.1) and males (OR = 5.5).
 In conclusion, a considerable proportion of health sciences students in the Amazonia region presented
 with a high BMI. The proportion of students with overweight was higher among students aged over
 20 years and smokers, while that of obesity was also higher among males. In the university setting,
 the development of more overweight- and obesity-preventive activities and educational interventions
 would therefore be desirable.

 Keywords: health sciences students; obesity; overweight; lifestyles; preventive activities

1. Introduction
     In the 21st century, the prevention of chronic non-transmissible diseases is one of the most
important public health challenges. According to the World Health Organization (WHO), chronic
non-transmissible diseases cause 71% of deaths worldwide, especially in adults aged 30 to 69 years.
Over 85% of these deaths occur in low- to middle-income countries, with cardiovascular diseases being
the cause of the majority of chronic diseases. It is envisaged that in the coming years, cardiovascular
diseases will cause three times more deaths and disabilities than infectious diseases [1]. In Latin

Healthcare 2020, 8, 538; doi:10.3390/healthcare8040538                           www.mdpi.com/journal/healthcare
Healthcare 2020, 8, 538 2 of 11
America, cardiovascular and cerebrovascular diseases are reckoned to be responsible for 35–55% of all
deaths [2].
Non-transmissible diseases progress slowly and affect all age groups. The adolescent and
young adult population, such as university students, is also exposed. This age sees the emergence
of population risk factors, such as overweight, obesity, smoking, excessive alcohol consumption,
and sedentariness [3].
According to WHO data, some 1400 million adults worldwide present with obesity and/or
overweight, which constitute significant risk factors for morbidity and mortality [4]. The prevalence of
overweight in young adults varies depending on the country, e.g., 16 to 37% in Spain [5], 2.9 to 14.3%
in China, 11 to 37.5% in India, around 17% in the USA, and 13.4 to 31.6% in Latin America and South
Africa [6].
In Peru, data produced by the demographic and family health survey (Encuesta Demográfica y de
Salud Familiar/ENDES) show that 35.5% of persons aged 15 years and over present with overweight,
and that obesity affects 18.3% of adolescents, with a higher frequency in females [7]. In the group of
adolescents and adults, one in three presents with overweight or obesity [8].
Overweight and obesity is a highly complex chronic condition that develops in the face of
potentially hundreds of factors including the consequences of a suboptimal diet that is predominated
by high caloric consumption, due mainly to excess lipids and carbohydrates, and is accompanied by
low levels of physical activity, all of which generates a lifestyle harmful to health [9].
The transition from adolescence to adult life has been described as a critical period in the
development of obesity and less healthy lifestyles. A lack of time, self-discipline, or social support,
as well as a lack of parental control, have been described by the university student population as the
most important barriers to engaging in healthy activities [10]. A number of previous studies have
highlighted certain problems, such as smoking and the consumption of alcohol and other drugs among
university students, with the following proportions of hazardous drinkers being reported: 37.1%
among Spanish university students [11], 11.9–33% among medical students from other countries [12],
and 17.9–27.2% among nursing students in countries such as Spain and Costa Rica [13,14]. Previous
studies also highlight the fact that university students, especially those involved in health sciences,
adopt sedentary behaviors, remaining seated for a mean studying time of over 8 h per day [15]. Overall,
only about 50% of university students do some type of physical exercise [16].
Accordingly, the aim of the study was to ascertain the prevalence of overweight and
obesity in health sciences students in Peru’s Amazonia region and establish its relationship with
socio-demographic variables, level of physical activity, type of diet, and presence of unhealthy habits.
2. Materials and Methods
2.1. Design
We carried out a cross-sectional observational descriptive study in which health sciences students
at the Scientific University of Peru (PSU) participated during the 2017–2018 academic year. The study
inclusion criteria were: registration as a student of nursing, obstetrics, stomatology, psychology,
or medical technology during the above academic year, and providing consent to participate. The sole
exclusion criterion was the refusal to participate in the study after learning its designated goals.
The study was authorized by the Chancellor and Senate (acting in their capacity as a Research
Ethics Committee) of the PSU (09/2916), and the Helsinki Declaration principles were observed at all
times. To preserve the confidentiality of the participants, the questionnaire data were entered into a
database and identified exclusively by a numerical code.
2.2. Study Population
All registered students of Health Sciences, a total of 250, were invited by email to participate
in the study. All of them were informed in detail about the nature of this study. A total ofHealthcare 2020, 8, 538 3 of 11
199 students (79.6%) attended the appointment to collect data, answer the survey, and measurement
of anthropometric parameters. All participants provided written informed consent. The sample size
achieved corresponded to an expected frequency of overweight and obesity of 22% [17], assuming a
95% confidence level and a precision of ±2.6%.
2.3. Information Sources
To collect the data, we designed a pre-coded, self-administered, anonymous data collection form,
which was completed in the lecture rooms by students in groups of 20 to 25. For the purpose of
measuring anthropometric variables (weight, height, and body composition (BC)), the students were
asked to go to the university medical center, where they were evaluated over a period of thirty minutes.
All data were taken under standard conditions by the researchers. After participating in the study,
they were informed about their body composition, as well as unhealthy habits.
2.4. Variables
The variables considered in the study were as follows:
(a) Socio-demographic characteristics (age, sex, form of coexistence, place of origin according to
number of inhabitants, social class based on parents’ occupation or that of the students themselves,
and whether they were engaged in some gainful occupational activity using Goldthorpe’s
classification) [18].
(b) Anthropometric measures: weight (average of two determinations measured using a certified
Seca-770 scale (SECA gmbh & co. kg, Hamburg, Germany) with easy calibration, with the
participant barefoot and in light clothes), height (average of two determinations measured
using wall-mounted Seca-222 height rod (SECA gmbh & co. kg, Hamburg, Germany), with the
participant standing barefoot on standing position and joining their sagittal average line with the
height rod average line), body mass index (BMI) calculated as weight (kg)/height2 (m2 ), and BC
measured using a Tanita MC 780-P MA® (TANITA Corporation, Tokyo, Japan) segmental body
composition monitor.
(c) Level of physical activity, as measured using the Physical Activity Questionnaire (IPAQ) [19],
with students being classified as involved in sedentary, moderate, or vigorous physical activity.
(d) Quality of diet: frequency of weekly consumption of each group of foods, with healthy diet
criteria being defined as the consumption of 3–4 weekly rations of fish and seafood, lean meat
and eggs; 2–4 weekly rations of legumes; 2–4 daily rations of dairy products; 2 or more daily
rations of green leafy and other vegetables; 3 or more daily rations of fresh fruit; 4–6 daily rations
of bread, cereals, pasta, rice or potatoes [20].
(e) Unhealthy habits: smoking habit, substance abuse, and alcohol consumption. The alcohol
consumption was measured using the Systematic Alcohol Consumption Interview (ISCA) [21].
The ISCA consists of three questions that address the quantity and frequency of alcohol
consumption, differentiating between workdays and weekends/holidays, and enables quantifying
weekly intakes that are deemed to be hazardous by the WHO.
2.5. Statistical Analysis
Once the participants’ responses had been entered into a database, they were processed and
analyzed. All statistical analyses of the data were performed using the IBM SPSS Statistics V.24
software program (SPSS Inc., Chicago, IL, USA). First, the participants’ characteristics were described,
calculating the distribution of frequencies, 95% confidence intervals, and measures of the central
trends and dispersions. Thereafter, tests involving the comparison of proportions (likelihood-ratio
chi-squared test) and means (Student’s t-test), or their non-parametric alternative (Mann–Whitney
U test), were used to test for independence among the main variables using a significance level of 0.05.
Lastly, two logistic regression models were fitted to ascertain the association between the differentHealthcare 2020, 8, 538 4 of 11
variables and the presence of overweight and obesity, with these being used as dependent variables and
adjustments being made for possible confounding factors. The model was interpreted by determining
the statistical significance of the coefficients with the aid of the Wald test and the odds ratios of the
explanatory variables.
3. Results
A total of 199 students were evaluated, with a mean age of 20.7 years (SD = 5.7 years). Table 1
shows the breakdown of their socio-demographic characteristics.
Table 1. Socio-demographic characteristics of the students.
Characteristics No. %
Sex
Men 33 16.6
Women 166 83.4
Age
18 to 19 years 118 59.3
20 to 24 years 50 25.1
25 years or over 31 15.6
Qualification
Nursing 37 18.6
Obstetrics 50 25.1
Stomatology 45 22.6
Psychology 47 23.6
Medical technology 18 9.0
No data 2 1.0
Academic year
First 94 47.2
Second 96 48.2
Third 9 4.5
Origin
Town of fewer than 10,000 inhabitants 28 14.0
Town of 10,000 to 40,000 inhabitants 20 10.1
Town of over 40,000 inhabitants 146 73.4
No data 5 2.5
Form of coexistence
Lives alone 20 10.1
Lives with a partner (with or without
19 9.5
children)
Lives with parents (with or without
154 77.4
siblings)
Other forms of coexistence 6 3.0
Social class *
I 25 12.6
II 55 27.6
III (a,b) 31 15.6
IV (a,b,c) 25 12.6
V–VII (a,b) 39 19.5
No data 24 12.1
* Social class: Type I: Higher-grade professionals, administrators, and officials; managers in large industrial
establishments; large proprietors. Type II: Lower-grade professionals, administrators, and officials; higher-grade
technicians; managers in small industrial establishments; supervisors of non-manual employees. Type IIIa: Routine
non-manual employees, higher grade (administration and commerce). Type IIIb: Routine non-manual employees,
lower grade (sales and services). Type IVa: Small proprietors, artisans, etc., with employees. Type IVb: Small
proprietors, artisans, etc., without employees. Type IVc: Farmers, smallholders, and other self-employed workers in
primary production. Type V: Lower-grade technicians and supervisors of manual workers. Type VI: Skilled manual
workers. Type VIIa: Semi-skilled and unskilled manual workers (not in agriculture or other forms of primary
production). Type VIIb: Agricultural and other workers in primary production.Healthcare 2020, 8, 538 5 of 11
Healthcare 2020, 8, x 5 of 11
Excluding
Excluding students
students among
among whom
whom the the BMI could not
BMI could not be
be ascertained
ascertained (10
(10 cases),
cases), the
the prevalence
prevalence of
of
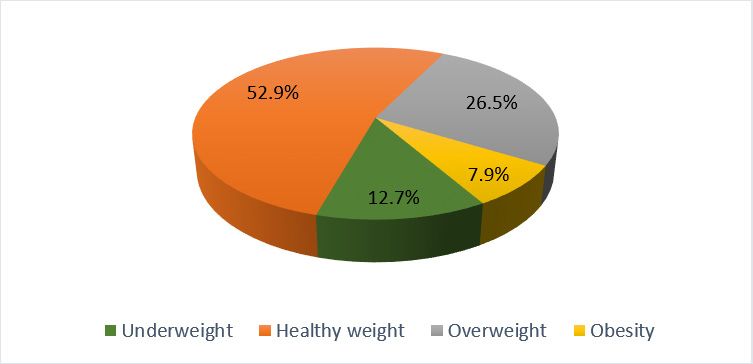
overweight (BMI = 25.0–29.9 kg/m 2 ) was 26.5% (95% CI = 19.9–33.0%), and that of obesity (BMI ≥ 30.0 kg/m2 )
overweight (BMI = 25.0–29.9 kg/m2) was 26.5% (95% CI = 19.9–33.0%), and that of obesity (BMI ≥ 30.0
was
kg/m7.9% (95%
2) was 7.9% = 3.8–12.1%)
CI (95% (Figure 1).
CI = 3.8–12.1%) Overall,
(Figure 1). 34.4% of students
Overall, 34.4% of(95% CI = (95%
students 27.4–41.4%) presented
CI = 27.4–41.4%)
with a BMI > 25 kg/m 2.
presented with a BMI > 25 kg/m . 2
Figure 1.
Figure 1. Distribution
Distribution of
of students
students by body mass
by body mass index
index (BMI).
(BMI).
Among the students, the proportion
proportion of inactive subjects was 43.7%, the proportion of those doing
moderate physical activity was 21.6%, and the proportion of those doing doing intense
intense activity
activity waswas 34.7%.
34.7%.
The proportion
proportionofofsubjects
subjects with
withoverweight
overweight or obesity
or obesitywaswasnot significantly different
not significantly between
different the active
between the
and
activeinactive subjects,
and inactive though,
subjects, amongamong
though, those doing intense
those doing physical
intense exercise,
physical a higher
exercise, mean mean
a higher lean body
lean
mass
body value was found
mass value (45.6 ±(45.6
was found 7.2 kg forkg
± 7.2 students doingdoing
for students intense exercise
intense vs.±43.5
vs. 43.5
exercise 7.1 ±kg
7.1for
kgthe
forrest;
the
= 0.01),
prest; as was a higher mean muscle mass value (43.3 ± 6.9 kg for students
p = 0.01), as was a higher mean muscle mass value (43.3 ± 6.9 kg for students doing intensedoing intense exercise vs.
41.3 ± 6.7vs.
exercise kg41.3
for ±the
6.7rest; p =the
kg for 0.01).
rest; p = 0.01).
With
With respect
respecttotounhealthy
unhealthy habits, the the
habits, proportion of smokers
proportion was 12.6%,
of smokers that of hazardous
was 12.6%, drinkers
that of hazardous
was 1.5%, was
drinkers and that
1.5%,of substance
and that abusers was 1.5%.
of substance The proportion
abusers was 1.5%. ofThe smokers was significantly
proportion of smokers higher
was
among obesehigher
significantly subjectsamong
(50% vs. 9.8%;
obese p < 0.001),
subjects (50%and vs. overall
9.8%; pamong
< 0.001),subjects presenting
and overall among withsubjects
a high
BMI (20.3%with
presenting vs. 8.9%;
a highp= BMI0.02).
(20.3% vs. 8.9%; p = 0.02).
In terms
terms ofof socio-demographic
socio-demographiccharacteristics
characteristics(Table
(Table2),2),while
whilethetheproportion
proportion of students
of students with an
with
under-
an under- or overweight
or overweightstatusstatus
was not significantly
was differentdifferent
not significantly between between
men and women,
men andthewomen,proportionthe
of obese subjects
proportion of obesewas significantly
subjects higher among
was significantly highermen (20.0%
among menvs.(20.0% p =5.7%;
5.7%; vs. 0.01).p =The mean
0.01). Theage in
mean
years
age inwasyearshigher in both
was higher in obese
both obese ± 8.9±SD
(23.9 (23.9 8.9 vs. ± 5.4
20.420.4
SD vs. SD;
± 5.4 SD;p=p =0.02)
0.02)and
andoverweight
overweight subjects
(22.7 ± ± 7.4 SD vs. 20.0 ±± 4.9 4.9 SD; p = 0.01). When
= 0.01). When itit came
came to to forms of coexistence, the proportion of
overweight or obese students was significantly lower among those who cohabited with their parents
compared to
in the family home compared to other
other forms
forms ofof coexistence
coexistence(30.1%
(30.1%vs. 48.8%; pp =
vs. 48.8%; = 0.02). No
No relationship
relationship
was observed between the presence of overweight or obesity and social class based on occupation or
size of the town of origin.
Table 2. Level
Table 2. Levelof
ofphysical
physicalactivity,
activity,healthy
healthydietary criteria,
dietary and
criteria, andsocio-demographic characteristics
socio-demographic of the
characteristics of
students thatthat
the students presented a BMI
presented within
a BMI normal
within limits
normal vs. avs.
limits high BMI.BMI.
a high
Variables BMI < 25BMI
kg/m< 225No.
kg/m
(%)2 BMI
BMI≥≥25 kg/m2 2 No. (%)
25kg/m p
Variables p
No. (%) No. (%)
Level of physical activity 0.551
Inactive Level of physical activity 58 (46.8) 26 (40.0) 0.551
Moderate Inactive 26 (21.0) 58 (46.8) 26 (40.0)
13 (20.0)
Intense Moderate 40 (32.3) 26 (21.0) 13
26(20.0)
(40.0)
Intense 40 (32.3) 26 (40.0)
Healthy dietary criteria 0.889
2 criteria or Healthy
fewer dietary criteria 52 (52.5) 29 (53.7) 0.889
3 criteria or 2over
criteria or fewer 47 (47.5) 52 (52.5) 29
25(53.7)
(46.3)
3 criteria or over 47 (47.5) 25 (46.3)
Sex 0.481
Men 18 (14.5) 12 (18.5)Healthcare 2020, 8, 538 6 of 11
Table 2. Cont.
Variables BMI < 25 kg/m2 No. (%) BMI ≥ 25 kg/m2 No. (%) p
Sex 0.481
Men 18 (14.5) 12 (18.5)
Women 106 (85.5) 53 (81.5)
Form of coexistence 0.023
Live with partner 102 (82.3) 44 (67.7)
No live with partner 22 (17.7) 21 (32.3)
Origin 0.845
Town of fewer than 40,000 inhabitants 28 (23.3) 16 (24.6)
Town of over than 40,000 inhabitants 92 (76.7) 49 (75.4)
Regarding a healthy diet, the mean compliance with the eight criteria considered was 2.5 (SD = 1.3),
with the distribution shown in Table 3 below. Although compliance with the healthy dietary criteria
was lower among subjects with a BMI > 25 kg/m2 , the difference was not statistically significant with
respect to those who presented a BMI within normal limits.
Table 3. Description of compliance with healthy dietary criteria among the students.
Healthy Dietary Criteria Men No. (%) Women No. (%) Total No. (%) p
Consumption of 3–4 weekly rations of fish and seafood
Yes 7 (21.2) 32 (19.3) 39 (19.6) 0.797
No 25 (75.8) 129 (77.7) 154 (77.4)
No data 1 (3.0) 5 (3.0) 6 (3.0)
Consumption of 3–4 weekly rations of lean meat
Yes 9 (27.3) 36 (21.7) 45 (22.6) 0.518
No 24 (72.7) 127 (76.5) 151 (75.9)
No data 0 (0.0) 3 (1.8) 3 (1.5.5)
Consumption of 3–4 weekly rations of eggs
Yes 9 (27.3) 50 (30.1) 59 (29.6) 0.682
No 24 (72.7) 112 (67.5) 136 (68.3)
No data 0 (0.0) 4 (2.4) 4 (2.0)
Consumption of 2–4 weekly rations of legumes
Yes 11 (33.3) 58 (34.9) 69 (34.7) 0.840
No 21 (63.6) 102 (61.4) 123 (61.8)
No data 1 (3.0) 6 (3.6) 7 (3.5)
Consumption of 2–4 daily rations of dairy products
(milk, cheese, yogurt)
Yes 11 (33.3) 61 (36.7) 72 (36.2) 0.744
No 21 (63.6) 102 (61.4) 123 (61.8)
No data 1 (3.0) 3 (1.8) 4 (2.0)
Consumption of ≥2 daily rations of green leafy and
other vegetables
Yes 9 (27.3) 33 (19.9) 42 (21.1) 0.370
No 24 (72.7) 130 (78.3) 154 (77.4)
No data 0 (0.0) 3 (1.8) 3 (1.5)
Consumption of ≥3 daily rations of fresh fruit
Yes 3 (9.1) 24 (14.5) 27 (13.6) 0.490
No 30 (90.9) 130 (78.3) 160 (80.4)
No data 0 (0.0) 12 (7.2) 12 (6.0)
Consumption of 4–6 daily rations of bread, cereals, pasta,
rice, and potatoes
Yes 25 (75.8) 112 (67.5) 137 (68.8) 0.421
No 8 (24.2) 51 (30.7) 59 (29.6)
No data 0 (0.0) 3 (1.8) 3 (1.5)
The logistic regression (Table 4) showed that the variables associated with the existence of a
high BMI (≥25 kg/m2 ) were being aged 20 years or over (OR = 2.5) and a smoking habit (OR = 3.2),
while those associated with the presence of obesity (BMI ≥ 30 kg/m2 ) were being aged 20 years or over
(OR = 4.0) and the male gender (OR = 5.5).Healthcare 2020, 8, 538 7 of 11
Table 4. Variables that were found by logistic regression to be associated with the presence of a
high BMI.
Variables Variables B Wald p OR (95% CI)
Age ≥ 20 years vs. age ≤ 20 years 0.923 7.788 0.005 2.5 (1.3–4.8)
Smoking habit vs. no smoking habit 1.148 4.843 0.028 3.2 (1.3–8.8)
BMI > 25 kg/m2 Active participant vs inactive participant 0.320 0.949 0.330 1.4 (0.7–2.6)
Healthy diet vs. unhealthy diet 0.108 0.223 0.637 1.1 (0.7–1.7)
Man vs. woman 0.042 0.08 0.928 1.0 (0.4–2.6)
Age ≥ 20 years vs. age ≤ 20 years 1.391 5.287 0.021 4.1 (1.2–13.1)
Smoking habit vs. no smoking habit 0.225 0.388 0.534 1.253 (0.616–2.546)
Obesity (BMI ≥ 30 kg/m2 ) Active participant vs inactive participant 0.088 0.023 0.878 1.1 (0.3–3.3)
Healthy diet vs. unhealthy diet 0.140 0.131 0.718 0.8 (0.4–18)
Man vs. woman 1.7120 7.836 0.005 5.5 (1.7–18.3)
The independent variables that were included in the models were age, smoking habit, active participant, healthy diet,
and sex, adjusted by BMI.
4. Discussion
This study evaluated the BMI of health sciences students in Peru’s Amazonia region, with the aim
of describing the proportion of obesity and/or overweight, and the relationship that these may display
with other variables, such as the level of physical activity, type of diet, and presence of unhealthy
habits. The results show that a high proportion of university students presented with a high BMI.
Approximately one-third of students had a BMI > 25 kg/m2 , with around one in four presenting with
overweight and close to 8% presenting with obesity. These results are comparable to those of other
studies conducted on Latin American university students [22,23].
A study conducted in Mexico in 2015 by Lorenzini et al. [24] reported a significantly higher
proportion of obese students among men. In our study, no statistically significant differences related to
sex were observed among students with a BMI ≥ 25 kg/m2 , which is consistent with other studies that
describe a higher prevalence of overweight among women [25,26].
Physical activity is beneficial at both the physical and psychological levels, improves body
composition, and reduces the development of metabolic diseases [27,28]. Despite the benefits
demonstrated by physical activity, our results show, like others, that a high proportion of youth
were inactive or sedentary subjects [28–30]. However, in our results and in those of other previous
studies [31], the proportion of overweight or obesity was not significantly different between active or
inactive students.
It is during the university stage that young adults usually first assume responsibility for their diet,
and indeed, they have been described as a vulnerable group from a nutritional standpoint [32–34].
Despite the fact that our study subjects were health sciences students, this group has been reported
as having a dietary imbalance caused by a high intake of nutrients, with refined carbohydrates,
simple sugars, and saturated fats in particular, as well as a low intake of fruit and green leafy
vegetables [28,34,35]. In our case, even though compliance with healthy dietary criteria was lower
among subjects with a high BMI, the difference did not prove to be statistically significant vis-à-vis
those who had a BMI within the normal limits.
The university setting increases the risk of developing a smoking habit, and our study found a
heavier smoking habit among individuals who presented with a high BMI. The proportion of student
smokers was approximately 13%, which is a figure that is very similar to that reported for nursing
students in Colombia [36]. Nonetheless, this proportion is lower than that observed in university
students drawn from other disciplines and countries [37–39]. On comparing the prevalence in both
sexes, no significant difference was observed between men and women, a finding that is in line with
the results of other studies conducted on university students [38,40], though there is no unanimity
in the references consulted since higher tobacco use has occasionally been reported in males [36].
With respect to alcohol, only 1.5% of students displayed a level of consumption that is considered
hazardous. This result reveals a low proportion of consumption, which is a finding that is not reported
in other studies conducted on university students from different countries [41,42].Healthcare 2020, 8, 538 8 of 11
Universities are ideal scenarios for creating health and wellbeing promotion settings and for
implementing lifestyle improvement strategies [43]. It is important to implement programs that
include interventions that are designed to increase students’ physical activity levels and reduce
sedentariness [30]. These programs should also provide educational activities that focus on healthy
eating habits and target reducing the consumption of fats, carbohydrates, and sugars. Stress should
also be laid on the need to design interventions aimed at the prevention of alcohol consumption
and smoking in the university setting. Previous experiences show satisfactory results, though it is
suggested that studies should be undertaken on larger populations [44,45].
In general, risk behaviors, such as smoking and alcohol consumption, lack of physical activity,
and suboptimal diet, as well as their consequences, including overweight and obesity, are important
public health problems. In the future, new studies should be undertaken that ascertain which risk factors
may be modifiable when it comes to preventing cardiovascular diseases and other health problems.
To date, it has been established that certain socio-demographic characteristics and habits are
associated with alterations in BMI, yet knowledge in this area is limited since most research has
been carried out on specific groups and there may be important differences in different cultural
settings [46–48]. Furthermore, the references consulted on obesity and/or overweight among university
students identify gaps in the knowledge [49–52] since there has been no uniform methodology in
the evaluations performed and it is not a problem that is studied in depth in all countries or specific
regions, as is the case in the Amazonia region of Peru.
Our data should be considered with caution since there was a large difference in the size of the
participant groups (33 men and 166 women) and they were not randomly selected subjects; thus,
the conclusions might be affected by the volunteer bias.
Although a high response rate was obtained, when it comes to studying limitations, it should
be noted that our results might underestimate overweight/obesity if classroom attendance proves
to be related to healthier lifestyles. There could also be biases in the results if non-attendance were
proven to be more frequent among persons with different socio-demographic characteristics and work
obligations. With respect to the students’ degree of truthfulness in their replies, this can be viewed
as high in view of the fact that questionnaire completion was both voluntary and anonymous. It is
important to recognize that there is also the risk of a socially desirable response bias.
5. Conclusions
In conclusion, one-third of all health sciences students in Amazonia presented with a BMI of
25 kg/m2 or higher. While the proportion of overweight students was higher in those aged over
20 years and in smokers, the proportion of obesity was higher in subjects aged over 20 years and in
males. In the university setting, the development of more overweight- and obesity-preventive activities
and educational interventions would therefore be desirable, especially if the target subjects are future
health professionals, who should ideally rank as a standard for healthy habits in any given society.
Author Contributions: Conceptualization, J.R.-S. and M.E.V.-B.; methodology, J.R.-S., M.E.V.-B., and J.L.-T.-H.;
software, J.R.-S.; validation, J.R.-S., M.E.V.-B., Á.L.-G., and J.L.-T.-H.; formal analysis, J.R.-S. and J.L.-T.-H.;
investigation, J.R.-S., Á.L.-G., M.E.V.-B., J.J.-M.-C., Z.E.L.-E., and J.L.-T.-H.; resources, J.R.-S. and M.E.V.-B.; data
curation, J.R.-S., M.E.V.-B., and Z.E.L.-E.; writing—original draft preparation, J.R.-S., Á.L.-G., and J.L.-T.-H.;
writing—review and editing, J.R.-S., Á.L.-G., M.E.V.-B., J.J.-M.-C., Z.E.L.-E., and J.L.-T.-H.; visualization, J.R.-S.,
Á.L.-G., M.E.V.-B., J.J.-M.-C., Z.E.L.-E., and J.L.-T.-H.; supervision, J.R.-S., Á.L.-G., M.E.V.-B., J.J.-M.-C., Z.E.L.-E.,
and J.L.-T.-H.; project administration, J.R.-S. and Á.L.-G.; funding acquisition, J.R.-S., Á.L.-G., and J.L.-T.-H.
All authors have read and agreed to the published version of the manuscript.
Funding: This research was funded by a grant from the European Regional Development Fund (ERDF)
(Fondo Europeo de Desarrollo Regional (FEDER) (DOCM 19/02/20)).
Acknowledgments: We should like to thank the senior staff and lecturers of the Scientific University of Peru for
their collaboration in conducting this study, as well as the health sciences students who voluntarily participated
in it.
Conflicts of Interest: The authors of this paper declare that there were no conflict of interest.Healthcare 2020, 8, 538 9 of 11
References
1. GBD 2015 Risk Factors Collaborators. Global, regional, and national comparative risk assessment of
79 behavioural, environmental and occupational, and metabolic risks or clusters of risks, 1990–2015:
A systematic analysis for the Global Burden of Disease Study 2015. Lancet 2016, 388, 1659–1724. [CrossRef]
2. Sapag, J.C.; Lange, I.; Campos, S.; Piette, J.D. Estrategias innovadoras para el cuidado y el autocuidado
de personas con enfermedades crónicas en América Latina. Rev. Panam. Salud Publica 2010, 27, 1–9.
[CrossRef] [PubMed]
3. Reig, A.; Cabrero, J.; Ferrer, R.I.; Richart, M. La Calidad y el Estado de Salud de los Estudiantes Universitarios;
Universidad de Alicante: Alicante, Spain, 2003.
4. World Health Organization. Obesity: Preventing and Managing the Global Epidemic Report of a WHO Consultation;
WHO: Geneva, Switzerland, 2000.
5. Basterra-Gortari, F.J.; Bes-Ratrollo, M.; Ruiz-Canela, M.; Gea, A.; Martínez-González, M.A. Prevalence of
obesity and diabetes in Spanis adults 1987–2012. Med. Clín. 2017, 148, 250–256.
6. Štefan, L.; Čule, M.; Milinović, I.; Juranko, D.; Sporiš, G. The Relationship between Lifestyle Factors and
Body Composition in Young Adults. Int. J. Environ. Res. Public Health 2017, 14, 893. [CrossRef]
7. Benites, B.; Portocarrero, S.; Sanchez, R. Enfermedades no Transmisibles y Transmisibles 2016; Instituto Nacional
de Estadística e Informática INEI: Lima, Peru, 2017.
8. Tarqui-Mamani, C.; Sánchez-Abanto, J.; Alvarez-Dongo, D.; Gómez-Guizado, G.; Valdivia-Zapana, S.
Tendencia del sobrepeso, obesidad y exceso de peso en el Perú. Rev. Peru. Epidemiol. 2013, 17, 1–7.
9. Cossio-Bolaños, M.A.; De Arruda, M.; Moyano-Portillo, A.; Gañán-Moreno, E.; Pino-López, L.M.;
Lancho-Alonso, J.L. Body composition of young university students in relation to health. Nutr. Clín.
Diet. Hosp. 2011, 31, 15–21.
10. Deliens, T.; Deforche, B.; De Bourdeaudhuij, I.; Clarys, P. Determinants of physical activity and sedentary
behaviour in university students: A qualitative study using focus group discussions. BMC Public Health
2015, 15, 201. [CrossRef]
11. Caamaño-Isorna, F.; Corral, M.; Parada, M.; Cadaveira, F. Factors associated with risky consumption and heavy
episodic drinking among Spanish university students. J. Stud. Alcohol Drugs 2008, 69, 308–312. [CrossRef]
12. Gerstenkorn, A.; Suwała, M. Alcohol use by future physicians-medical and social problem. Wiad. Lekarskie
2003, 56, 402–406.
13. Rabanales Sotos, J.; López González, A.; Párraga Martínez, I.; Campos Rosa, M.; Simarro Herraes, M.J.;
López-Torres Hidalgo, J. Prevalence of hazardous drinking among nursing students. J. Adv. Nurs. 2015,
71, 581–590. [CrossRef]
14. Leiva, V. Analysis of factors associated with the drug phenomenon in students of second and fourth year of
“Licenciatura en Enfermería”. Rev. Cienc. Soc. 2009, 123, 105–118.
15. Orellana Acosta, K.; Urrutia Manyari, L. Evaluación del Estado Nutricional, Nivel de Actividad Física y
Conducta Sedentaria en los Estudiantes Universitarios de la Escuela de Medicina de la Universidad Peruana de
Ciencias Aplicadas; Universidad Peruana de Ciencias Aplicadas—UPC: Lima, Peru, 2013; Available online:
http://repositorioacademico.upc.edu.pe/upc/handle/10757/301568 (accessed on 4 May 2016).
16. Diaz, T.Z. El Apoyo Social y Estilos de Vida Promotores de Salud en Estudiantes de Enfermeria de la
Universidad Nacional del Callao. Ph.D. Thesis, National University of Callao, Callao, Peru, 2014.
17. Sardinha, L.B.; Santos, R.; Vale, S.; Silva, A.M.; Ferreira, J.P.; Raimundo, A.M.; Moreira, H.; Baptista, F.;
Mota, J. Prevalence of overweight and obesity among Portuguese youth: A study in a representative sample
of 1018-year-old children and adolescents. Int. J. Pediatr. Obes. 2011, 6, e124–e128. [CrossRef]
18. Domingo-Salvany, A.; Bacigalupe, A.; Carrasco, J.M.; Espelt, A.; Ferrando, J.; Borrell, C. Propuesta de clase
social neoweberiana y neomarxista a partir de la Clasificación Nacional de Ocupaciones 2011. Gac. Sanit.
2013, 27, 263–272. [CrossRef]
19. Mantilla Toloza, S.C.; Gómez-Conesa, A. El cuestionario Internacional de Actividad Física. Un instrumento
adecuado en el seguimiento de la actividad física poblacional. Rev. Iberoam. Fisioter. Kinesiol. 2007,
10, 48–52. [CrossRef]
20. Rodríguez, I.T.; Ballart, J.F.; Pastor, G.C.; Jorda, E.B.; Val, V.A. Validation of a short questionnaire on frequency
of dietary intake: Reproducibility and validity. Nutr. Hosp. 2008, 23, 242–252.Healthcare 2020, 8, 538 10 of 11
21. Gual, A.; Contel, M.; Segura, L.; Riba, A.; Colom, J. The ISCA (Systematic Interview of Alcohol Consumption),
a new instrument to detect risky drinking. Med. Clín. 2001, 117, 685–689.
22. De Piero, A.; Bassett, N.; Rossi, A.; Sammán, N. Trends in food consumption of university students. Nutr. Hosp.
2015, 31, 1824–1831.
23. Rangel Caballero, L.G.; Rojas Sánchez, L.Z.; Gamboa Delgado, E.M. Overweight and obesity in Colombian
college students and its association with physical activity. Nutr. Hosp. 2014, 31, 629–636.
24. Lorenzini, R.; Betancur-Ancona, D.A.; Chel-Guerrero, L.A.; Segura-Campos, M.R.; Casterllanos-Ruelas, A.F.
Estado nutricional en relación con el estilo de vida de estudiantes unversitarios mexicanos. Nutr. Hosp. 2015,
32, 94–100.
25. Córdoba Adaya, D.; Carmona González, M.; Terán Varela, O.E.; Márquez Molina, O. Relación del estilo de
vida y estado de nutrición en estudiantes universitarios: Estudio descriptivo de corte transversal. Medwave
2013, 13. [CrossRef]
26. Zea-Robles, A.C.; León-Ariza, H.H.; Botero-Rosas, D.A.; Afanador-Castañeda, H.D.; Pinzón-Brabo, L.A.
Univesity students cardiovascular risk factors and their relationship with body composition.
Rev. Salud Publica 2014, 16, 505–515. [PubMed]
27. Sanchez-Guette, L.; Herazo-Beltrán, Y.; Galeano-Muñoz, L.; Romero-Leiva, K.; Guerrero-Correa, F.;
Mancilla-González, G. Comportamiento sedentario en estudiantes universitarios. Rev. Latinoam. Hipertens.
2019, 14, 232–236.
28. Solera Sánchez, A.; Gamero Lluna, A. Hábitos saludables en universitarios de ciencias de la salud y de otras
ramas de conocimiento: Un estudio comparativo. Rev. Esp. Nutr. Hum. Diet. 2019, 23, 271–282. [CrossRef]
29. Laguado Jaimes, E.; Gómez Díaz, M.P. Estilos de vida saludables en estudiantes de Enfermería en la
Universidad Cooperativa de Colombia. Rev. Hacia Promoc. Salud 2014, 19, 68–83.
30. Sanchez-Ojeda, M.A.; De Luna-Bertos, E. Hábitos de vida saludable en la población Universitaria. Nutr. Hosp.
2015, 31, 1910–1919. [PubMed]
31. Morales, G.; Balboa-Castillo, T.; Muñoz, S.; Belmar, C.; Soto, Á.; Schifferli, I.; Guillen-Grima, F. Association
between cardiometabolic risk factors, physical activity and sedentariness in Chilean university students.
Nutr. Hosp. 2017, 34, 1345–1352.
32. Cervera Burriel, F.; Serrano Urrea, R.; Vico García, C.; Milla Tobarra, M.; García Meseguer, M.J. Hábitos
alimentarios y evaluación nutricional en una población universitaria. Nutr. Hosp. 2013, 28, 438–446.
33. Godoy Cumillaf, A.; Valdés Badilla, P.; Fariña Herrera, C.; Cárcamo Mora, F.; Medina Herrera, B. Asociación
entre la condición física, estado nutricional y rendimiento académico en estudiantes de educación física.
Nutr. Hosp. 2015, 32, 1722–1728.
34. Landeros Ramirez, P.; Gómez Cruz, Z.; Rimoldi Rentería, M.J.; Parada Barrera, G.; Núñez-Hernández, A.
Índice de Masa Corporal y Rendimiento Académico en Estudiantes Universitarios. Rev. Salud Pública Nutr.
2018, 17, 34–40. [CrossRef]
35. Sanchez-Fideli, M.A.; Gutiérrez-Hervás, A.; Rizo-Baeza, M.; Cortés-Castell, E. Estudio longitudinal sobre la
adherencia al patron de Dieta Mediterranea en estudiantes de Ciencias de la Salud. Rev. Esp. Nutr. Hum. Diet.
2018, 22, 4–13. [CrossRef]
36. Bautista-Pérez, F.; Ferrel-Ortega, F.R.; Ferrel-Ballestas, L.F.; Camacho-Rodríguez, D.; Reyes-Ríos, L.Á.
Sex-Based Differences in Tobacco Consumption among University Students. Rev. Cuba. Enferm. 2018,
34, 612–623.
37. Atwoli, L.; Mungla, P.A.; Ndung’u, M.N.; Kinoti, K.C.; Ogot, E.M. Prevalence of substance use among college
students in Eldoret, western Kenya. BMC Psychiatry 2011, 11. [CrossRef] [PubMed]
38. Garrido-Gonzalez, I.; Bugarín-González, R.; Machín-Fernández, A.J. Consumo de drogas en estudiantes de
enfemeria. Enferm. Clin. 2016, 26, 174–180. [CrossRef] [PubMed]
39. Fernández-García, D.; Ordás, B.; Fernández-Peña, R.; Bárcena-Calvo, C.; Ordoñez, C.; Amo-Setién, F.J.;
Gómez-Salgado, J.; Martínez-Isasi, S. Smoking in nursing students: A multicenter prevalence study. Medicine
2020, 99. [CrossRef]
40. Barra, L.C.; Fernández, P.P.; Granada, F.G.; Ávila, P.C.; Mallea, J.M.; Rodríguez, Y.M. Smoking among
undergraduate university students. Rev. Med. Chile 2015, 143, 1343–1350.
41. Labe, A.K.; Maisto, S.A. Alcohol expectancy challenges for college students: A narrative review.
Clin. Psychol. Rev. 2011, 31, 673–683. [CrossRef]Healthcare 2020, 8, 538 11 of 11
42. Hidalgo, J.L.T.; Pretel, F.A.; Bravo, B.N.; Rabadan, F.E.; Serrano Selva, J.P.; Latorre Postigo, J.M.; Martínez, I.P.
Training medical students about hazardous drinking using simple assessment techniques. Health Educ. J.
2014, 73, 295–302. [CrossRef]
43. Martínez-Riera, J.R.; Pino, C.G.; Pons, A.A.; Mendoza, M.C.G.; López-Gómez, J.; Acevedo, H.V.A.
La Universidad como comunidad: Universidades promotoras de salud. Informe SESPAS 2018. Gac. Sanit.
2018, 32, 86–91. [CrossRef]
44. Sotos, J.R.; Gonzalez, Á.L.; Martínez, I.P.; Rosa, M.C.; Herraez, M.J.S.; Hidalgo, J.L.T. Self-assessment of
alcohol consumption as a health-education strategy in nursing students. Nurse Educ. Today 2015, 35, 132–137.
45. Castillo, I.; Solano, S.; Sepúlveda García, A.R. Programa de prevención de alteraciones alimentarias y
obesidad en estudiantes universitarios mexicanos. Psychol. Cond. 2016, 24, 5–28.
46. Karagülle, D.; Donath, C.; Grässel, E.; Bleich, S.; Hillemacher, T. Binge drinking in adolescents and young
adults. Fortschr. Neurol. Psychiatr. 2010, 78, 196–202. [CrossRef]
47. Ramos, O.A.; Jaimes, M.A.; Juajinoy, A.M.; Lasso, A.C.; Jácome, S.J. Prevalencia y factores relacionados
de sobrepeso y obesidad en estudiantes de una Universidad publica. Rev. Esp. Nutr. Comunitaria 2017,
23. [CrossRef]
48. Asian Chaves, R.; Pasos Cervera, R.D.L.A. Overweight and obesity in Indigenous Mayan Communities.
Economy, Culture and Gender. Rev. Estud. Reg. 2017, 109, 139–163.
49. González-Zapata, L.; Carreño-Aguirre, C.; Estrada, A.; Monsalve-Alvarez, J.; Alvarez, L.S. Exceso de peso
corporal en estudiantes universitarios según variables sociodemográficas y estilos de vida. Rev. Chil. Nutr.
2017, 44, 251–261. [CrossRef]
50. Villena Chávez, J.E. Prevalencia de sobrepeso y obesidad en el Perú. Rev. Peru. Ginecol. Obstet. 2017,
63, 593–598.
51. Diez-Canseco, F.; Saavedra-Garcia, L. Social programs and reducing obesity in Peru: Reflections from the
research. Rev. Peru. Med. Salud Publica 2017, 34, 105–112. [CrossRef]
52. Villca Villegas, J.L.; Chavez-Soliz, H.R.; Mamani Ortiz, Y.M.; Arévalo Gonzales, M.R. Correlation and
concordance of waist circumference and waist to height index with body mass index. Gac. Med. Boliv. 2019,
42, 122–126. [CrossRef]
Publisher’s Note: MDPI stays neutral with regard to jurisdictional claims in published maps and institutional
affiliations.
© 2020 by the authors. Licensee MDPI, Basel, Switzerland. This article is an open access
article distributed under the terms and conditions of the Creative Commons Attribution
(CC BY) license (http://creativecommons.org/licenses/by/4.0/).You can also read