Preparing for Proxy Season 2023 - November 2022 - Featuring Commentary From
←
→
Page content transcription
If your browser does not render page correctly, please read the page content below

November 2022

Preparing for
Proxy Season 2023               An Equilar Publication

    Featuring Commentary From
2

Table of Contents
Executive Summary                                                    3

Methodology                                                          5

Key Findings                                                         5

Beyond the Numbers                                                   6

Data Points and Figures                                              9

Equilar 100 Companies Including a Proxy Summary                      9

Equilar 100 Companies Including a CD&A Table of Contents            10

Equilar 100 Companies Including a Compensation Program Checklist    11

Equilar 100 Companies Including a Supplemental Graph                12

Equilar 100 Companies Including a Pay for Performance Graph         13

Equilar 100 Companies Including an Alternative Pay Graph or Table   15

Equilar 100 ESG Disclosures                                         16

Equilar 100 Board Diversity Disclosures                             18

Commentary From DFIN                                                20

A Deep Dive: The Essentials of Proxy Design                         20

About the Contributor                                               23
EXECUTIVE SUMMARY                                                                                             3

Managing Editor
and Lead Author
Amit Batish
                                     Executive Summary
Contributing Author                  As 2022 comes to a close, companies across Corporate America are
Shane Carroll                        preparing for a year that will likely be headlined by new disclosure
                                     requirements. On August 25, 2022, the United States Securities and
Data and Analysis
                                     Exchange Commission (SEC) officially adopted Pay Versus Performance
Andrew Jeong
                                     rules, following several rounds of comments and proposals. The new
Yifan Tu
Lexie Tang
                                     rules require public companies to disclose information reflecting the
Courtney Yu                          relationship between compensation actually paid to a company’s named
                                     executive officers (NEOs) and the company’s financial performance.
Design and Layout
Christina Cheng                      Of course, investors and other key stakeholders will also pay close
Gail Schneiderman                    attention to how companies showcase their practices related to
Danny Shin                           environmental, social and governance (ESG) issues, human capital
                                     management (HCM), and board oversight, to name a few. Communicating
                                     these policies in a clear and concise manner is more critical than ever
©2022 Equilar, Inc. The material     before. The annual proxy statement (DEF14A) has evolved into a tool for
in this report may not be
                                     companies to effectively communicate their respective governance and
reproduced or distributed in
whole or in part without the         executive compensation practices.
written consent of Equilar,
Inc. This report provides            Nevertheless, the proxy features a high volume of information, and
information of general interest      investors and other stakeholders may find it challenging to navigate the
in an abridged manner and is         document. At times, the most critical disclosures may be overlooked or
not intended as a substitute for
accounting, tax, investment,         missed due to the design of the document. Indeed, the overall design of
legal or other professional          the proxy and compensation discussion and analysis (CD&A) portion of
advice or services. Readers
                                     the document are paramount. For a reader seeking information about a
should consult with the
appropriate professional(s)          specific issue, the use of navigational tools, charts and graphs and other
before acting on information         visual elements are immensely helpful in guiding them to the information
contained in this report. All data
and analysis provided in this
                                     they need. Overall, the design of the document must strike a balance
report are owned by Equilar, Inc.    between required and voluntary disclosure using both technical and more
Reports are complimentary            broadly understandable language.
for Equilar subscribers. Non-
subscribers may purchase             The Preparing for Proxy Season 2023 publication features trends and
individual reports for $995.
                                     strategies in proxy design observed at Equilar 100 companies. DFIN offers
Please contact info@equilar.com
for more information.                independent commentary on disclosure strategies to effectively facilitate
                                     shareholder discourse and understanding of the proxy statement.

                                     Pay for Performance Disclosures Decline by More Than 50%—
                                     For Now
                                     The concept of pay for performance has long been advocated by
                                     investors, particularly given the influence they have on pay packages.
                                     However, the new SEC rules bring greater attention—and potentially
                                     greater scrutiny—to executive pay misalignment that may have not been
                                     observed by companies in several years. Companies across Corporate
                                     America have disclosed pay for performance graphs in their proxies since
                                     the implementation of the Dodd-Frank Wall Street Reform and Consumer
4

Protection Act in 2010. However, the prevalence of companies that
disclosed those graphs has steadily declined over the last five years.
In 2021, just 9% of the Equilar 100 disclosed a graph that showed the
relationship between their executives and financial performance. While
this is up one percentage point from 2020, the figure is down overall by
more than 50% since 2017 when 18.2% of companies disclosed a pay for
performance graph.
                                                                                Preparing for Proxy
The SEC’s new Pay Versus Performance disclosure requirement will indeed
                                                                                Season 2023
accelerate the use of these graphs; however, the looming question
remains whether the new rules will have any impact on Say on Pay results        Join Equilar and DFIN for a
in the coming years. While it’s too soon to draw any specific conclusions,      webinar that will focus on
                                                                                best practices for disclosing
it’s in the best interest of companies to begin preparing how to tell
                                                                                and communicating the top
their pay story. “Companies that have struggled on Say on Pay or are
                                                                                governance issues of 2023
anticipating a struggle with Say on Pay are going to find that the new
                                                                                within the proxy statement.
pay for performance disclosure probably doesn’t help them and will be
looked at as well,” said Joe Yaffe, Partner and West Coast Chair, Executive     www.equilar.com/webinars
Compensation and Benefits at Skadden, during a recent Equilar webinar
covering the new rules.

ESG Becomes a Proxy Standard
The discussion around ESG has dominated the governance landscape over
the last few years, and it is likely that this will continue into 2023. While
the ESG conversation expands across several topics, the impacts of the
COVID-19 pandemic have placed a greater emphasis on the “S” in ESG,
as companies have made employee well-being a top priority. As a result,
issues such as health and safety, income equity, and diversity, equity and
inclusion (DEI) have found their way on agendas at board and executive
meetings across Corporate America. Once again, the proxy statement
plays a pivotal role as a vehicle to communicate these policies to investors
who have become more socially conscious over the last two years.
Perhaps to no surprise, detailed disclosures of ESG policies have become
a majority practice at Equilar 100 companies over the last five years.
During the course of the study period, the percentage of companies
disclosing their ESG policies increased from 6.3% in 2017 to 63.9% in
2021. Furthermore, an additional 33% of companies mentioned their
ESG practices within the proxy statement. In total, 96.9% of companies
addressed ESG to some degree in their 2021 proxies—up from just
18.9% in 2017.
METHODOLOGY & KEY FINDINGS 5
Methodology
Preparing for Proxy Season 2023, an Equilar Publication, analyzes the annual proxy statements and CD&As of
companies in the Equilar 100—the top 100 U.S.-listed companies by revenue—over the last five fiscal years.
Samples included a total of 97 companies in 2021 and 2020, 96 companies in 2019, and 95 companies in
2018 and 2017. Fiscal year one was defined as companies with a fiscal year ending from June 1, 2021 and
May 31, 2022, with subsequent years following suit.
Disclosure examples were chosen to highlight both the typical and exceptional examples of proxy disclosure.
The narrative part of this report highlights proxy design trends and features of Equilar 100 companies. DFIN
has provided independent commentary for added context and color regarding new and existing disclosure
requirements, as well as insight on how the proxy statement serves as an effective vehicle to communicate
to shareholders.
Key Findings
80.4% 45.4%
Of Equilar 100 companies included a
Of Equilar 100 companies included
CD&A table of contents in 2021—
a proxy summary in 2021
up 22.4% from 2020
50.5% 96.9%
Decline in the prevalence of Equilar Of Equilar 100 companies discussed their
100 companies that disclosed a pay for ESG policies to some extent in 2021—
performance graph from 2017 to 2021 up from just 18.9% in 20176
Beyond the Numbers
A Q&A With Ron Schneider
To provide additional perspective on the trends uncovered in Preparing for Proxy Season 2023, Equilar sat
down with contributor Ron Schneider, Director of Corporate Governance Services at DFIN. Schneider shared
his thoughts on the new Pay Versus Performance disclosure requirements, best practices for proxy design and
more. An in-depth discussion featuring Schneider’s commentary can be found at the end of this publication.
Equilar: What are some key considerations that We think about this as a two- (or more) year process:
companies should consider with respect to the • In year one, companies are working diligently
design related to the SEC’s newly adopted Pay to comply, with most anticipating placing the
Versus Performance disclosure requirements? What required tables toward the back of the proxy,
steps during the compliance process can companies along with existing tables and not in the
take to ensure an effective disclosure? compensation discussion & analysis (“CD&A”)
Ron Schneider: There are three primary components section. For most companies, expectations for
of the new Pay Versus Performance (PvP) rule: “high design” around these disclosures is low in
1. PvP table: Disclosure of “compensation actually year one, and the main goal is to “comply.”
earned” (similar to “realizable pay”), and • Companies that already discuss “pay for
measures of company performance including performance (PfP)” in their own terms in the
company and peer TSR CD&A—many including PfP graphs often
2. Description of the relationship between the including realized or realizable pay—now will
tabular items (which can be narrative and/or also be disclosing a second, standardized set of
graphical) similar data points. These may support, or conflict
with, their existing PfP narrative, and in the latter
3. “Most important pay measures” table: three case, companies should anticipate questions from
to seven most important financial performance investors and others about the disparate data.
measures linking actual compensation to Going forward, companies likely will seek
company performance to harmonize the new data into one integrated
So, as we discuss “design,” the rule calls for primarily PfP story.
tabular disclosure, which can be supplemented • Similarly, companies with formulaic short- and/
narratively and/or graphically. or long-term incentive plans (i.e., using pre-
Companies first have choices to make, including set and pre-disclosed performance metrics
about which peer group(s) to use, and which are their and weightings), should carefully consider
“most important pay measures,” before compiling including some of these among their “most
the data and completing the tables. important financial performance measures,”
Finally, with the rule released in late August 2022 or expect questioning about why they did not.
and required in spring 2023 proxies, companies Companies utilizing non-financial and ESG-
have limited time to digest the new rules, make their related performance measures also may consider
decisions and compile the required information. This including these in this disclosure.
may limit the degree of supplemental and contextual • Investors and proxy advisors, for the most part,
information companies provide in year one of the have not yet updated their Say on Pay and other
new rule. voting policies to factor in the new disclosures, soBEYOND THE NUMBERS 7
this new data may have limited impact on voting this reason, it’s important to review them all to
in 2023. That said, once investors have a year of ensure they consistently reflect the most current
viewing these disclosures, by year two, they likely branding and messaging. Regulators and investors
will sharpen how they will integrate the data into are watching carefully for inconsistent or
their analysis and voting. Ongoing engagement conflicting messaging.
with top investors during this policy evaluation Investors also have available to them non-company
process is advisable. provided resources, including:
• The new tables will be the first portion of proxies • Analyst research reports
requiring Inline XBRL data tagging (which DFIN
is prepared to provide for our clients). By its • Proxy advisor reports and vote recommendations
nature, this new, “tagged” data will permit ready • ESG rater and ranker reports
analysis by third parties, which could include Given the above, with respect to proxy season,
activists, class-action law firms and others. major issues we have been focusing on with our
Some companies will find themselves “positive clients include:
outliers,” and others “negative outliers," and the
latter may find themselves targeted for potential • A company publishes their inaugural sustainability
activism, with the “PvP misalignment” being report, which is much more highly designed
another messaging point for the activist. than their existing documents. In some cases,
these may appear to have come from different
Equilar: What are some concepts of proxy design companies. This is driving an effort to harmonize
that companies may often overlook but are essential the branding (as well as the messaging) between
for effective proxy design? How do companies these core documents, not to make them look
avoid any communication gaps to investors within identical, but to all properly represent the
the proxy? company’s current branding.
Schneider: Companies provide investors with a • Investors are intensely interested in ESG and
range of documents and information channels. While expect to learn the “full story” at the company’s
each has its own purpose and intended audience, website, including in formal reports aligned
over time, there has been some “mission creep” with widely adopted materiality and reporting
among them, including what topics are discussed standards (GRI, SASB, TCFD). Many investors
through which channels. These include: indicate they also want to see “highlights” of the
• Investor relations website program in the proxy, at least the major tenets
• Investor presentation or pillars of the program, and perhaps progress
toward disclosed goals. Clearly, you want the
• Annual report/10-k proxy, and ESG report disclosures, to reflect
• Proxy statement the same top-level tenets and pillars. Investors
• ESG or sustainability report also want to learn about board oversight of
ESG. If you indicate “the full board” or “the
• Direct engagement with investors nominating and governance committee” has
While all the above come from the company, oversight responsibility, expect investors to turn
they may have different authors or drafting teams to the board bios, and to skills matrices, to better
and been created at different points in time. For understand if and how the responsible directors8
have necessary competencies in these areas. proxy. These investors may not be as aware
So, these board disclosures need to be of your latest strategies or be as tuned into
harmonized as well. your ongoing IR communications as are more
• With the increasing ownership by long- “active” managers, yet they do want to vote
term indexed or “passive” (from a portfolio thoughtfully. During proxy season, they may
construction perspective) investors such as not have the bandwidth to review all your IR and
BlackRock, Vanguard, State Street Global other disclosures prior to voting, which is why we
Advisors and others (which collectively own urge our clients to make investors’ jobs easier by
over 20% of Corporate America and can own leveraging IR and repurposing some high-level
a greater percentage of particular companies), company overview information into the proxy
it is advisable to incorporate some “IR 101” or
“company and strategy overview” into your
Read More From
The Essentials of Proxy Design
on page 20 of this report.KEY FIGURES & DATA POINTS 9
Figure 01 Equilar 100 Companies Including
a Proxy Summary
100
Percentage of Companies
80
79.4% 80.4%
76.8% 76.0%
73.7%
60
40
20
0
2017 2018 2019 2020 2021
Data Points
1. The percentage of Equilar 100 companies including a proxy summary in their filings reached a study
peak of 80.4% in 2021, up nearly five percentage points from 2019 (Fig. 1)
2. The prevalence of proxy summaries in Equilar 100 proxies rose by 9.1% overall during the study
period (Fig. 1)10
Figure 02 Equilar 100 Companies Including
a CD&A Table of Contents
50
45.4%
Percentage of Companies
40
36.8% 37.1%
33.7% 35.4%
30
20
10
0
2017 2018 2019 2020 2021
Data Points
1. The percentage of Equilar 100 companies including a table of contents within the CD&A
section of their proxy grew by 22.4% between 2020 and 2021, from 37.1% to 45.4% (Fig. 2)
2. Through the course of the study, the prevalence of tables of contents in Equilar 100 CD&As
fluctuated and increased overall by 34.7% since 2017 (Fig. 2)KEY FIGURES & DATA POINTS 11
Figure 03 Equilar 100 Companies Including
a Compensation Program Checklist
100
84.5%
Percentage of Companies
80 82.5%
78.1%
74.7% 74.7%
60
40
20
0
2017 2018 2019 2020 2021
Data Points
1. 84.5% of Equilar 100 companies included a compensation program checklist in 2021 proxy filings,
up from 74.7% in 2017 (Fig. 3)
2. The prevalence of compensation checklists increased by 2.4% between 2020 and 2021, and 13.1%
overall during the study period (Fig. 3)12
Figure 04 Equilar 100 Companies Including
a Supplemental Graph
100
90.6% 92.8%
89.7%
86.3% 86.3%
Percentage of Companies
80
60
40
20
0
2017 2018 2019 2020 2021
Data Points
1. The practice of including a supplemental graph in compensation disclosures is nearly ubiquitous
among Equilar 100 companies, with 92.8% prevalence in 2021, up from 89.7% in 2020 (Fig. 4)
2. Supplemental graphs have grown in prevalence by 7.5% since 2017, the first year studied (Fig. 4)KEY FIGURES & DATA POINTS 13
Figure 05 Equilar 100 Companies Including
a Pay for Performance Graph
20
18.2%
Percentage of Companies
15
15.2%
12.0%
10
9.0%
8.0%
5
0
2017 2018 2019 2020 2021
Data Points
1. In contrast with the growing prevalence of supplemental graphs in general, pay for performance
graphs have become less common over the last five years, with just 9% of Equilar 100 companies
including one in 2021 proxies, down from 18.2% in 2017 (Fig. 5)
2. Prevalence of pay for performance graphs fell in each year from 2017 to 2020, before jumping one
percentage point in 2021—a trend likely to continue in the wake of SEC Pay Versus Performance
rules finalized in 2022 (Fig. 5)14
Disclosure Example The Goldman Sachs Group, Inc.
The prevalence of Equilar 100 companies that disclosed a pay for performance graph dwindled to just
9% by 2021. However, following the SEC’s August 2022 approval of new Pay Versus Performance rules,
attention around executive pay alignment has accelerated in recent months. The Goldman Sachs Group’s
disclosure offers detailed information on its pay for performance alignment in the context of CEO pay and
annual ROE of its peers.
COMPENSATION MATTERS—COMPENSATION DISCUSSION AND ANALYSIS
2021 ANNUAL COMPENSATION
d Each of our NEOs also focused on the continued implementation of an operating approach that delivers One
Goldman Sachs to our clients, is underscored by a multi-year financial-planning process, invests in new and
existing businesses and enhances accountability and transparency.
The Committee continues to focus on ensuring that the structure and amount of our NEO compensation
appropriately incentivizes our NEOs to continue to build long-term, sustainable growth and to achieve our financial
targets, without undue emphasis on shorter-term results.
d For example, each of our NEOs receives at least 60% of his or her variable compensation in equity-based
awards that promotes alignment with long-term shareholder interests.
d Further, equity-based awards for our Management Committee, including for our continuing NEOs, are in the
form of PSUs, resulting in a significant portion of compensation for our most senior leaders being subject to
ongoing performance metrics.
Spotlight on 2021 U.S. Peer CEO Compensation
d Peer comparability is an important factor in assessing our pay-for-performance alignment.
d The chart below provides additional information on our pay-for-performance alignment in the context of
available 2021 annual CEO pay determinations and annual ROE for our U.S. Peers.
$40.0 35.0%
$35.0 $34.5 $35.0
$35.0 $32.0 30.0%
$30.0
$24.5 25.0%
$25.0 $22.5
23.0% 20.0%
$20.0
18.6% $15.2
15.0%
$15.0 15.0%
12.2% 12.0% 11.5% 10.0%
$10.0
8.9%
$5.0 5.0%
$0.0 0.0%
GS JPM MS BAC WFC C BK
2021 ROE 2021 CEO Annual Compensation(a)
(a) Annual compensation includes base salary, cash bonus paid and deferred cash/equity-based awards granted, in each case for 2021 performance,
as reported in SEC filings.
Filed 3/18/2022KEY FIGURES & DATA POINTS 15
Figure 06 Equilar 100 Companies Including
an Alternative Pay Graph or Table
50
Percentage of Companies
40
40.2%
35.4% 36.1%
33.7%
30 31.6%
20
10
0
2017 2018 2019 2020 2021
Data Points
1. 36.1% of Equilar 100 companies included a graph or table detailing an alternative pay calculation in
proxy statements in 2021, down from a study peak of 40.2% in 2020 (Fig. 6)
2. Alternative pay graphs and tables have wavered in prevalence during the period, increasing
modestly from 33.7% to 36.1% between 2017 and 2021 (Fig. 6)
3. The average year-over-year growth in prevalence during the study period was 2.3% (Fig. 6)16
Figure 07 Equilar 100 ESG Disclosures
100
63.9%
47.4%
Percentage of Companies
80
60
32.3%
40
18.9%
38.1%
33.0%
27.1%
20 22.1%
6.3%
12.6%
0
2017 2018 2019 2020 2021
Mention
Disclose Disclose
Mention
Data Points
1. Detailed disclosures of ESG practices have become a majority practice in the Equilar 100 over the
past five years, growing from 6.3% prevalence in 2017 to 63.9% prevalence in 2021 (Fig. 7)
2. An additional 33% of Equilar 100 companies mentioned ESG practices in disclosures but did not
include detailed information about practices (Fig. 7)
3. In total, the percentage of Equilar 100 disclosures addressing ESG practices has ballooned from
18.9% in 2017 to 96.9% in 2021 (Fig. 7)2022 Proxy Statement Summary
KEY FIGURES & DATA POINTS 17
ENVIRONMENTAL, SOCIAL AND GOVERNANCE (ESG) HIGHLIGHTS
Disclosure Example
ESG issues represent risks, AT&T Inc.
opportunities and important external impacts we consider in our strategy and
operations. Our approach to ESG is integrated into our business through Board of Directors oversight, officer-
level leadership
Heading ofESG
into 2023, ESG will
initiatives across continue
undoubtedly relevant departments
to be a pointand collaboration
of focus amongand
for investors dedicated teams of
key stakeholders.
corporate responsibility professionals and subject-matter experts throughout the Company. Pages 32-37 detail
In 2021,
how ourtheintegrated
overwhelming majority of
ESG approach Equilarlong-term
delivers 100 discussed their
value for ESGand
AT&T practices tosocial
positive some and
extent in the
environmental
proxy. In this example, AT&T
impact for our stakeholders. concisely explains the impacts the Company has made with respect to ESG,
specifically those environmental and social issues, supported by key data points.
A sample of independent assessment organizations recognizing our ESG approach and performance is listed on
inside back cover.
SELECT HIGHLIGHTS OF ESG INTEGRATION AND IMPACT:
ESG INTEGRATION ACROSS AT&T OPERATIONS
Focus on material • In 2021, we conducted our 6th stakeholder assessment to identify and prioritize our
ESG issues most material ESG issues and how we should focus our resources, goals and
(pages 32, 34) reporting.
• We integrate our most material ESG issues into corporate enterprise risk assessment
activities.
Political engagement • In 2021, our leadership in political engagement transparency was again recognized via
transparency independent third-party analysis.
(page 35)
ENVIRONMENTAL IMPACT
Net zero emissions • Through FY2020, we progressed more than halfway toward our science-based target
by 2035 to reduce Scope 1 and 2 emissions 63% by 2030 (2015 base year).
(page 36) • In 2022 we announced 2 solar energy deals, increasing our commitments to more than
1.7 gigawatts of renewable energy capacity – helping make AT&T the 7th largest
corporate renewable energy user in the U.S., according to the EPA.
Supplier and • Through FY2021, we reached 94% of our science-based target to ensure half our
customer emissions spend is with suppliers that have, or have committed to, set their own science-based
reductions targets by 2024.
(pages 35-36) • In 2021, we launched the AT&T Gigaton Goal to equip business customers with
connectivity solutions that cumulatively save a gigaton of GHG emissions by 2035.
SOCIAL IMPACT
$2B commitment • In 2021, we introduced AT&T Connected LearningSM and have set a 2025 goal to reach
to address the 1 million people in need through the program.
digital divide • Through the end of 2022, we will launch more than 20 AT&T Connected Learning
(page 37) Centers(SM) in traditionally underserved neighborhoods facing barriers to connectivity.
A diverse, equitable • In 2021, more than 55% of open positions and 53% of promotions were filled by
and inclusive diverse candidates.
workforce • We enhanced the transparency of our workforce diversity by publicly releasing AT&T
(page 36) and WarnerMedia Federal EEO-1 data.
Filed 3/22/2022
AT&T INC. SUM 4 2022 PROXY18
Figure 08 Equilar 100 Board Diversity Disclosures
100
99.0%
92.8%
Percentage of Companies
80
81.3%
69.5%
60
55.8%
40
20
0
2017 2018 2019 2020 2021
Data Points
1. 99% of Equilar 100 companies included board diversity disclosures in 2021 proxies, up from 92.8%
in 2020 and just 55.8% in 2017 (Fig. 7)
2. The largest increase observed in the period was between 2017 and 2018, when the prevalence of
board diversity disclosures jumped by 24.6%, from 55.8% to 69.5% (Fig. 7)KEY FIGURES & DATA POINTS 19
Disclosure Example General Motors Company
Among the many issues that come under the ESG umbrella, diversity remains a hot-button topic. The
prevalence of Equilar 100 companies that disclose their board composition has accelerated over the last
few years, primarily as a result of new rules, legislation and pressure from stakeholders. General Motors’
disclosure on board diversity visually captures a breakdown of its statistics by gender, race and ethnicity,
tenure, age, and more.
2022 Board Nominee Statistics
GENDER RACE AND ETHNICITY RANGE OF TENURE
NO. 1
ITEM
>10 Yrs 0-5 Yrs
3
4
6 50%
Women
6 33%
Racially / Ethnically
6
Average
6
Diverse Years
8
3
Women Men >5-10 Yrs
BOARD COMMITTEES SIGNIFICANT BOARD
CHAIRED BY WOMEN REFRESHMENT AGE DISTRIBUTION
67
of Committees
%
4
New Directors
63
Average Age of
Chaired by Women Over Past 3 Years Director Nominees
4 out of 6 Range: 52 – 71
Filed 4/29/202220 A Deep Dive The Essentials of Proxy Design Equilar: After hovering close to 35% from 2017- while others use a more conversational “road-map” 2020, the percentage of Equilar 100 companies that to the topics that will be discussed in this section. disclosed a CD&A table of contents jumped to 45.4% Equilar: While the new Pay Versus Performance in 2021. What do you believe is driving this trend? disclosures will certainly be a significant portion of Schneider: While ESG is the “new kid on the block” the proxy this coming year, the prevalence of pay in terms of capturing investor focus, investors remain for performance disclosures decreased by more highly focused on executive compensation and than 50% from 2017 to 2021. Why has this form of how it is aligned with the business strategy. This is disclosure decreased so significantly in recent years? disclosed primarily in the CD&A section of the proxy, How much of the SEC’s new rules will accelerate the and the summary compensation table and other attention around pay for performance in general? tables typically following the CD&A. Schneider: One reason for a decrease in company- Since its requirement by the SEC in 2006, CD&As crafted “pay for performance (PfP) alignment” have generally been growing in length and graphs and similar disclosures may be the increased complexity, with many having their own “executive market volatility of recent years. Initially COVID- summary” at the start of the section. This greater related, followed by geopolitical disruptions and length isn’t necessarily a bad thing—while it does most recently driven by inflation, Fed responses reflect the complexities of many plans and of the pay and concerns about recession, resultant stock price setting process itself—much of the greater length volatility makes it harder for companies to determine is useful, contextual disclosure, including the all- with confidence what their pay for performance important “why” of key pay decisions and vehicles. results will be or for how long those trends will last. Institutional investors report treating the proxy This may be contributing to a greater reluctance more as a “reference” than a “reading” document, about committing to a particular narrative and jumping around to one section or another depending supporting data and graphs. upon their area(s) of interest. Given the greater A renewed focus on “long-termism” may also be length and complexity of these sections (and of impacting this trend. With the ascendancy and proxies generally), and the fact that proxies are greater ownership of long-term, even “permanent” not standardized in terms of location or sequence indexed investors (such as BlackRock, Vanguard, of information, efficient navigation is key. Most State Street Global Advisors and others), as well companies include a detailed table of contents (TOC) as the focus on ESG risks and opportunities and at the front of the document. With the CD&A almost how those should be integrated into business being its own “document within a document,” strategy, and increasing adoption of ESG-related locating supplemental navigation to its contents compensation metrics, companies may be at the start of this section makes sense. Some feeling less pressure to advocate for their pay for companies insert a supplemental CD&A TOC, performance alignment on an annual basis.
A DEEP DIVE                                                                                                   21

Equilar: The prevalence of disclosures related to         Schneider: Use of company brand elements and
ESG and board diversity have increased substantially      color palette, photography and visual elements such
over the last five years. What are some strategies to     as graphs, callouts, shading, timelines, process flow
communicate corporate practices related to these          diagrams, and other features can make the document
issues to shareholders?                                   more inviting to a range of readers than page after
Schneider: With respect to ESG and human capital          page of dense text, while helping to highlight key
practices, investors look for this disclosure primarily   messages in an impactful and digestible manner. That
at the company website, whether in information            said, there is such a thing as “overdesign.” In cases
or formal reports. With respect to the proxy, as          where seemingly every page features one or more of
stated earlier, investors do want to see the program      these visual elements, investors have commented “if
highlights, or “pillars and tenets,” summarized in the    you highlight everything, how are we supposed to
proxy, as well as discussion of board oversight of this   know what’s really important?” The good news is that
emerging set of risks and opportunities.                  these visual elements should be used judiciously
                                                          yet consistently.
We are increasingly seeing these topics mentioned in
contextual CEO and/or board cover letters, setting        More good news is that “tried and true” devices
a “tone from the top” that these are important            like bar, line, pie and doughnut graphs are desirable
focuses of the company. With respect to board             since investors are used to seeing these, and they
diversity, Nasdaq companies have for over a year          are easy to interpret, as opposed to something that
been including their prescriptive board diversity data    may be considered more creative and innovative, but
in proxies. That aside, investors have been interested    “takes work” to figure out or worse, may be subject
in this for years, so we continue to see more board       to misinterpretation. For this reason, we follow a
diversity graphics (some companies extending this to      mantra of “design with a purpose” (and not simply
senior management and overall workforce diversity)        for the sake of design).
and board skills matrices, which increasingly are         As described earlier, with ESG and sustainability
highlighting relevant ESG and related competencies        reports often racing ahead of other company
on the board.                                             documents in terms of visuality and design, it’s
Director nominee photos, board committee photos           important to review key messages and channels (the
and NEO photos at the start of the CD&A are               IR site, investor presentation, 10-K/annual report,
increasingly prevalent. With a return to travel and       sustainability report and the proxy) side by side and
in-person meetings, we are seeing more companies          seek to harmonize (but not necessarily duplicate)
include group photos (of the board, committee             their use of the company brand and visual elements.
members, NEO’s, etc.). While photos don’t tell the        Regarding the use of color, increasingly we are being
full diversity story, they can help to dramatize          asked to design, SEC file and webhost a digital
the presence (or lack) of diversity within the            version of the proxy in full color, with the option of
relevant population.                                      “dialing back” the use of color in the printed version
Equilar: What are some challenges related to proxy        for cost purposes. Digital versions can also feature
design that companies should consider? How critical       more interactivity, enhanced navigation, links to
is the visual element of proxy design to success?         company or director videos and other features.
22 Photography, including director, executive and even Investor engagement (whether initiated by you or workforce images can help to humanize company your investors) can help to identify their evolving leadership, and to highlight aspects of diversity. areas of interest and informational needs, thereby Companies increasingly are using timelines to focus guiding your disclosure evolution. readers on longer term progress on major initiatives, For these reasons, review your peer company beyond just changes from the prior year. This disclosures at least every other year, as well as those can include company history, strategy and of the “governance leader” companies. DFIN’s Guide performance, board evolution, responsiveness to to Effective Proxies, now in its 10th anniversary investor engagement, and ESG and related U.S. edition and 5th anniversary Canadian reporting progress. edition, is designed to make this “best practices” Equilar: Any closing thoughts or parting wisdom? benchmarking process efficient. Schneider: Remember that many of your investors Review your various disclosure documents and also own your peers, so you are constantly evaluated channels side by side to ensure harmonization of relative to peers and their level of disclosure and branding and key messages. quality of presentation. These peers may be “upping their game” from year to year, so “standing still” may not be an option.
ABOUT THE CONTRIBUTOR                                                                                          23

About the Contributor
Donnelley Financial Solutions (DFIN) is a leading global risk and compliance solutions company. We provide
domain expertise, enterprise software and data analytics for every stage of our clients’ business and
investment lifecycles. Markets fluctuate, regulations evolve, technology advances, and through it all, DFIN
delivers confidence with the right solutions in moments that matter.
Learn about DFIN’s end-to-end risk and compliance solutions online at DFINsolutions.com or you can also
follow us on Twitter @DFINSolutions or on LinkedIn.
Additional proxy disclosure examples, similar to those found in this publication, can be found in DFIN’s Guide
to Effective Proxies, 10th edition: www.proxydocs.com/xDFINx

             Ron Schneider
             Director of Corporate Governance Services
             Donnelley Financial Solutions (DFIN)

Ron joined DFIN as Director of Corporate Governance Services in April 2013. He is responsible for providing
thought leadership on emerging corporate governance, proxy and disclosure issues.
Over the past four decades, Ron has advised senior management, the C-suite and boards of public
companies of all sizes, industries and stages of growth facing investor activism, as well as challenging and
sensitive proxy solicitations involving corporate governance, compensation and control issues.
His primary recent focus has been helping companies conduct engagement programs with their top
institutional investors with the objective of identifying and addressing investor concerns through best
practices in proxy disclosure.
At DFIN, Ron works closely with clients and our firm’s sales and service teams to identify and implement
appropriate changes to proxy statement design, content and navigation that fit each client’s unique
corporate culture and proxy-related objectives.
During his career he has managed more than 1,600 proxy solicitations, 200 tender or exchange offers and 30
proxy contests, with his proxy fight clients succeeding in over 70% of such situations.
Ron earned a B.A. in Economics from Princeton University.
24
Prepare for New SEC Pay
Versus Performance Rules
Craft your pay alignment disclosure with
new models for pay and metric analysis
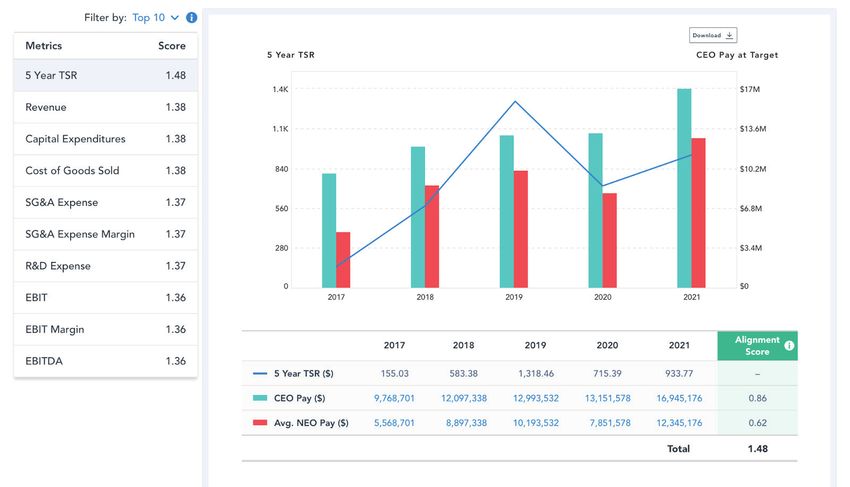
P4P™ Absolute Alignment
Learn more at www.equilar.com/P4P1100 Marshall Street, Redwood City, CA 94063
121 W Wacker Drive, Suite #1805, Chicago, IL 60606
1120 Avenue of the Americas, Suite #4045, New York, NY 10036
Phone: (650) 241-6600 | Fax: (650) 701-0993 | E-mail: info@equilar.com
www.equilar.comYou can also read