PREDICTION OF COVID CASES BY APPLYING CNN ALGORITHM ANALYZING COVID-19 DATA
←
→
Page content transcription
If your browser does not render page correctly, please read the page content below

© 2022 JETIR February 2022, Volume 9, Issue 2                                   www.jetir.org (ISSN-2349-5162)

PREDICTION OF COVID CASES BY APPLYING
  CNN ALGORITHM ANALYZING COVID-19
                DATA
  Dr. M. Dhanalakshmi. Professor Of Information Technology Department, Jawaharlal Nehru Technology University
                Hyderabad College Of Engineering, Nachupally (Kondagattu), Jagityal Dist-505501.

     Damalla. Mamatha Rani. Pg Scholar, Department Of Information Technology, Jawaharlal Nehru Technology
           University Hyderabad Collage Of Engineering, Nachupally (Kondaguttu), Jagityal,Dist-505501.

Abstract - The Corona virus (COVID-19) is                  1. INTRODUCTION
creating panic all over the world fast growing cases.
There are various datasets available which provide         1.1 Introduction
information of world-wide affected information.                The new corona virus first occurred in the
                                                           Chinese’s city of Wuhan in Two thousand and
        Covid-19 has affected all counties with a          nineteen and was reported to the World Health
large number of cases with variation of numbers            Organization (W.H.O) IN December 31, 2019.
under death, survived, effected. In this project we        W.H.O. called the virus COVID-19 ON February
are using a New York data set which has country            11, 2020, after it established a global danger.
wise details of cases with various combined                Depending on respiratory syndrome, a COVID-
features and labels. Covid-19 data analysis and case       19infected individual; will develop symptoms
prediction project provide solutions for data              between 2-14 days (SARS). Dry cough, exhaustion,
analysis of various countries at various time and          and fever are indications and symptoms of mild to
data factors and creating models for survival and          moderate instances, according to the World Health
death cases and prediction cases in future.                Organization, while shortness of breath, fever and
                                                           tiredness are signs and symptoms of severe cases.
       Machine learning provides deep learning             People who have other illnesses such as asthma,
methods like Convolution neural networks which             diabetes, or heart disease, are more susceptible to
are used for model creation and prediction for next        the virus and may become seriously ill as a result.
few days are done using this project.                      The person’s symptoms and travel history are used
                                                           to get a diagnosis. The vital signs of the client who
                                                           is experiencing symptoms are being closely
                                                           monitored. Regularly wash hands with soap for 30
                                                           seconds and abiding close contact with people by
  JETIR2202090     Journal of Emerging Technologies and Innovative Research (JETIR) www.jetir.org      a735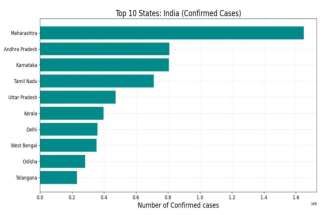
© 2022 JETIR February 2022, Volume 9, Issue 2                                   www.jetir.org (ISSN-2349-5162)

keeping a distance of approximately 1m may lower           1.2 Problem Statement
the risk of infection. Covering the mouth and nose
                                                               A large number of individuals were affected.
with disposable tissue during sneezing and avoiding
                                                           The domestic outbreak is currently under control,
contact with the nose, ear, and mouth can help
                                                           but the new corona virus is fast spreading in other
prevent it. SARS is an airborne disease that first
                                                           locations. A new pneumonia epidemic was
arose in China in 2003 and has since spread to 26
                                                           proclaimed a “global pandemic” by the World
countries, with million cases reported in the same
                                                           Health Organization (WHO) on March 11.
year and spread from person to person. ARDS
(acute respiratory distress syndrome) is defined by        With the rising number of COVID-19 cases
the quick development of inflammation in the lungs         throughout the world, daily forecasts and analyses
that leads to respiratory failure, with blue skin          are needed to keep the pandemic under control.
colour, exhaustion, and shortness of diagnosing
diseases using picture and textual data.                   1.3 Objective

    For the detection of new corona viruses,                       Data pre-processing and data analysis are
machine learning can be applied. It may also predict       done on the dataset, and a machine-learning model
the virus’s characteristics to identify or forecast        is constructed for future case prediction using data
illnesses. For categorizing text or images into            from Kaggle and NEW YORK dataset.
distinct categories, supervised machine learning           2. LITERATURE SURVEY
algorithms require annotated data. Over the last
decade, significant progress has been achieved in          2.1 Used Methods
this sector in order to complete certain key projects.
                                                           ●       Two thousand and nineteen Pneumonia in
Data in the form of X-ray pictures was supplied by
                                                           Wuhan, China: Risk Factors Associated with
John Hopkins University, and multiple researchers
                                                           (ARDS) Deaths in Patients with Corona virus
developed a machine learning model that identifies
                                                           Disease A machine learning algorithm that can
X-ray images as CPVID-19 or not.
                                                           predict if a person has COVID-19 and is at risk of
Using Methods and Algorithms:                              developing acute respiratory distress syndrome
                                                           (ARDS). The proposed model was shown to be
    Convolutional neural networks (CNN) are a
                                                           80% percent accurate.
form of artificial neural network used in computer
                                                           ●       The findings of diabetes diagnosis using
vision. CNN was used to decrease the size of
                                                           machine learning and ensemble learning approaches
pictures using convolution; and pooling layers
                                                           showed that the ensemble methodology ensured
before sending the reduced input to fully connected
                                                           98.60% percent accuracy. These functions may be
layers.
                                                           useful in diagnosing and predicting COVID-19.
    The information consists of clinical records in        ●       By providing an accurate diagnosis,
the form of written reports, which we categorize           machine learning and deep learning can replace
into four illness categories: confirmed cases, deaths      people. X-rays and computed tomography (CT)
cases, recovered cases, and active cases. It can aid       scans may be used to train the machine learning
in the prediction of corona virus based on previous        model, which can save radiologists' time and be
clinical findings. On COVID to COVID-19 Next 10            more cost-effective than traditional testing for
Day Prediction World Wide Cases, we employed               COVID-19.
supervised machine learning approaches to give             ●       COVID-Net, a deep convolutional neural
deep learning in CNN model for classifying the text        network that can diagnose COVID-19 from chest
into four separate categories.                             radiography pictures, was developed. When
                                                           COVID-19 is found in a person, he or she is
                                                           considered to have COVID-19.

  JETIR2202090      Journal of Emerging Technologies and Innovative Research (JETIR) www.jetir.org     a736
© 2022 JETIR February 2022, Volume 9, Issue 2 www.jetir.org (ISSN-2349-5162)
Using data from (only) 29 patients at
2.2 Existing System Tongli Hospital in Wuhan, China, Yan et al. [13]
developed a prognostic prediction algorithm to
forecast the mortality risk of a person who has been
For pattern detection, explanation, infected.
and prediction, big data-based models are used in Jiang et al. [14] created a machine
machine learning and natural language processing. learning model that can predict whether or not a
In recent years, NLP has attracted a lot of attention. person is infected with COVID-19 and acute
Classification is one of the most important jobs in respiratory distress syndrome (ARDS).
test mining, and it may be accomplished using a
variety of the methods [6]. For mining unstructured The suggested model achieved an
data, Kumar et al conducted a SWOT analysis of accuracy of 80%. A total of patients was utilized to
several supervised and unstructured text train their model, and they were only allowed to use
classification systems.
samples from two Chinese hospitals. ML can be
Sentiment analysis, fraud detection, used to diagnose COVID-19, a virus that requires a
and spam detection are some of the uses of text lot of study but is not yet extensively utilized. We
categorization. Opinion mining is mostly utilized in employed machine learning and ensemble learning
elections, advertising, and business.
models to categorize the clinical reports into four
Sarwar et al. [10] used machine types of viruses because there is less work being
learning and ensemble learning approaches to done on diagnosis and prediction using language.
diagnose diabetes. The results showed that the
ensemble methodology had 98.60% percent
2.3 Drawbacks
accuracy rate. The functions may be useful in
diagnosing and predicting COVID-19. From the ● Using a machine learning model that can
COVID-19 we can save millions of lives and predict whether or not a person is impacted by
generate a massive amount of data on which Covid-19. However, they label data, which is
machine learning (ML) models can be trained if it is constant data, and they can simply forecast the data
diagnosed correctly. Machine learning might in this because it is in numerical format.
sense, especially when establishing diagnosis based ● In diabetic patients who are easily infected
on clinical writing, radiographic images, and other
with COVID-19, machine learning can be used to
data.
diagnose diabetes. As a result, they solely forecast
Machine learning and learning, diabetes patients.
according to Bullock et al. [11], can replace people ● COVID-19 pictures, like X-rays and CT
by providing correct diagnosis. A precise diagnosis
scans, can only determine whether or not a person is
can save radiologists time and money when
compared to routine COVID-19 testing. The infected with corona virus
machine learning model may be trained using X-
rays and computed tomography (CT) data. In the
regard, a number of initiatives are in the works.
COVID-Net, a deep convolutional
neural network built by Wang Wong [12], can
diagnose COVID-19 from chest radiography
pictures. When COVID-19 is found in a person, the
question is whether or not that individual will be
impacted, and if so, how severely. Not all COVID-
19-positive individuals will require close
monitoring. Knowing who would be affected more
severely can aid in directing assistance and
planning the allocation and usage of medical
resources.
JETIR2202090 Journal of Emerging Technologies and Innovative Research (JETIR) www.jetir.org a737© 2022 JETIR February 2022, Volume 9, Issue 2 www.jetir.org (ISSN-2349-5162)
3. PROPOSED SYSTEM the input layer corresponding to reducing the
number of parameters significantly when
compared to a fully connected neural network.
In The most common CNN architectures,
pooling layers alternate with convolutional
layers to decrease the spatial dimension of the
feature maps in preparation for the succeeding
computational stages, decreasing computing
cost and minimizing overfitting.
Fully connected layers combine the
Fig 3: generated feature maps and produce a
classification measure at the network’s
Pre-processing methods conclusion after an arbitrary number of
previous levels.
A CNN model prediction is incorporated in
our model to capture a common knowledge of
viral transmission pathways, including COVID-19.
Furthermore, the anticipated indices may be
derived as model features from them. The goal of
event trends detection is to compensate for the
CNN model’s shortcomings and forecast the
outcomes for the following 10 days. Fig 3.1: CNN Architecture
Advantages of Proposed System
COVID-19-related event patterns are 3.1.2 Function Model:
being detected and shown in a new way.
The following is the quick summary of each
By merging an epidemic dynamic layer: Input layer: Receive input of COVID-
model with top event trends, graph statistics from 19confirmed cases. The first Cov1D layer scans
the study’s findings are used to forecast the number over the input sequence, acquiring new information
of confirmed cases and fatalities.
and dealing with noise in the data before projection
Finally, the suggested prediction the results onto feature maps.
method has been demonstrated to be useful; in real-
world practice by determining the best day to return The second Conv1D layer repeats the
to work. procedure on the feature maps created by the first,
attempting to improve any notable features. To read
3.1 CLASSIFICATION the input sequences, we used 64 feature maps per
convolutional layer and a kernel size of three-time
3.1.1 Working with CNN:
steps. The max pooling layer streamlines the
Deep Learning Models in CNN was the
process by deleting particular values from the
first to employ convolutional networks for zip
convolved features. The feature maps and creates a
code recognition in their present form.
smaller-dimensional matrix.
Convolutional, pooling, fully connected layers
are the most common layers on CNNs. In the Dropout layer: The dropout layer was
convolutional layers, a set of feature maps, introduced to the network to prevent the model
also known as activation maps, is created. from overfitting. The random subsampling of a
Each neuron in the feature map is connected to layer’s outputs under dropout has the effect of
JETIR2202090 Journal of Emerging Technologies and Innovative Research (JETIR) www.jetir.org a738© 2022 JETIR February 2022, Volume 9, Issue 2 www.jetir.org (ISSN-2349-5162)
reducing the network’s capacity of thinning it persons who are constantly alive, the
during training. characteristics describing the overall number of
deaths and cases are relevant to prognosis. The
Flatten layer: The distilled feature maps are next step was feature scaling, which included
flattened into a single long vector that may be used normalizing the range of independent variables
as input to the decoding process after the dropout or data characteristics such that each one
layer. contributes roughly and proportionally to the
algorithm.
The fourth task of the pre-processing
3.2 PRE-PROCESSING DATA: process is to adapt our model to learn from
previous time-steps, with total confirmed cases
The data was then analysed in a Jupyter
as features and total log of 10 exponential count
notebook using a python project that used the
as label, and these values used to fit the
libraries Pandas, NumPy, SciPy, and Matplotlib.
algorithm and train the model.
We filtered data from Morocco first, then chose the
The model takes prior days as inputs and
characteristics ‘total cases,’ ‘population,’ ‘total
returns future forecasts.
deaths,’ and ‘new deaths.’ We kept the final one.
3.2.1 What we are using in data:
Because it is the objective of our
The WHO COVID-19 dashboard the data
forecasts, we have chosen to highlight ‘new
for this analysis. It contains information on corona
cases.’ Because contamination might occur
virus cases in each specific country, such as the
from sick persons who are constantly alive, the
number of confirmed, dead, cumulative confirmed,
characteristics describing the overall number of
and cumulative deaths (defined by the of the
deaths and cases are relevant to prognosis.
country, country code, and WHO region) every day
The next step was feature scaling,
from the start of the COVID-19 infections
which included normalizing the range of
(4/1/2020) to the end of the COVID-19 infections
independent variables or data characteristics so
(24/9/2020). At the time of this research, the dataset
that each feature contributes roughly and
contained 62,510 records for 216 different nations
proportionally to the ML algorithm. The Min-
and 265 days, totalling 31,798,308 new cases and
Max scaler, which converts all values between 0
973,653 deaths cases. The regional distribution of
and 1, was then applied.
cases accumulated three distinct timestamps is
The fourth job of the pre-processing
depicted. COVID-19 confirmed and mortality cases
procedure is to change our model to learn from
are presented globally.
previous time-steps in order to forecast positive
COVID-19 cases for the next 10 time-steps, 3.2.2 Data collection:
where the dataset is split into 80% and training
and 20% testing. Two days are used as inputs, The World Health Organization has
and the model predicts ten days as outputs designated the Corona virus pandemic a public
The data was then analysed in a health emergency. The data pertaining to this
Jupyter notebook using a Python project that pandemic is freely available from researchers and
used the libraries Pandas, NumPy, SciPy, and hospitals. We gathered information from GitHub,
Matplotlib. We started by filtering data from an open-source data repository. This is the location
India, then choosing the characteristics ‘total where patient data is kept. The data includes the
cases,’ ‘population,’ ‘total deaths,’ and ‘new country’s name, the date, the source URL, the
deaths.’ The last feature, ‘new cases,’ has been source label, the number of observations, the
kept because it is the goal of our forecasts. cumulative total, the cumulative total per thousand,
Because contamination might occur from sick and a description. The data sets supplied by Johns
JETIR2202090 Journal of Emerging Technologies and Innovative Research (JETIR) www.jetir.org a739© 2022 JETIR February 2022, Volume 9, Issue 2 www.jetir.org (ISSN-2349-5162)
Hopkins CSSE1 include worldwide pandemic At the time of this research, the dataset had
figures beginning on January 22nd. Different 62,510 records for 216 different nations and 265
nations and areas are represented in the data sets. days, totaling 973,653 deaths. Cases that have
The data set is divided into three categories: daily accumulated at three separate time stamps are
confirmed cases in each nation or area, daily distributed spatially. COVID-19 instances are
fatalities in each country or region, and daily expected to be widespread all over the world
recovered cases in each country or region.
3.3 FEATURE EXTRACTION
3.2.3What are processing Data:
The dataset we utilized was “New cases”
Preparing time series data, creatine (COVID-19 confirmed cases). We set the date as
predictive models, and implementing the predictive parse dates when opening the csv file to make the
model are the three steps of the suggested research dataset a time series. The loaded dataset was
technique. The time series “New COVID-19 cases” resampled and grouped by day using the resample
was used. There are three phases in the first phase, () function with the argument “D.” A total of 265
“Preparing time series data”: Convert a dataset into data points were divided into 37 weeks of data
a time series, normalize data in a time series, and time-series data from COVID-19 confirmed cases
divide data in a time series. Three phases make up were normalized using min-max normalization
the second phase, “Building the Predictive Model”: within the range [0,1] normalization must be
Optimize the models, train the models, and assess reversed. Various aspects of India, Sri Lanka, New
the models. Models were optimized to obtain the York, and other countries may be found in the pre-
best hyperparameter, models were then trained on a processed reports. We have more than the entire
train set using the best hyperparameter, which count of 400 persons in India (100), Sri Lanka
began on January 4, 2020, when the first instance of (200), and New York (100).
COVID-19 began, and ended on July 17, 2020.
They split the 400 traits of persons into two
The trained models were then put to the test categories, with 80% and 20% picked. Deep
on s test set, which runs from July 18, 2020 to learning in CNN models is achieved by assigning
August 14, 2020. Forecasting was approximated the appropriate weight to the feature and feeding
and compared to real values between July 18, 2020 the same input to machine learning algorithms.
to August 14, 2020. Third step, “Applying the
Predictive Model,” includes COVID-19 data from
August 15, 2020 to September 18, 2020 end. 3.3.1 Extraction
Forecasting was estimated and compared to real
Total confirmed cases are used as features and
values between September 12, 2020 and
total log of 10 exponential count is used as a label,
September18, 2020.
with this data being used to fie the algorithm and
3.2.3 Dataset train the model. The model takes prior days as
inputs and returns future forecasts.
From the data set or data collection, we
first define confirmed cases from all states, 3.4 TRAINING AND TESTING MODEL
countries, or regions, and then we take death cases
from all states, countries, or regions, as well as
recovered cases. We will not be active cases any
more. Calculate the data you will need.
Active cases=confirmed cases-death cases-
recovered cases then we had active case data on
3.4(a) Trainig and Testing models
pre-processing.
JETIR2202090 Journal of Emerging Technologies and Innovative Research (JETIR) www.jetir.org a740© 2022 JETIR February 2022, Volume 9, Issue 2 www.jetir.org (ISSN-2349-5162)
To prepare the time series for model
development, the NumPy split () function was used
to separate 37 weeks of normalized time series data
into training, test, and forecast sets in a sequential
manner. Table 3.2.3 illustrates the outcome of the
splitting method in detail, whereas Figure 3.4.2
depicts it as a graph. The above-mentioned CNN
Algorithm is used for training.
The 18 forecasting models developed in this Fig 3.4(b) Training Data
study were chosen because picking the best and
3.4.2 Testing model:
most accurate forecasting model for anticipating the
COVID-19 pandemic is a difficult procedure. In the test model we are testing the dataset
we’ve gathered to the test. Divide the data into
Models were trained on a train set, which is
confirmed cases, death cases, recovered cases, and
a time series that begins on January 4, 2020 and
active cases in the dataset. And the data may be
ends on July 17, 2020 using the optimal
found at
hyperparameter.
We forecast the model based on the data set
3.4.1 Evaluate the models supplied to the train mode.
The trained models were then put to the test 3.4.3 Validation and Cross validation:
on a test set, which runs from July 18, 2020 to
August 14, 2020. The forecasting horizon is crucial This data does not allow validation or cross
for an intelligent model’s prediction accuracy from validation. The predicted data in our daily scenarios
a forecasting model analysis when predicting the varies from one another since the dataset is in the
next daily verified case is referred to as the format of a textual data collection. As a result,
forecasting horizon. cross-validation isn’t possible.
The train and prediction procedures were 3.5 PREDICTION:
conducted ten times to account for unpredictability. Predictions from the CNN model, as well as
Average forecasting between July 18, 2020 and highlights from recent event patterns. State (City),
August 14, 2020 was computed and compared to Country (Region), and Date are all included in the
the true values. The models’ performance was then original data. The month and day are retrieved and
evaluated using testing data. turned into numeric codes for date. Susceptibility
prediction, confirmed prediction, recovered
In the training model split data set to labels
prediction, and fatality prediction are all features of
of 80% total data for training and 20% of total data
the CNN model. This model is used to provide
on testing. In that we take a deep learning classifier
forecasts for the next 10 days
on using CNN modal.
4. RESULTS
For Example, on feature extraction of data
we take that by training on each training segment of
test and training label are having testing taken 20% Using data from the COVID-19 India page
and training 80% data taken from data set on web on GitHub.com, we predicted the total number of
site. confirmed cases in India. And we’re forecasting
India's top 10 states.
JETIR2202090 Journal of Emerging Technologies and Innovative Research (JETIR) www.jetir.org a741© 2022 JETIR February 2022, Volume 9, Issue 2 www.jetir.org (ISSN-2349-5162)
Graph fig: Graph Fig:
4.3 Covid-19 Next 10-day prediction World Wide
cases
4.1 Number of confirmed cases top 10 states Because many factors influence the spread
of the COVID-19 virus, such as city size, heavy
The graph below depicts confirmed
population density, and total population, different
instances in India. And Maharashtra got afflicted
models for the COVID-19 pandemic period in
with covid-19 in large numbers. Telangana,
different countries and regions should be
meantime, was gradually infected with covid-19.
established, so the data is divided according to each
This graph depicts the CNN model’s country and region for simulation.
training process, after which the model is saved
4.1 Result and Discussion
after being trained with a global dataset of all
nations’ survival and death instances. We started by pre-processing the data set on
Graph fig: a non-relevant data set that isn’t acceptable for
testing and training on a pre-processing model. A
list format in which each element in a single
document is listed. In addition, the papers CC
model the document with similarity score from the
data set or supplied query after pre-processing
many pre-processing approaches.
Treatment of number of confirmed:
The number of confirmed cases in the data
4.2 Number of death cases in top 10 states
pertains to the total number of confirmed instances
The graph below depicts mortality cases in each day, hence it has to be processed. In the event
India. And Maharashtra has a high number of death of an epidemic, after a verified patient dies, his or
cases linked to covid-19 infection. And on Covid- her body will be disposed of swiftly, ensuring that
19, Madhya Pradesh had the fewest infection- the dead patient is no longer contagious to normal
related deaths. people. As a result, the data’s proven case is
handled as follows:
The graph depicts future case predictions
throughout the work in the form of a graph, which Active cases= confirmed cases - recovered cases -
is forecasted using a CNN trained model. deaths cases.
JETIR2202090 Journal of Emerging Technologies and Innovative Research (JETIR) www.jetir.org a742© 2022 JETIR February 2022, Volume 9, Issue 2 www.jetir.org (ISSN-2349-5162)
5. CONCLUSION (2020) https://www.medscape. com/view
article/924596
Data and Information about the novel • Chen N, Zhou M, Dong X, Qu J, Gong F, Han
corona virus and the outbreak’s progress become Y, Qiu Y, Wang J, Liu Y, Wei Y, Xia J, Yu T,
available at an unprecedented rate in today’s digital Zhang X, Zhang L (2020) Epidemiological and
and globalized society. Still, critical concerns clinical characteristics of 99 cases of 2019 novel
remain unsolved, and precise solutions for coronavirus pneumonia in Wuhan, China: a
anticipating the outbreak’s dynamics are just descriptive study. Lancet 395(10223):507–513
impossible to provide at this time. We emphasize • World health organization:
the ambiguity of available official statistics, https://www.who.int/new-room/g-adetail/q-a-
especially in terms of the real baseline number of corronaviruses#:/text=symptoms. Accessed 10 Apr
infected patients. 2020
• Wikipedia coronavirus Pandemic data:
We covered the whole global case count in https://en.m.wikipedia.
this project and forecasted future cases based on org/wiki/Template:2019%E2%80%9320_coronavir
global data in the following days. us_pan Demic data. Accessed 10 Apr 2020
We used an Indian dataset, obtained from • Khan Day, A.M.U.D., Amin, A., Manzoor, I.,
the COVID-19 India website, to train a CNN model & Bashir, R., ‘‘Face Recognition Techniques: A
and analyse the mortality and survival rates in Critical Review’’ 2018
India. • Kumar A, Dabas V, Hooda P (2018) Text
classification algorithms for mining unstructured
5.1 Future scope: data: a SWOT analysis. Int J Inf Technol.
In future study, we may utilize a global https://doi.org/10.1007/s41870-017-0072-1
dataset to analyse each nation’s data and forecast • Verma P, Khan Day AMUD, Rabani ST, Mir
confirmed and fatality cases by country, as well as MH, Jamwal S (2019) Twitter Sentiment Analysis
assess the accuracy of each model for data from on Indian Government Project using R. Int J Recent
various Indian states and predict cases. Tech Eng. https://doi.org/10.35940/ijrte.
C6612.098319
REFERENCES .
● Johns Hopkins Researchers Publish COVID-19
‘Prediction Model’
https://www.hopkinsmedicine.org/news/newsroom/
news-releases/johns-hopkins-researchers-
publishers.
• World health organization:
https://www.who.int/new-room/g-adetail/q-a-
corronaviruses#:/text=symptoms. Accessed 10 Apr
2020
• Wu F, Zhao S, Yu B, Chen YM, Wang W,
Song ZG, Hu Y, Tao ZW, Tian JH, Pei YY, Yuan
ML, Zhang YL, Dai FH, Liu Y, Wang QM, Zheng
JJ, Xu L, Holmes EC, Zhang YZ (2020) A new
coronavirus associated with human respiratory
disease in China. Nature 44(59):265–269
• Medscape Medical News, The WHO declares
public health emergency for novel coronavirus
JETIR2202090 Journal of Emerging Technologies and Innovative Research (JETIR) www.jetir.org a743You can also read