Predicting Falls in Long-term Care Facilities: Machine Learning Study - XSL FO
←
→
Page content transcription
If your browser does not render page correctly, please read the page content below
JMIR AGING                                                                                                                            Thapa et al

     Original Paper

     Predicting Falls in Long-term Care Facilities: Machine Learning
     Study

     Rahul Thapa1, BSc; Anurag Garikipati1, MSc; Sepideh Shokouhi1, PhD; Myrna Hurtado1, PhD; Gina Barnes1, MPH;
     Jana Hoffman1, PhD; Jacob Calvert1, MSc; Lynne Katzmann2, PhD; Qingqing Mao1, PhD; Ritankar Das1, MSc
     1
      Dascena Inc., Houston, TX, United States
     2
      Juniper Communities, Bloomfield, NJ, United States

     Corresponding Author:
     Sepideh Shokouhi, PhD
     Dascena Inc.
     12333 Sowden Rd Ste B PMB 65148
     Houston, TX, 77080-2059
     United States
     Phone: 1 (510) 826 950
     Email: sshokouhi@dascena.com

     Abstract
     Background: Short-term fall prediction models that use electronic health records (EHRs) may enable the implementation of
     dynamic care practices that specifically address changes in individualized fall risk within senior care facilities.
     Objective: The aim of this study is to implement machine learning (ML) algorithms that use EHR data to predict a 3-month
     fall risk in residents from a variety of senior care facilities providing different levels of care.
     Methods: This retrospective study obtained EHR data (2007-2021) from Juniper Communities’ proprietary database of 2785
     individuals primarily residing in skilled nursing facilities, independent living facilities, and assisted living facilities across the
     United States. We assessed the performance of 3 ML-based fall prediction models and the Juniper Communities’ fall risk
     assessment. Additional analyses were conducted to examine how changes in the input features, training data sets, and prediction
     windows affected the performance of these models.
     Results: The Extreme Gradient Boosting model exhibited the highest performance, with an area under the receiver operating
     characteristic curve of 0.846 (95% CI 0.794-0.894), specificity of 0.848, diagnostic odds ratio of 13.40, and sensitivity of 0.706,
     while achieving the best trade-off in balancing true positive and negative rates. The number of active medications was the most
     significant feature associated with fall risk, followed by a resident’s number of active diseases and several variables associated
     with vital signs, including diastolic blood pressure and changes in weight and respiratory rates. The combination of vital signs
     with traditional risk factors as input features achieved higher prediction accuracy than using either group of features alone.
     Conclusions: This study shows that the Extreme Gradient Boosting technique can use a large number of features from EHR
     data to make short-term fall predictions with a better performance than that of conventional fall risk assessments and other ML
     models. The integration of routinely collected EHR data, particularly vital signs, into fall prediction models may generate more
     accurate fall risk surveillance than models without vital signs. Our data support the use of ML models for dynamic, cost-effective,
     and automated fall predictions in different types of senior care facilities.

     (JMIR Aging 2022;5(2):e35373) doi: 10.2196/35373

     KEYWORDS
     vital signs; machine learning; blood pressure; skilled nursing facilities; independent living facilities; assisted living facilities; fall
     prediction; elderly care; elderly population; older adult; aging

     https://aging.jmir.org/2022/2/e35373                                                                  JMIR Aging 2022 | vol. 5 | iss. 2 | e35373 | p. 1
                                                                                                                (page number not for citation purposes)
XSL• FO
RenderX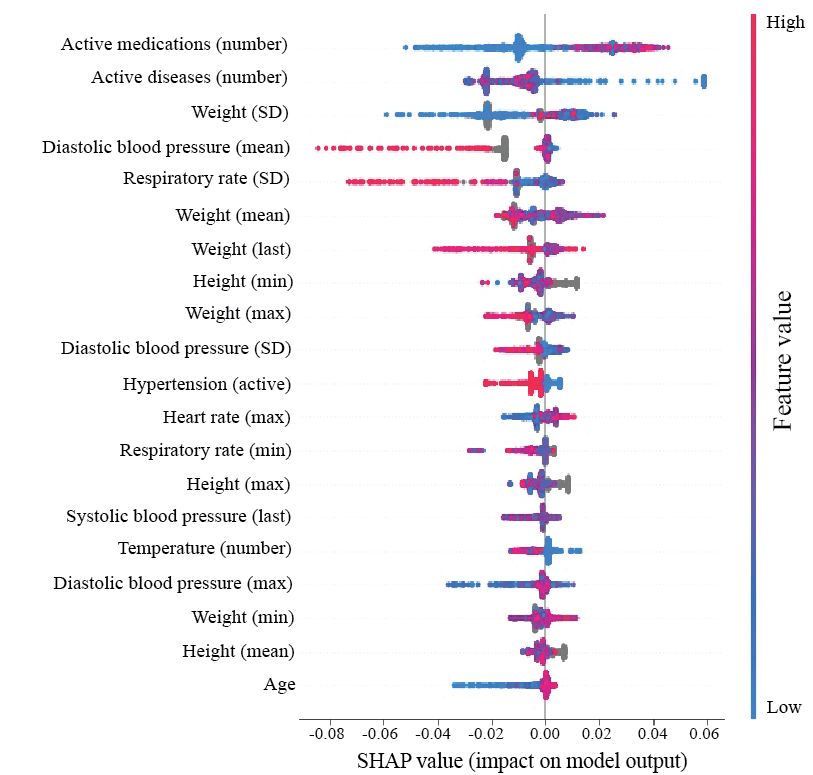
JMIR AGING                                                                                                                           Thapa et al

                                                                          As most residents at long-term care facilities are at heightened
     Introduction                                                         risk of falls, more accurate short-term risk predictions would
     Background                                                           help identify individuals who may require more assistance with
                                                                          daily activities and enable care practices that are tailored to
     Falls are a serious and complex safety concern, leading to           address short-term changes in fall risk and provide more
     mortality, morbidity, and increased health care costs associated     dynamic fall risk profiles of residents for staff. Although
     with aging. Accidents are the fifth leading cause of death in        previous research has primarily focused on identifying factors
     older adults, and falls account for two-thirds of all accidental     that increase the risk of falls, special emphasis must be placed
     deaths [1]. Individuals who live in institutions fall more often     on identifying factors that can reduce fall risk. In this context,
     (1.5 falls per bed per year) than community-living individuals,      it is critical to explore both the positive and negative associations
     of whom the latter are generally healthy older people [1].           between individual predictors and fall risk.
     Between these 2 groups, it is estimated that 60% will experience
     a fall each year [2]. Most falls have a multifactorial origin.       Objective
     Previously reported fall risk factors include gait impairment,       The primary objective of this study is to determine the utility
     balance impairment, age, sex, cognitive decline, diminished          of ML in predicting short-term falls in long-term senior care
     vision, fall history, medications that affect the central nervous    settings and determine whether performance accuracy remained
     system, and several comorbidities [3-10]. Current fall risk          consistent in different types of facilities that are characterized
     profiles in nursing homes rely primarily on strength, gait, and      by different levels of residents’ frailty and staff care
     balance measures [11]. Frequent administration and                   (independent living, assisted living, and nursing homes). The
     quantification of instruments that consider comprehensive risk       inclusion of various measurements associated with vital signs,
     factors create a challenge both in terms of impeding workflow        in addition to traditional risk factors that are incorporated into
     and interpreting results. Evidence for the best choice for fall      standard fall risk assessments, was one of the key designs of
     risk assessment in long-term facilities remains limited [2,12,13].   our ML models. Vital sign measures, such as blood pressure
     Electronic health records (EHRs) contain routinely collected         and respiratory rate, are dynamic parameters that reflect
     real-time information that represents most fall risk factors and     real-time changes in physiological function because of aging,
     thus offer the potential for dynamic surveillance of senior          frailty, different diseases, and treatments [25]. Although changes
     residents in long-term facilities to identify short-term fall        in vital signs are recognized as potential precursors to falls [26],
     triggers. Although the wide range of fall risk factors embedded      the predictive value of these variables for fall risk in long-term
     in EHR data poses methodological challenges to most traditional      senior care facilities has not been fully explored.
     statistical approaches, machine learning algorithms (MLAs)
     can screen a multitude of interacting risk factors from big data.    Methods
     Machine learning (ML) is a subfield of artificial intelligence
     that can use sample data to build a model for predicting future
                                                                          Data Source and Inclusion and Exclusion Criteria
     outcomes or identifying hidden patterns of intrinsic structures      This study used data collected from a proprietary database
     within input data without explicit programming or data               containing EHR data from senior living communities (Juniper
     engineering. The two most commonly used ML methods are               Communities, LLC) in the United States. The Juniper facilities
     supervised and unsupervised learning. Supervised learning trains     included in this study were skilled nursing facilities, independent
     algorithms based on labeled training data, whereas the               living facilities, assisted living facilities, and other non-major
     unsupervised learning approach does not require labeled training     facilities without specific designations. Data were extracted
     and can find structures within the data. Several EHR-based           from 2007 to 2021. Data were deidentified in compliance with
     MLAs have been developed for fall risk predictions in                the Health Insurance Portability and Accountability Act. As
     hospitalized patients [14-18]. Few studies have explored the         this study constituted nonhuman participants research per 45
     utility of ML approaches for senior residents in                     Code of Federal Regulations 46.102, institutional review board
     community-dwelling or long-term assisted living facilities           approval was not required. Initially, the Juniper EHR contained
     [19-23]. Here, we developed an EHR-based supervised ML               data from 2785 residents. The first step of the filtration process
     model using a gradient boosting (Extreme Gradient Boosting           removed residents who did not have the first measurement time,
     [XGBoosting]) algorithm to evaluate fall incidents within a          the last measurement time, or any EHR data, including
     3-month window. By implementing advanced MLAs on EHR                 diagnostic codes. We then excluded all residents age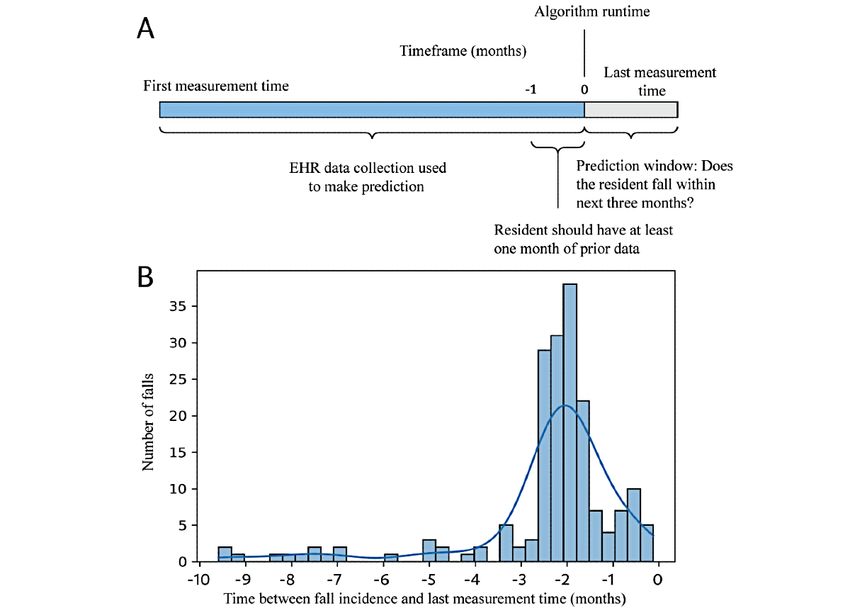
JMIR AGING                                                                                                                              Thapa et al

     strings, such as “fall” and “on the floor.” To meet the gold               guideline for selecting the prediction window. We determined
     standard definition of our study, the fall had to occur within a           that the selection of a 3-month prediction window offered a
     3-month period before the last measurement, as shown in (Figure            good trade-off between maximizing the number of positive
     2A). The last measurement time was defined as the time at                  cases; that is, participants who experienced a fall within the
     which data were collected from the resident. We used the                   given time while remaining within a reasonably short prediction
     distribution of the time differences between the fall incidents            window. A shorter prediction window reduces the number of
     and the last measurement time (Figure 2B) of our cohort as a               positive cases, leading to a more imbalanced data set.
     Figure 1. Participant encounter inclusion and exclusion diagram. EHR: electronic health record.

     https://aging.jmir.org/2022/2/e35373                                                                    JMIR Aging 2022 | vol. 5 | iss. 2 | e35373 | p. 3
                                                                                                                  (page number not for citation purposes)
XSL• FO
RenderX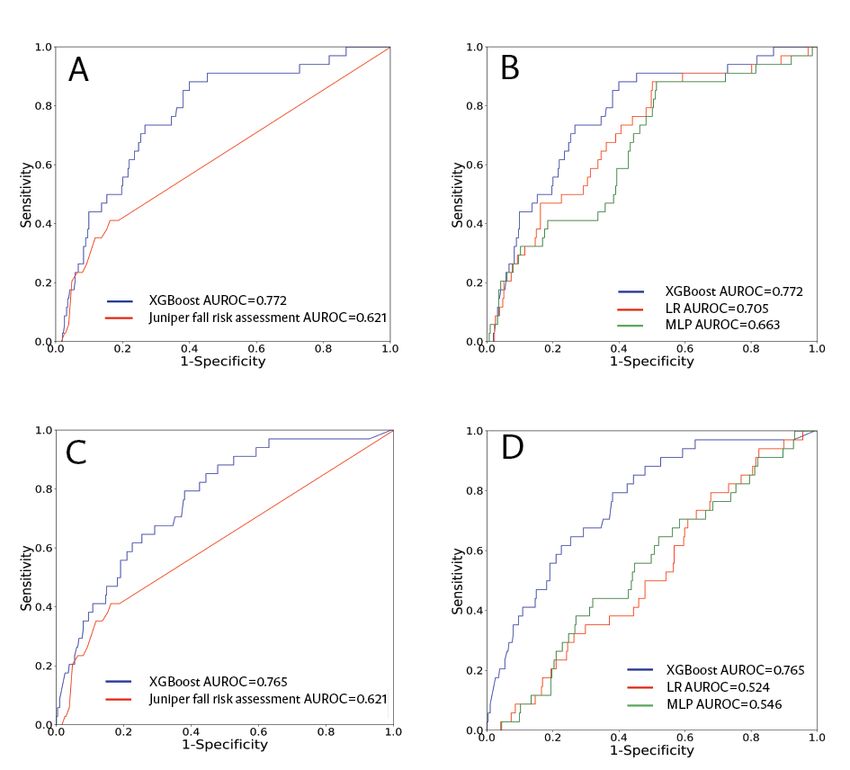
JMIR AGING                                                                                                                                       Thapa et al

     Figure 2. (A) Study design timeline. (B) Selection of the optimal prediction window based on the distribution of the fall incidence time. EHR: electronic
     health record.

                                                                                   included age, sex, specific vital sign measurements (diastolic
     ML Input Features for Fall Prediction                                         and systolic blood pressure, heart rate, respiratory rate, and
     We conducted a literature search to gather previously reported                temperature), specific physical and movement features (height,
     fall risk factors and determine whether they could be identified              weight, history of falls, and lower extremity fracture or
     within the EHR system based on relevant ICD codes, string                     dislocation), specific comorbidities (hypertension, chronic heart
     searches, or keyword queries. We included several major risk                  failure, stroke and cerebrovascular, and number of active
     factors such as age, sex, previous fall history, weakness,                    diseases),       and       medications        (benzodiazepines,
     dizziness, cognitive impairment, dementia, depression, impaired               angiotensin-converting enzyme inhibitors, antiepileptic and
     mobility, and gait or balance abnormalities [3,28,29]. The fall               anticonvulsants, and total number of active medications). In
     history was included as the time difference between the MLA                   addition to feature importance, the Shapely Additive
     runtime and the most recent history of falls normalized to a                  Explanations (SHAP) analysis enhances the interpretability of
     year. In addition to dementia, depression, and mood disorders,                the model by showing positive and negative associations and
     we included other comorbidities [30] and medications implicated               their strengths between individual features and fall risk.
     in fall risk [31-33] (Table S1 in Multimedia Appendix 1).
     Medications included benzodiazepines [9,34], antiepileptics                   For vital sign measurements, 4 months of data were used before
     [35], angiotensin-converting enzyme inhibitors [32],                          the algorithm runtime. We filtered out data (vital signs and
     antidepressants [9], antipsychotics [36], narcotics [37], diuretics           laboratory measures) that were identified as extreme outliers
     [36,38], β-blockers [39], antihistamines [33], neuromuscular                  using the physiological minimum and maximum values. After
     blocking agents [40], calcium channel blockers [32],                          removing these outliers, summary statistics, including minimum
     antiarrhythmics [41], sedatives, and hypnotics [9]. The                       (min), maximum (max), mean, standard deviation (SD), last
     participants’ vital sign measures and laboratory results were                 measurement (last), and the number of measurements (number),
     queried using the key names in the EHRs. The complete list of                 were used as input features. We calculated the summary
     features and associated ICD codes can be found in Tables S1                   statistics of the patient data over the last 1 month. Features
     and S2 in Multimedia Appendix 1. The feature importance                       related to comorbidities or medications were added as either
     metric was used to preselect the best features for the ML models,             previous or current comorbidities and medications. Given that
     reducing the number of features from 250 to 68. Bolded features               our data did not provide structured information about medication
     in Table S1 in Multimedia Appendix 1 are those that were                      dosage, we were not able to include dosage as an input feature.
     preselected on the feature importance metric. These features
     https://aging.jmir.org/2022/2/e35373                                                                             JMIR Aging 2022 | vol. 5 | iss. 2 | e35373 | p. 4
                                                                                                                           (page number not for citation purposes)
XSL• FO
RenderX
JMIR AGING Thapa et al
Comparison With Standard of Care 2, 3) for lambda, (1, 3, 5, 7, 9, 11, 13) for scale positive weight,
An internal fall risk assessment conducted by Juniper (0.0001, 0.001, 0.01, 0.1) for learning rate, and (50, 75, 100,
Communities staff served as a comparator. Participant scores 125, 150, 500) for the number of estimators. The XGBoosting
(0-25) were tallied from several items, including the level of model used 6, 1.0, 13, 0.001, and 75 as the optimized values
consciousness or mental status, history of fall, ambulation for the aforementioned parameters. For logistic regression, the
elimination, vision, gait, balance, medications, systolic blood optimization parameters were the penalty term, class weight,
pressure, and previous predisposition (eg, vertigo, obesity, optimization problem solver, and inverse of regularization
osteoporosis, or Parkinson disease). strength. The optimization parameters of the multilayered
perceptron model included the maximum iteration, hidden layer
ML Model size, and learning rate. For the logistic regression and
Our primary model, XGBoosting, was a gradient boosting multilayered perceptron models, missing values were handled
algorithm [42] implemented in Python [43]. XGBoosting using various imputation approaches. Missing measures of vital
combines the results from various decision trees to obtain the signs were imputed using the forward and backward filling
prediction scores. Within each decision tree, the resident approaches. For all other features, the mean measurement of
population was split into successively smaller groups, as each the features across all the training set data was used for the
tree branch divided the residents who entered it into 1 of 2 imputation. For the logistic regression model, the inputs were
groups based on their covariate value and a predetermined scaled using a standard scaler from scikit-learn. The optimization
threshold. Fall residents were represented at the end of the algorithms for the logistic regression model included the
decision tree, which were a set of leaf nodes. After the limited-memory Broyden-Fletcher-Goldfarb-Shanno algorithm
XGBoosting model was trained, successive trees were developed and L2 regularization. The multilayered perceptron model
to improve the accuracy of the model. Successive iterations of incorporated a hidden layer of size 250. The convergence of the
trees use gradient descent on the prior trees to minimize the solver iteration was determined either by reaching a maximum
error of the next tree that was formed. XGBoosting has been number (100) of iterations or by reaching a value of 1e-9 for
shown to exhibit excellent performance for a wide range of the tolerance optimization parameter. All other parameters were
classification problems in acute and chronic conditions [44-48]. kept at default values from the scikit-learn multilayered
For comparison with the structurally complex XGBoosting perceptron classifier. The performance of each model was
model, logistic regression and multilayered perceptron models assessed against the test data set with respect to the receiver
were also trained and tested. A multilayered perceptron is a operating characteristic (ROC) curve, sensitivity, and specificity.
common network architecture with feed-forward neural The confidence intervals (CIs) for these metrics were
networks composed of several layers of nodes with constructed using 1000 bootstrapped samples. SHAP [49]
unidirectional connections. Unlike the XGBoosting model, analysis was performed to evaluate the feature importance.
logistic regression and multilayered perceptron models are Exploratory Analyses
unable to incorporate missing data; therefore, the median of
observation was used for imputation of the features. In addition, Several exploratory analyses were conducted in this study. In
we standardized our data for both the logistic regression and the first experiment, we examined how the performance of the
multilayered perceptron models. All the 3 models were trained XGBoosting, logistic regression, multilayered perceptron, and
using the same 68 inputs. The development environment of our comparator changed after reducing the prediction window to 2
MLAs (software package, library, and version) is summarized months. We conducted a secondary experiment in which we
in Table S3 in Multimedia Appendix 1. separated the training and testing sets based on the type of
facility (skilled nursing, independent living, and assisted living
We used a standard approach to train ML models. We facilities). In the first case, data from the skilled nursing facility
partitioned the data set into a train:test ratio of 80:20 with were used as the testing set, whereas data from all other facilities
stratified sampling because the positive class was relatively were used for model training. In the second case, assisted living
small with respect to the negative class. Both the training and facility data were used as the testing set, whereas data from all
test sets included a random mix of all four types (skilled nursing other facilities were used for model training. Owing to the small
facilities, assisted living facilities, independent living facilities, number of positive cases, independent living facilities were not
and others) of long-term facilities within Juniper Communities. tested separately. We conducted a third experiment in which
All the models underwent hyperparameter selection using a we modified the input features of all 3 ML models to evaluate
5-fold cross-validation grid search. The optimization of their impact on the model performance. First, we removed vital
hyperparameters was confirmed by evaluating the area under signs from the input features. Then, we included only the vital
the receiver operating characteristic (AUROC) curve for signs and demographic information (age and sex) and removed
different combinations of hyperparameters included in the grid all other features, such as fall history, comorbidities, and medical
search. For XGBoosting, the optimization parameters were the conditions.
maximum tree depth, regularization term (lambda), scale
positive weight, learning rate, and number of estimators. The Results
scale positive rate can be readily optimized within the
XGBoosting algorithm to handle class imbalance in the data Data Set Characteristics
set (a lower number of residents who experienced a fall). We In total, 2785 residents were included in this study, of whom
used a parameter space of (4, 6, 8, 10) for tree depth, (0.5, 1.0, 153 (153/2785, 5.49%) fell within the 3-month prediction
https://aging.jmir.org/2022/2/e35373 JMIR Aging 2022 | vol. 5 | iss. 2 | e35373 | p. 5
(page number not for citation purposes)
XSL• FO
RenderXJMIR AGING Thapa et al
window of our algorithm, as defined by our gold standard. The model exhibited the highest performance with an AUROC of
number of women was approximately twice that of men. Group 0.846 for the prediction of falls within the next 3 months. The
differences were calculated using an exact binomial test for logistic regression model and the multilayered perceptron model
noncontinuous variables and 2-tailed Welch t test for continuous demonstrated AUROCs of 0.711 and 0.697, respectively. The
variables to handle the unequal variance associated with the 2 comparator (Juniper fall assessment) had an AUROC of 0.621.
groups. The fall incidents varied among the types of facilities We selected an operating sensitivity of 0.70 for all 3 ML models
(Table S4 in Multimedia Appendix 1). Skilled nursing facilities and 0.35 for the comparator (based on the Juniper fall risk score
had the highest (49/489, 10%) and independent living facilities threshold). The feature importance plot (Figure 4) shows the
had the lowest (5/69, 7%) fall incidents. Table S5 in Multimedia most important XGBoosting features, including the number of
Appendix 1 summarizes the demographic and diagnostic active medications, number of active diseases, SD of weight,
information for nonfall residents (negative cases; age: mean mean diastolic blood pressure, and SD of respiratory rate.
85.7, SD 9.5 years) and fall residents (positive cases; age: mean Younger age, lower weight fluctuations, and a larger number
86.6, SD 8.2 years). of active diseases were associated with a lower fall risk. A
higher number of active medications was associated with a
Model Performance higher risk of falls. A higher mean value of diastolic arterial
The complete list of performance metrics for the MLAs and blood pressure (DiasAB) and higher fluctuations in respiratory
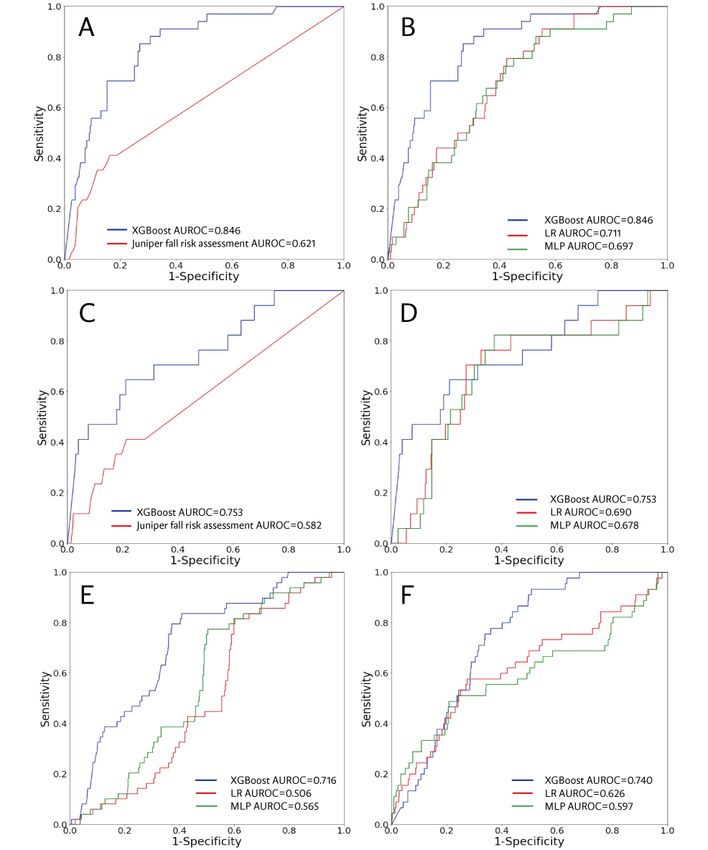
comparator is shown in Table 1. The ROC curves for the hold rate were associated with lower fall risk.
out test set are shown in Figures 3A and 3B. The XGBoosting
Table 1. Performance metrics and 95% confidence intervals (CIs) of the gradient-boosted decision trees model (Extreme Gradient Boosting) with the
top 68 features, the Juniper fall risk assessment score, and other machine learning models (logistic regression and multilayered perceptron) for the
3-month prediction of fall.
Variable Extreme Gradient Boosting Logistic regression Multilayered perceptron Juniper fall risk
Area under the receiver operating charac- 0.846 (0.794-0.894) 0.711 (0.645-0.773) 0.697 (0.624-0.765) 0.621 (0.547-0.693)
teristic curve (95% CI)
Sensitivity (95% CI) 0.706 (0.577-0.833) 0.706 (0.553-0.859) 0.706 (0.571-0.833) 0.351 (0.217-0.485)
Specificity (95% CI) 0.848 (0.809-0.888) 0.614 (0.560-0.668) 0.612 (0.566-0.657) 0.883 (0.854-0.911)
Positive likelihood ratio 4.647 1.828 1.813 3.014
Negative likelihood ratio 0.346 0.479 0.481 0.733
Diagnostic odds ratio (95% CI) 13.400 (6.026-29.796) 3.816 (1.764-8.256) 3.766 (1.741-8.147) 4.113 (1.881-8.995)
True positive 24 24 24 12
True negative 268 194 193 279
False positive 48 122 123 37
False negative 10 10 10 22
F1a 0.393 0.262 0.248 0.289
a
F score is defined as the harmonic mean between precision and recall.
https://aging.jmir.org/2022/2/e35373 JMIR Aging 2022 | vol. 5 | iss. 2 | e35373 | p. 6
(page number not for citation purposes)
XSL• FO
RenderXJMIR AGING Thapa et al
Figure 3. Row 1: Receiver operating characteristic (ROC) curves of the Extreme Gradient Boosting (XGBoost) model for three-month prediction
compared with (A) the Juniper fall risk assessment and (B) other machine learning ML models. Row 2: ROC curves of the XGBoost model for a
two-month prediction window compared with (C) the Juniper fall risk assessment and (D) other ML models. Row 3: ROC curves across different
facilities. (E) Skilled nursing facility separated as a testing set and (F) Assisted living facility separated as a testing set. AUROC: area under the receiver
operating characteristic; ML: machine learning; MLP: multilayered perceptron; LR: logistic regression.
https://aging.jmir.org/2022/2/e35373 JMIR Aging 2022 | vol. 5 | iss. 2 | e35373 | p. 7
(page number not for citation purposes)
XSL• FO
RenderXJMIR AGING Thapa et al
Figure 4. Feature correlations and distribution of feature importance for the Extreme Gradient Boosting (XGBoost) model at the three-month prediction
window. The y-axis on the SHAP plot presents the features in order of importance from top to bottom. The SHAP values on the x-axis quantify the
magnitude and direction in which each feature impacts the model prediction. SHAP: Shapely Additive Explanations.
validation, we separated the training and test sets based on
Reduction of Prediction Window facility type. The ROC curves for the models are shown in
The ROC curves for the 2-month prediction window on the hold Figures 3E and 3F, showing that the XGBoosting AUROCs
out test set are presented in Figures 3C and 3D. The XGBoosting were higher than all other predictors for both the skilled nursing
model exhibited the highest performance with an AUROC of facility (0.716) and assisted living facility (0.740) test sets.
0.753. The logistic regression and multilayered perceptron
models demonstrated AUROC of 0.690 and 0.678, respectively. Modifying Input Features
The AUROC associated with the Juniper fall risk assessment The ROC curves associated with the modified input features
score was 0.582. Table S6 in Multimedia Appendix 1 presents (3-month prediction window) are shown in Figure 5. When all
additional performance metrics. Figure S1 in Multimedia variables related to vital signs were removed, the XGBoosting
Appendix 1 shows the XGBoosting SHAP plot for the 2-month model maintained the highest performance with an AUROC of
prediction window. 0.772. Similarly, when using only demographic information
(age and sex) and vital signs as input features, the XGBoosting
Separating Training and Testing Data Set by Facility model achieved the best performance, with an AUROC of 0.765.
Type The SHAP plots of the models with the modified features are
The EHR data set used in this study contained data from various shown in Figures S2 and S3 in Multimedia Appendix 1.
care facilities. As part of the post hoc analyses and external
https://aging.jmir.org/2022/2/e35373 JMIR Aging 2022 | vol. 5 | iss. 2 | e35373 | p. 8
(page number not for citation purposes)
XSL• FO
RenderXJMIR AGING Thapa et al
Figure 5. (A) Comparison between receiver operating characteristic (ROC) curves of Extreme Gradient Boosting (XGBoost) without vital signs and
Juniper the fall risk model. (B) Comparison between ROC curves of XGBoost and other machine learning ML models without vital signs. (C) Comparison
between ROC curves of XGBoost using only demographic information (age and sex) and vital signs and the Juniper fall risk model. (D) ROC curve of
three ML models using demographic information and vital signs. AUROC: area under the receiver operating characteristic; ML: machine learning;
MLP: multilayered perceptron; Logistic: Logistic Regression.
Best EHR-Based Features for Fall Prediction
Discussion
Unlike standard fall risk assessment tools, MLA models can
Summary of the Study flag the importance of individual variables in predicting fall
We developed an EHR-based ML model for short-term fall risk. The number of active medications was identified as the
prediction in different long-term care facilities. Initially, 250 most significant feature associated with a higher fall incidence,
features were extracted from the EHR data, although only 68 followed by a resident’s number of active diseases and weight
features passed the initial selection process based on the feature changes. The impact of the number of medications on fall
importance metric. These features were used to train the final incidents has been reported by previous observations in nursing
XGBoosting, logistic regression, and multilayered perceptron homes, demonstrating that fall risk is associated with
models. Using individual data collected from the residents’ polypharmacy regimens that include at least one fall-increasing
EHR system, XGBoosting outperformed the Juniper fall risk drug [41]. The 68 selected (out of 250) best features included
assessment tool, which yielded only an AUROC of 0.621 versus several well-established fall risk factors, such as age, sex, history
0.846 for XGBoosting. XGBoosting achieved a good trade-off of falls, benzodiazepine, and antiepileptic medications. Except
in balancing the true positive and true negative rates (Table 1), for the number of active medications, active diseases,
outperforming the 2 other baseline ML models in both metrics. hypertension, weight, and age, all other features with the highest
ranking were measurements of vital signs, which were not used
in the Juniper fall assessment. The most significant vital sign
https://aging.jmir.org/2022/2/e35373 JMIR Aging 2022 | vol. 5 | iss. 2 | e35373 | p. 9
(page number not for citation purposes)
XSL• FO
RenderXJMIR AGING Thapa et al
measure was mean diastolic blood pressure, with higher values top-ranking features. Moreover, our findings suggest that the
inversely correlated with fall risk. Given that most of our study combination of vital signs with traditional risk factors can
participants were women, this finding is also in line with a achieve higher prediction accuracy than using either group of
previous study on the relationship between blood pressure and features alone.
falls in community-dwelling adults aged ≥60 years [50], where
an increase in diastolic and systolic blood pressure reduced the
Implications of Findings
risk of falls in women. The negative correlation between the The Centers for Medicare and Medicaid Services facilities are
number of active diseases and fall risk was likely because of required to complete a fall risk assessment upon residents’
the expected mobility restrictions of residents with multiple admission, using the minimum data set (MDS) tool. Given that
concurrent comorbidities. Separating weakness, dizziness, and reassessments are not conducted frequently [53-55], changes
unsteadiness due to other comorbidities did not affect the in a resident’s fall risk status may not be detected in a timely
performance. Including the difference between consecutive vital manner. The United States Centers for Disease Control has
sign measurements as individual features also did not improve established the Stopping Elderly Accidents, Deaths & Injuries
the performance; therefore, we removed these features from the program [56] to evaluate clinical fall risk prevention programs
feature matrix to simplify our model. and provide best practice recommendations. The existence of
the Stopping Elderly Accidents, Deaths & Injuries program
Reduction of Prediction Window highlights the gap in existing risk prediction and risk
Although the performance of all 3 MLAs and the comparator stratification tools that are generalizable and have high accuracy.
risk stratification tool used by Juniper relapsed after reducing Commonly used fall risk stratification tools, such as the Morse
the prediction window to 2 months, the XGBoosting model Fall Scale, St Thomas’s risk assessment tool in falling inpatients,
continued to exhibit the highest performance. The observed and the Berg Balance Scale [31,57], rely on a clinician’s
performance decline associated with the 2-month prediction assessment of gait, mental status, and mobility. As Juniper
window was likely because of the lack of data, as illustrated in facilities have their own internal fall risk assessment, this was
Figure 2B (loss of positive cases from 153 to 80). The optimal an appropriate comparator for our study, as opposed to
prediction window (3 months) was selected based on the comparing our MLA with any of the aforementioned tools.
frequency of the data present in the EHR. Owing to the Traditional models overlook other significant fall risk factors
importance of vital signs in predicting short-term fall risks, that we identified in our ML models, such as diastolic blood
more frequent and consistent collection of these variables may pressure and respiratory rate, which are measurements easily
allow shorter prediction windows without losing accuracy. obtained from EHR data without interrupting the clinical
workflow. The sensitivity of these tools is inconsistent across
External Validation the literature, ranging from 33.33% to 95% [58]. Using the MDS
In addition to our primary model, which used EHR data from data set, the study by Marier et al [53] examined the use of MDS
various facilities for training and testing, we explored other in tandem with EHR data, as the latter incorporates more
models in which one of the facilities was excluded from the frequent clinical measurements that may indicate changes in an
training set but used for external validation. In both test cases, individual’s health status, thus potentially providing improved
the XGBoosting-based model outperformed other ML risk assessment [51]. The study determined that the use of EHR
algorithms. The XGBoosting AUROC in the assisted living data improved fall risk identification by 13% compared with
facility test case was slightly higher (0.740) than that in the using only MDS data, which may be attributed to the fact that
skilled nursing facility test case (0.716). This difference may EHR is updated more frequently. Long-term care facilities have
be explained by the presence of a wider range of medication a lower rate of EHR implementation and use than other clinical
and comorbidities and more frequently measured vital signs in settings (18%-48%). Using an XGBoosting-ML approach with
skilled nursing facility residents, making this cohort potentially EHR data without vital signs, the study by Ye et al [27]
a better training set for other facilities with fewer disabilities predicted fall incidents in hospitalized patients >65 years of
and medical conditions in their residents. In general, individuals age. At the 1- and 2-month prediction windows, they were able
living in skilled nursing facilities demand a higher level of to predict only 55% to 58% of falls, which may be attributed
nursing care and assistance with their daily activities than to the lack of vital signs in their model. The EHR-based ML
residents in assisted living communities or independent living models for fall prediction are also cost-effective. Early
facilities. In this study, the skilled nursing facility fall incidents identification of high-risk individuals can enable prompt
were approximately 1.4 times higher than those of independent intervention, such as the removal of environmental hazards or
living facility fall incidents, which is consistent with previous providing additional assistance with specific daily activities
epidemiological reports [28]. (bathroom visits), behavioral therapy, and exercise for muscle
strengthening.
Impact of Vital Signs
Several previous studies have identified history of falls as one Study Limitations and Future Directions
of the most prominent risk factors for falls [51,52]. In our cohort, Our study has several limitations. First, this study was restricted
the history of falls was among the 68 preselected features, to retrospective data with highly imbalanced classes, missing
although it did not always rank among the top 20. When data, and a higher prevalence of women in the data set. Although
removing vital signs from the input features, fall history, lower the ML algorithms implemented several optimization parameters
extremity fractures, dizziness, and vertigo appeared among the to overcome these shortcomings (see Table S6 in Multimedia
https://aging.jmir.org/2022/2/e35373 JMIR Aging 2022 | vol. 5 | iss. 2 | e35373 | p. 10
(page number not for citation purposes)
XSL• FO
RenderXJMIR AGING Thapa et al
Appendix 1 for model performance evaluation in women and conditions and the potential that some fall events were missing
men), the impact of EHR data quality and class balance on from the EHRs. Further research and the use of our MLAs for
model performance could not be evaluated in this study. fall risk prediction before implementation are warranted. Future
Regarding medication use, previous research has identified a directions for this research will focus on developing and
dose-response relationship between medications, particularly implementing more interpretable ML models, such as the
benzodiazepines [59], and fall risk. Given that our data did not explainable boosting machine or deep learning techniques (eg,
provide structured information about medication dosage, we recurrent neural networks). This will allow for the incorporation
were not able to include dosage as an input feature. The lack of of additional forms of digitized physiological and behavioral
standardized data collection methods for residents of different data that may be relevant to fall risks. Recurrent neural networks
types of communities poses another methodological challenge. can process sequences of input data with variable lengths,
In particular, the collection of vital sign measures was highly making them applicable for recognizing patterns in
variable across facilities and individuals. Given the importance electrocardiogram signals, motion, and speech notes [60-63].
of vital signs for fall risk, a more frequent and consistent
collection of vital signs could leverage the extraction of
Conclusions
fine-grained features (change in diastolic pressure between This study shows that the XGBoosting technique can use a large
measurements). Although the study findings were validated number of features from EHR data to make short-term fall
across different types of Juniper care facilities, the predictions with a better performance than conventional fall
generalizability of the findings outside Juniper Communities risk assessments and other ML models. The integration of
warrants further investigation. More than half of the individuals’ routinely collected EHR data, particularly vital signs, into fall
fall incidences were not recorded using ICD codes (gold prediction models may generate a more accurate fall risk
standard), and a manual search of their progress notes was surveillance than models without vital signs. Our data support
required to identify these falls. Other study limitations include the use of ML models for dynamic, cost-effective, and
the lack of information regarding the severity of medical automated fall prediction in different types of senior care
facilities.
Acknowledgments
The authors would like to thank Megan Handley for her assistance with manuscript preparation.
Conflicts of Interest
RT, AG, SS, MH, GB, JH, JC, QM, and RD are employees or contractors of Dascena (Houston, Texas, United States). Dascena
seeks to promote objectivity in research by establishing standards that provide a reasonable expectation that the design, conduct,
and reporting of research will be free from bias resulting from Investigator financial conflicts of interest. As such, Dascena
maintains an active and enforced Financial Conflict of Interest Policy, developed to be in conformance with Federal regulation
42 CFR Part 50 Subpart F and 45 CFR Part 94.
Multimedia Appendix 1
Supplementary materials.
[DOCX File , 676 KB-Multimedia Appendix 1]
References
1. Rubenstein LZ, Josephson KR, Robbins AS. Falls in the nursing home. Ann Intern Med 1994 Sep 15;121(6):442-451. [doi:
10.7326/0003-4819-121-6-199409150-00009] [Medline: 8053619]
2. Wagner LM, Dionne JC, Zive JR, Rochon PA. Fall risk care processes in nursing home facilities. J Am Med Dir Assoc
2011 Jul;12(6):426-430. [doi: 10.1016/j.jamda.2010.07.019] [Medline: 21450202]
3. Ambrose AF, Paul G, Hausdorff JM. Risk factors for falls among older adults: a review of the literature. Maturitas 2013
May;75(1):51-61. [doi: 10.1016/j.maturitas.2013.02.009] [Medline: 23523272]
4. Lee A. Preventing falls in the geriatric population. Perm J 2013 Dec 2:37-39. [doi: 10.7812/tpp/12-119]
5. Yamazaki Y, Hayashida CT, Yontz V. Insights about fall prevention of older adults in the state of Hawai'i. Hawaii J Med
Public Health 2017 Jan;76(1):3-8 [FREE Full text] [Medline: 28090397]
6. Vu MQ, Weintraub N, Rubenstein LZ. Falls in the nursing home: are they preventable? J Am Med Dir Assoc
2004;5(6):401-406. [doi: 10.1097/01.JAM.0000144553.45330.AD] [Medline: 15530179]
7. Cameron EJ, Bowles SK, Marshall EG, Andrew MK. Falls and long-term care: a report from the care by design observational
cohort study. BMC Fam Pract 2018 May 24;19(1):73 [FREE Full text] [doi: 10.1186/s12875-018-0741-6] [Medline:
29793427]
8. Chan DK, Chan LK. Falls in nursing homes: challenges from a nursing perspective. Br J Community Nurs 2019 Jan
02;24(1):6-9. [doi: 10.12968/bjcn.2019.24.1.6] [Medline: 30589586]
https://aging.jmir.org/2022/2/e35373 JMIR Aging 2022 | vol. 5 | iss. 2 | e35373 | p. 11
(page number not for citation purposes)
XSL• FO
RenderXJMIR AGING Thapa et al
9. Woolcott JC, Richardson KJ, Wiens MO, Patel B, Marin J, Khan KM, et al. Meta-analysis of the impact of 9 medication
classes on falls in elderly persons. Arch Intern Med 2009 Nov 23;169(21):1952-1960. [doi: 10.1001/archinternmed.2009.357]
[Medline: 19933955]
10. Rispens SM, van Schooten KS, Pijnappels M, Daffertshofer A, Beek PJ, van Dieën JH. Do extreme values of daily-life
gait characteristics provide more information about fall risk than median values? JMIR Res Protoc 2015 Jan 05;4(1):e4
[FREE Full text] [doi: 10.2196/resprot.3931] [Medline: 25560937]
11. Borowicz A, Zasadzka E, Gaczkowska A, Gawłowska O, Pawlaczyk M. Assessing gait and balance impairment in elderly
residents of nursing homes. J Phys Ther Sci 2016 Sep;28(9):2486-2490 [FREE Full text] [doi: 10.1589/jpts.28.2486]
[Medline: 27799676]
12. Nunan S, Brown Wilson C, Henwood T, Parker D. Fall risk assessment tools for use among older adults in long-term care
settings: a systematic review of the literature. Australas J Ageing 2018 Mar 23;37(1):23-33. [doi: 10.1111/ajag.12476]
[Medline: 29168303]
13. Glass A, Mendelson G, Ben Natan M. Comparison of two fall-risk assessment tools used in a long-term care facility. Int J
Healthcare Qual Assurance 2020 Mar 21;33(3):237-246. [doi: 10.1108/ijhcqa-03-2019-0065]
14. Lindberg DS, Prosperi M, Bjarnadottir RI, Thomas J, Crane M, Chen Z, et al. Identification of important factors in an
inpatient fall risk prediction model to improve the quality of care using EHR and electronic administrative data: a
machine-learning approach. Int J Med Inform 2020 Nov;143:104272 [FREE Full text] [doi: 10.1016/j.ijmedinf.2020.104272]
[Medline: 32980667]
15. Patterson B, Engstrom C, Sah V, Smith M, Mendonça EA, Pulia M, et al. Training and interpreting machine learning
algorithms to evaluate fall risk after emergency department visits. Med Care 2019 Jul;57(7):560-566 [FREE Full text] [doi:
10.1097/MLR.0000000000001140] [Medline: 31157707]
16. Nakatani H, Nakao M, Uchiyama H, Toyoshiba H, Ochiai C. Predicting inpatient falls using natural language processing
of nursing records obtained from Japanese electronic medical records: case-control study. JMIR Med Inform 2020 Apr
22;8(4):e16970 [FREE Full text] [doi: 10.2196/16970] [Medline: 32319959]
17. Hsu Y, Weng H, Kuo C, Chu T, Tsai Y. Prediction of fall events during admission using eXtreme gradient boosting: a
comparative validation study. Sci Rep 2020 Oct 08;10(1):16777 [FREE Full text] [doi: 10.1038/s41598-020-73776-9]
[Medline: 33033326]
18. Cho I, Jin IS, Park H, Dykes PC. Clinical impact of an analytic tool for predicting the fall risk in inpatients: controlled
interrupted time series. JMIR Med Inform 2021 Nov 25;9(11):e26456 [FREE Full text] [doi: 10.2196/26456] [Medline:
34626168]
19. Lo Y, Lynch SF, Urbanowicz RJ, Olson RS, Ritter AZ, Whitehouse CR, et al. Using machine learning on home health care
assessments to predict fall risk. Stud Health Technol Inform 2019 Aug 21;264:684-688. [doi: 10.3233/SHTI190310]
[Medline: 31438011]
20. Lee S, Ahn J, Shin JH, Lee JY. Application of machine learning methods in nursing home research. Int J Environ Res
Public Health 2020 Aug 27;17(17):6234. [doi: 10.3390/ijerph17176234] [Medline: 32867250]
21. Yang Y, Hirdes JP, Dubin JA, Lee J. Fall risk classification in community-dwelling older adults using a smart wrist-worn
device and the resident assessment instrument-home care: prospective observational study. JMIR Aging 2019 Jun
07;2(1):e12153 [FREE Full text] [doi: 10.2196/12153] [Medline: 31518278]
22. Martins AC, Moreira J, Silva C, Silva J, Tonelo C, Baltazar D, et al. Multifactorial screening tool for determining fall risk
in community-dwelling adults aged 50 years or over (FallSensing): protocol for a prospective study. JMIR Res Protoc 2018
Aug 02;7(8):e10304 [FREE Full text] [doi: 10.2196/10304] [Medline: 30072360]
23. Wilmink G, Dupey K, Alkire S, Grote J, Zobel G, Fillit HM, et al. Artificial intelligence-powered digital health platform
and wearable devices improve outcomes for older adults in assisted living communities: pilot intervention study. JMIR
Aging 2020 Sep 10;3(2):e19554 [FREE Full text] [doi: 10.2196/19554] [Medline: 32723711]
24. Thapa R, Iqbal Z, Garikipati A, Siefkas A, Hoffman J, Mao Q, et al. Early prediction of severe acute pancreatitis using
machine learning. Pancreatology 2022 Jan;22(1):43-50 [FREE Full text] [doi: 10.1016/j.pan.2021.10.003] [Medline:
34690046]
25. Weenk M, van Goor H, Frietman B, Engelen LJ, van Laarhoven CJ, Smit J, et al. Continuous monitoring of vital signs
using wearable devices on the general ward: pilot study. JMIR Mhealth Uhealth 2017 Jul 05;5(7):e91. [doi:
10.2196/mhealth.7208]
26. Jasniewski J. Take steps to protect your patient from falls. Nursing 2006 Apr;36(4):24-25. [doi:
10.1097/00152193-200604000-00015] [Medline: 16582724]
27. Ye C, Li J, Hao S, Liu M, Jin H, Zheng L, et al. Identification of elders at higher risk for fall with statewide electronic
health records and a machine learning algorithm. Int J Med Inform 2020 May;137:104105 [FREE Full text] [doi:
10.1016/j.ijmedinf.2020.104105] [Medline: 32193089]
28. Rubenstein L. Falls in older people: epidemiology, risk factors and strategies for prevention. Age Ageing 2006 Sep;35
Suppl 2(suppl_2):ii37-ii41. [doi: 10.1093/ageing/afl084] [Medline: 16926202]
https://aging.jmir.org/2022/2/e35373 JMIR Aging 2022 | vol. 5 | iss. 2 | e35373 | p. 12
(page number not for citation purposes)
XSL• FO
RenderXJMIR AGING Thapa et al
29. Inouye S, Studenski S, Tinetti M, Kuchel G. Geriatric syndromes: clinical, research, and policy implications of a core
geriatric concept. J Am Geriatr Soc 2007 May;55(5):780-791 [FREE Full text] [doi: 10.1111/j.1532-5415.2007.01156.x]
[Medline: 17493201]
30. Paliwal Y, Slattum P, Ratliff S. Chronic health conditions as a risk factor for falls among the community-dwelling US older
adults: a zero-inflated regression modeling approach. Biomed Res Int 2017;2017:5146378 [FREE Full text] [doi:
10.1155/2017/5146378] [Medline: 28459060]
31. Hendrich A, Bender P, Nyhuis A. Validation of the Hendrich II Fall Risk Model: a large concurrent case/control study of
hospitalized patients. Appl Nurs Res 2003 Feb;16(1):9-21. [doi: 10.1053/apnr.2003.YAPNR2] [Medline: 12624858]
32. Butt DA, Mamdani M, Austin PC, Tu K, Gomes T, Glazier RH. The risk of hip fracture after initiating antihypertensive
drugs in the elderly. Arch Intern Med 2012 Dec 10;172(22):1739-1744. [doi: 10.1001/2013.jamainternmed.469] [Medline:
23165923]
33. Seppala L, Petrovic M, Ryg J, Bahat G, Topinkova E, Szczerbińska K, et al. STOPPFall (Screening Tool of Older Persons
Prescriptions in older adults with high fall risk): a Delphi study by the EuGMS Task and Finish Group on fall-risk-increasing
drugs. Age Ageing 2021 Jun 28;50(4):1189-1199 [FREE Full text] [doi: 10.1093/ageing/afaa249] [Medline: 33349863]
34. Berry SD, Placide SG, Mostofsky E, Zhang Y, Lipsitz LA, Mittleman MA, et al. Antipsychotic and benzodiazepine drug
changes affect acute falls risk differently in the nursing home. J Gerontol A Biol Sci Med Sci 2016 Feb 05;71(2):273-278
[FREE Full text] [doi: 10.1093/gerona/glv091] [Medline: 26248560]
35. Ensrud KE, Blackwell TL, Mangione CM, Bowman PJ, Whooley MA, Bauer DC, Study of Osteoporotic Fractures Research
Group. Central nervous system-active medications and risk for falls in older women. J Am Geriatr Soc 2002 Oct
17;50(10):1629-1637. [doi: 10.1046/j.1532-5415.2002.50453.x] [Medline: 12366615]
36. Choi SY, Park YH, Kim J, Gwaka H, Song Y. Fall risk in hospitalized elderly patients with drugs that induce the fall.
Journal of Korean Society of Health System Pharmacists 2012 Jun;29(2):182-187. [doi: 10.32429/jkshp.2012.29.2.007]
37. Yoshikawa A, Ramirez G, Smith M, Foster M, Nabil A, Jani S, et al. Opioid use and the risk of falls, fall injuries and
fractures among older adults: a systematic review and meta-analysis. J Gerontol A Biol Sci Med Sci 2020 Sep
25;75(10):1989-1995. [doi: 10.1093/gerona/glaa038] [Medline: 32016284]
38. de Vries M, Seppala LJ, Daams JG, van de Glind EM, Masud T, van der Velde N, EUGMS TaskFinish Group on
Fall-Risk-Increasing Drugs. Fall-risk-increasing drugs: a systematic review and meta-analysis: I. Cardiovascular drugs. J
Am Med Dir Assoc 2018 Apr;19(4):371.e1-371.e9. [doi: 10.1016/j.jamda.2017.12.013] [Medline: 29396189]
39. Ham AC, van Dijk SC, Swart KM, Enneman AW, van der Zwaluw NL, Brouwer-Brolsma EM, et al. Beta-blocker use and
fall risk in older individuals: original results from two studies with meta-analysis. Br J Clin Pharmacol 2017 Oct
04;83(10):2292-2302 [FREE Full text] [doi: 10.1111/bcp.13328] [Medline: 28589543]
40. Lam C, Hsieh S, Wang J, Pan H, Liu X, Ho Y, et al. Incidence and characteristic analysis of in-hospital falls after anesthesia.
Perioper Med (Lond) 2016 May 23;5(1):11 [FREE Full text] [doi: 10.1186/s13741-016-0038-z] [Medline: 27222708]
41. Baranzini F, Diurni M, Ceccon F, Poloni N, Cazzamalli S, Costantini C, et al. Fall-related injuries in a nursing home setting:
is polypharmacy a risk factor? BMC Health Serv Res 2009 Dec 11;9(1):228 [FREE Full text] [doi: 10.1186/1472-6963-9-228]
[Medline: 20003327]
42. Chen T, Guestrin C. XGBoost: a scalable tree boosting system. In: Proceedings of the 22nd ACM SIGKDD International
Conference on Knowledge Discovery and Data Mining. 2016 Presented at: KDD '16: Proceedings of the 22nd ACM
SIGKDD International Conference on Knowledge Discovery and Data Mining; Aug 13 - 17, 2016; San Francisco California
USA URL: https://dl.acm.org/doi/10.1145/2939672.2939785 [doi: 10.1145/2939672.2939785]
43. Pedregosa F, Varoquaux G, Gramfort A, Michel V, Thirion B, Grisel O, et al. Scikit-learn: machine learning in Python. J
Mach Learn Res 2011;12:2825-2830. [doi: 10.5555/1953048.2078195]
44. Ryan L, Mataraso S, Siefkas A, Pellegrini E, Barnes G, Green-Saxena A, et al. A machine learning approach to predict
deep venous thrombosis among hospitalized patients. Clin Appl Thromb Hemost 2021 Feb 24;27:1076029621991185
[FREE Full text] [doi: 10.1177/1076029621991185] [Medline: 33625875]
45. Allen A, Mataraso S, Siefkas A, Burdick H, Braden G, Dellinger RP, et al. A racially unbiased, machine learning approach
to prediction of mortality: algorithm development study. JMIR Public Health Surveill 2020 Oct 22;6(4):e22400 [FREE
Full text] [doi: 10.2196/22400] [Medline: 33090117]
46. Radhachandran A, Garikipati A, Zelin NS, Pellegrini E, Ghandian S, Calvert J, et al. Prediction of short-term mortality in
acute heart failure patients using minimal electronic health record data. BioData Min 2021 Mar 31;14(1):23 [FREE Full
text] [doi: 10.1186/s13040-021-00255-w] [Medline: 33789700]
47. Radhachandran A, Garikipati A, Iqbal Z, Siefkas A, Barnes G, Hoffman J, et al. A machine learning approach to predicting
risk of myelodysplastic syndrome. Leuk Res 2021 Oct;109:106639 [FREE Full text] [doi: 10.1016/j.leukres.2021.106639]
[Medline: 34171604]
48. Giang C, Calvert J, Rahmani K, Barnes G, Siefkas A, Green-Saxena A, et al. Predicting ventilator-associated pneumonia
with machine learning. Medicine (Baltimore) 2021 Jun 11;100(23):e26246 [FREE Full text] [doi:
10.1097/MD.0000000000026246] [Medline: 34115013]
https://aging.jmir.org/2022/2/e35373 JMIR Aging 2022 | vol. 5 | iss. 2 | e35373 | p. 13
(page number not for citation purposes)
XSL• FO
RenderXJMIR AGING Thapa et al
49. Rodríguez-Pérez R, Bajorath J. Interpretation of compound activity predictions from complex machine learning models
using local approximations and Shapley values. J Med Chem 2020 Aug 27;63(16):8761-8777. [doi:
10.1021/acs.jmedchem.9b01101] [Medline: 31512867]
50. Klein D, Nagel G, Kleiner A, Ulmer H, Rehberger B, Concin H, et al. BMC Geriatr 2013 May 21;13:50 [FREE Full text]
[doi: 10.1186/1471-2318-13-50] [Medline: 23692779]
51. Kiely D, Kiel D, Burrows A, Lipsitz L. Identifying nursing home residents at risk for falling. J Am Geriatr Soc 1998
May;46(5):551-555. [doi: 10.1111/j.1532-5415.1998.tb01069.x] [Medline: 9588366]
52. Appeadu M, Bordoni B. Falls and Fall Prevention In The Elderly. Treasure Island (FL): StatPearls Publishing; 2022.
53. Marier A, Olsho L, Rhodes W, Spector W. Improving prediction of fall risk among nursing home residents using electronic
medical records. J Am Med Inform Assoc 2016 Mar;23(2):276-282 [FREE Full text] [doi: 10.1093/jamia/ocv061] [Medline:
26104743]
54. Avidan A, Fries B, James M, Szafara K, Wright G, Chervin R. Insomnia and hypnotic use, recorded in the minimum data
set, as predictors of falls and hip fractures in Michigan nursing homes. J Am Geriatr Soc 2005 Jun;53(6):955-962. [doi:
10.1111/j.1532-5415.2005.53304.x] [Medline: 15935017]
55. French DD, Werner DC, Campbell RR, Powell-Cope GM, Nelson AL, Rubenstein LZ, et al. A multivariate fall risk
assessment model for VHA nursing homes using the minimum data set. J Am Med Dir Assoc 2007 Feb;8(2):115-122. [doi:
10.1016/j.jamda.2006.08.005] [Medline: 17289542]
56. CDC STEADI : evaluation guide for older adult clinical fall prevention programs. Centers for Disease Control and Prevention.
2019. URL: https://stacks.cdc.gov/view/cdc/78041 [accessed 2022-03-13]
57. Viveiro LA, Gomes GC, Bacha JM, Carvas Junior N, Kallas ME, Reis M, et al. Reliability, validity, and ability to identity
fall status of the Berg Balance Scale, Balance Evaluation Systems Test (BESTest), Mini-BESTest, and Brief-BESTest in
older adults who live in nursing homes. J Geriatr Phys Ther 2019;42(4):E45-E54. [doi: 10.1519/JPT.0000000000000215]
[Medline: 30407272]
58. Majkusová K, Jarošová D. Validity of tools for assessing the risk of falls in patients. Cent Eur J Nurs Midw 2017 Sep
30;8(3):697-705. [doi: 10.15452/cejnm.2017.08.0021]
59. Herings RM. Benzodiazepines and the risk of falling leading to femur fractures. Arch Intern Med 1995 Sep 11;155(16):1801.
[doi: 10.1001/archinte.1995.00430160149015]
60. Jeon E, Oh K, Kwon S, Son H, Yun Y, Jung E, et al. A lightweight deep learning model for fast electrocardiographic beats
classification with a wearable cardiac monitor: development and validation study. JMIR Med Inform 2020 Mar 12;8(3):e17037
[FREE Full text] [doi: 10.2196/17037] [Medline: 32163037]
61. Tang Z, Shi Y, Wang D, Feng Y, Zhang S. Memory visualization for gated recurrent neural networks in speech recognition.
In: Proceedings of the 2017 IEEE International Conference on Acoustics, Speech and Signal Processing (ICASSP). 2017
Presented at: 2017 IEEE International Conference on Acoustics, Speech and Signal Processing (ICASSP); Mar 5-9, 2017;
New Orleans, LA, USA. [doi: 10.1109/icassp.2017.7952654]
62. Martinez J, Black M, Romero J. On human motion prediction using recurrent neural networks. In: Proceedings of the 2017
IEEE Conference on Computer Vision and Pattern Recognition (CVPR). 2017 Presented at: 2017 IEEE Conference on
Computer Vision and Pattern Recognition (CVPR); Jul 21-26, 2017; Honolulu, HI, USA URL: http://ieeexplore.ieee.org/
document/8099980/ [doi: 10.1109/cvpr.2017.497]
63. Li R, Hu B, Liu F, Liu W, Cunningham F, McManus DD, et al. Detection of bleeding events in electronic health record
notes using convolutional neural network models enhanced with recurrent neural network autoencoders: deep learning
approach. JMIR Med Inform 2019 Feb 08;7(1):e10788 [FREE Full text] [doi: 10.2196/10788] [Medline: 30735140]
Abbreviations
AUROC: area under the receiver operating characteristic
EHR: electronic health record
ICD: International Classification of Diseases
MDS: minimum data set
ML: machine learning
MLA: machine learning algorithm
ROC: receiver operating characteristic
SHAP: Shapely Additive Explanations
XGBoosting: Extreme Gradient Boosting
https://aging.jmir.org/2022/2/e35373 JMIR Aging 2022 | vol. 5 | iss. 2 | e35373 | p. 14
(page number not for citation purposes)
XSL• FO
RenderXJMIR AGING Thapa et al
Edited by J Wang; submitted 02.12.21; peer-reviewed by M Pardeshi, Y Xie; comments to author 27.12.21; revised version received
16.01.22; accepted 07.02.22; published 01.04.22
Please cite as:
Thapa R, Garikipati A, Shokouhi S, Hurtado M, Barnes G, Hoffman J, Calvert J, Katzmann L, Mao Q, Das R
Predicting Falls in Long-term Care Facilities: Machine Learning Study
JMIR Aging 2022;5(2):e35373
URL: https://aging.jmir.org/2022/2/e35373
doi: 10.2196/35373
PMID: 35363146
©Rahul Thapa, Anurag Garikipati, Sepideh Shokouhi, Myrna Hurtado, Gina Barnes, Jana Hoffman, Jacob Calvert, Lynne
Katzmann, Qingqing Mao, Ritankar Das. Originally published in JMIR Aging (https://aging.jmir.org), 01.04.2022. This is an
open-access article distributed under the terms of the Creative Commons Attribution License
(https://creativecommons.org/licenses/by/4.0/), which permits unrestricted use, distribution, and reproduction in any medium,
provided the original work, first published in JMIR Aging, is properly cited. The complete bibliographic information, a link to
the original publication on https://aging.jmir.org, as well as this copyright and license information must be included.
https://aging.jmir.org/2022/2/e35373 JMIR Aging 2022 | vol. 5 | iss. 2 | e35373 | p. 15
(page number not for citation purposes)
XSL• FO
RenderXYou can also read